

The thrill of competition. The sweet taste of victory.
Encourage engagement in your Tableau community, improve skills, and excite them with an event that works for you and your users. We’ve taken our years of experience in running viz contests, and packaged up our top tips just for you.
What are Viz Games?
Many customers love running Tableau viz competitions and we want to help make it easy with a ready-made guide to help you run your own.
Who is it for?
No matter if you’re an analyst, manager, or someone with limited experience using Tableau, Viz Games enhances your organization’s Data Culture in a fun, competitive way. It gets people in your organization building something uniquely creative, and sharing perspectives with each other. With Viz Games, your team will be enhancing their Tableau skills while strengthening a data-driven culture.
How do I run a competition?
Select a format: There are a number of options to choose from when running Viz Games. Whatever the format you choose, Viz Games can work for you.

Competition format examples
Workshop Competition
A group contest. Everyone takes part.
Participants are given the same dataset to work from at the beginning of a set period of time and then present their viz at the end. Judges (or the audience clapometer) can decide who wins, but it’s the taking part that counts!
Timed Viz Competition
3 finalists, 20 minutes, one winner, eternal glory. The judges pick a winner.
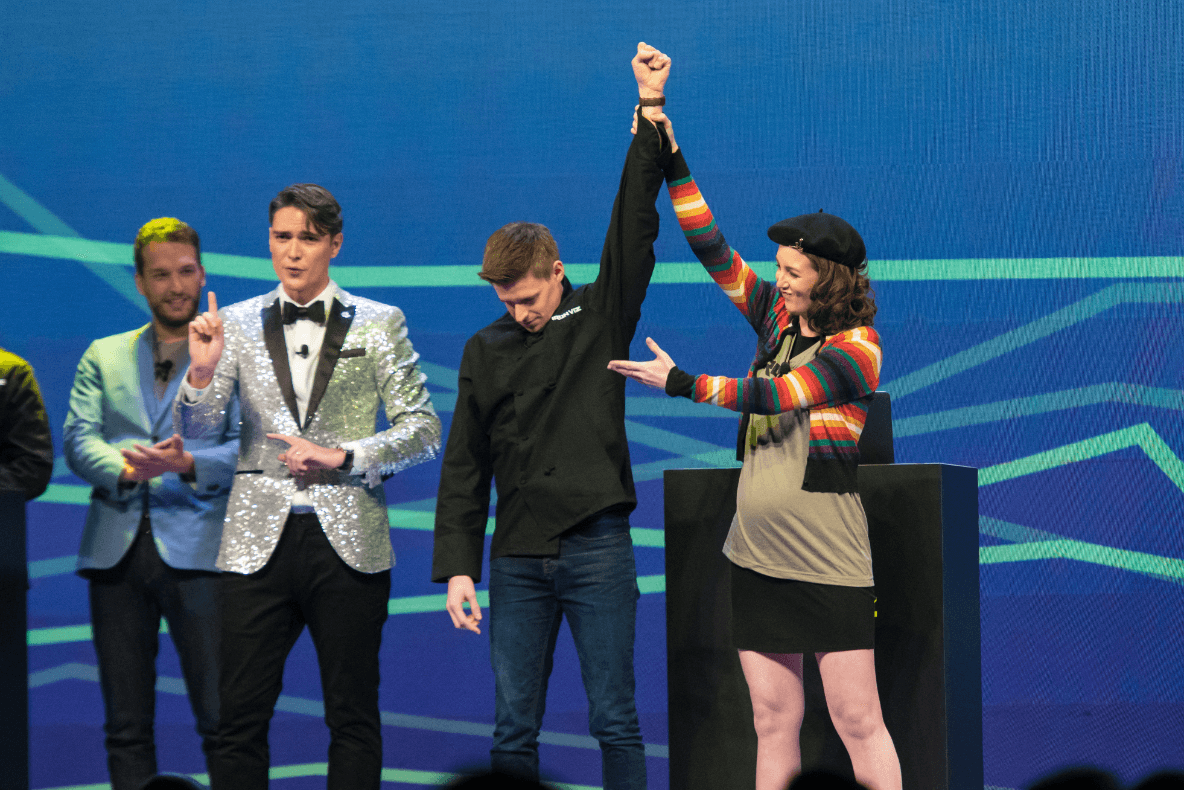
This type of contest requires considerable thought with regards to audio visual requirements. How can you best share people’s work with the audience as they are working on it there and then? Throughout the duration of the contest, you will also require an MC/host(s) to keep the event flowing, to talk to the crowd, to discuss what’s happening on screen and keep the 20 minutes entertaining. Sequined clothing for the host(s) are of course an optional extra.
Presentation Competition
Pre-built viz, finalists present their dashboard/viz/story and the judges pick a winner.
This contest requires the contestants to do their work ahead of time and then present their vizzes to the audience. Because of the time pre-preparing, the presentation itself will need considering in terms of how the winner is determined. People can have fun with it!

Select a theme
Setting the theme
Setting a theme up front is important because it will help guide you while building out the rest of the competition. Themes for Viz Games competitions are typically around a particular topic, dataset, business problem, chart/dashboard type, or feature. Get creative, and challenge the participants in a way that is fun and engaging!
Suggested themes
Business problem
Tailored to you and your business. Focus people’s attention on one area of your day-to-day, and allow them to bring data from different sources to help solve whatever that problem might be.
Business dataset – provide your participants with a dataset
Great data and resources
Theme isn’t the only thing to consider when looking for example datasets - size and shape are factors too. Typically large datasets (both rows and columns) offer more opportunities for deep analysis and storytelling. Here are some resources you can share with participants:
Vizzes are often most interesting when the author started with a question that they were curious about, rather than using a dataset as a starting point. Encourage people to make it about something that one can learn from the data, rather than a collection of random facts.
Select your judges

Judging panels can be a group of people with diverse experiences and perspectives to make for a balanced evaluation. We’d suggest that you have 3-5 judges.
Knowing who will be judging the contest early can be important as you can use this as a way to get people to participate. Is there someone inside (or outside) your organization who might want to be involved, and who data artists would love to put their creations in front of? An exec, a head of department, an external data viz expert, a customer of yours, or a local data journalist are just some examples of judges we’ve invited to take part in our own contests.
Scoring
For Tableau’s Iron Viz competition we use the following scoring scheme. Vizzes are judged on the basis of Analysis, Storytelling, and Design on a scale of 0 to 10. Here are a few more details of what we mean by these categories:
Analysis
Looks at things like the question(s) that are being asked and the insights the viz provides. In more detail: the type of data used, the type of charts used, the type of aggregation and statistical analysis used. How sophisticated and - more importantly - appropriate for the story/question that is being answered are these?
Storytelling
Looks at things like: whether the context of the topic is clear, the question(s) are clear, is it clear how one moves through the viz and from question to answer? Basically does it highlight what is interesting, where that is in the viz, and why that matters? All of that can be done in different ways, using color coding, text boxes, pictograms, annotations, or story points, etc., so be open-minded here.
Design
Obviously looks at how “nice” a viz looks. But a few things to watch out for are layout and flow, use of whitespace (or lack thereof), colors and decorations. What design elements contribute to engagement and speed to insight? Finally how appropriate is the design for the story that is being told?
Of course this is the way that we run it – choose a scoring system that’s appropriate for you, your organization and your situation.
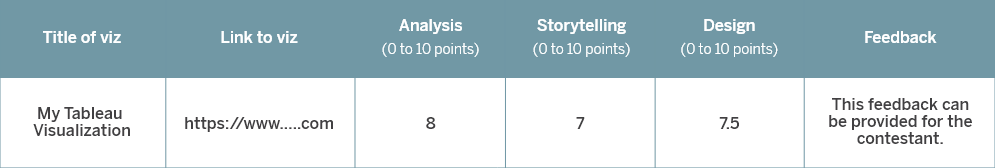
Scoring sheet
A scoring sheet is provided to contest judges in order to determine a winner. Depending on how the submission form was created, you may be able to export the submissions to spreadsheet/csv which would make it simple to create a scoring sheet. Here is an example of what that scoring sheet might look like.
Notice also the feedback column. We’ve found contestants often are very happy to have their work critiqued. You may want to have people opt in to receive feedback, and of course do consider how the feedback will be delivered. It’s advisable to make it available to the participant privately. In the case of multiple judges, scores are added up across each category and each judge – i.e. in a scenario with 3 judges a viz would score XX/90 points.
Set judges up for success by describing the scoring parameters. Definitions of scoring parameters are provided above, but some additional context may be necessary to help judges differentiate a 0 from a 10. For any category, 10 would be the best you have ever seen in your life and a 0 means the participant did nothing. You can see some examples of scores from a recent competition hosted by Tableau Public. Hover over the bar chart to see average scores, and click to view that viz.
Scoring a live competition
The scoring system remains as above, however, how a contestant presents and describes their viz can affect the scores in both the analysis and storytelling categories. Time also needs to be built into the contest to allow for the scores to be added up at the end of the contest before announcing the winner.
Announce the winners
You’ve collected the judges’ scores for all submissions, it’s time to see which viz came out on top. Add up the total scores from all judges and see which viz had the highest total score. In the case of a tie, you can use one of the scores as a tiebreaker (for example “analysis”).
Supporting content
Landing page
A landing page serves as the primary point of reference for information regarding dates, topic, and how to participate. It helps to provide some examples of other visualizations, datasets, or data sources to help participants get a better idea of what resources are easily available. You may be amazed by the creativity of your Tableau community if you give them just enough help to get started.
Make it easy for participants to understand how to participate. You want participants’ focus on making a great data visualization rather than struggling to find data or where to submit their creation. On your landing page, concisely walk them through the contest.
Promotion
The promotion phase is all about generating awareness. Whether it’s by email or word-of-mouth, you have to connect with the audience you want to engage. If the competition is internal to your organization, consider posting announcements to internal sites or your company message boards, or holding an in-person contest launch party. And if the competition extends beyond your organization, use hashtags on social media and post about the competition on public forums. The goals of the promotion phase are to raise awareness and to drum up enthusiasm for the contents.
Submission form
Participants may need a place to submit their work depending on the context of the competition. If required, submission forms typically include Name, Email, and a link to the viz on Tableau Server or Tableau Public. Only ask your contestants to publish their submissions to Tableau Public when the data they’re using can be in the public domain. If the data is private (such as if the contest involves your organization’s data), have them submit a link to their viz on your server, Tableau Cloud, or by attaching the workbook itself.
You can see an example Viz Games submission form here. Google/Sharepoint forms are a simple way of collecting this information, but of course it’s up to you!
What's next
Your Viz Games contest will have created a whole host of amazing content. Share it widely with as many people as possible.
- Re-cap the contest
- Blog with the winner
- Follow up session on your contestants/finalists design processes
Have fun
Remember to keep it light-hearted and fun. People can be competitive, so the more you can do to make it an enjoyable experience for all, the better.
Community Toolkit
Check out the other toolkits for your Tableau community