Viz your Tableau Conference schedule in 3 steps


For four days every year, thousands of data people gather in one city to geek out on all things data-related for Tableau Conference (TC). With the wide variety of sessions, trainings, meetups, keynotes, and parties, there is no doubt that you'll find valuable information or connections, but knowing where to begin can be scary. To make the most of your experience at TC19 in Las Vegas—or if you want to make your scheduling decisions truly data-driven—read on!
This year’s schedule is now available on the TC19 mobile app and TC website. New this year, is the ability to reserve your seat in all TC19 sessions. Plan your conference agenda and secure a spot in all of your sessions. Be aware that several time blocks are set to end one minute past their actual duration (e.g. a session ending at 12:16 instead of 12:15).
More on session end times below, but for the purposes of vizzing your Tableau Conference schedule, we recommend the Web Data Connector, where you can easily pull TC schedule data into Tableau for your visualization pleasure.
Get started
Step 1: Connect to data.
In Tableau Desktop, choose Web Data Connector from the Connect pane (it’s in the “To a Server” option under “More”).
Step 2: Configure.
Enter this URL: http://tc19.tableau.com/wdc/schedule. There, you can choose to connect to data about sessions or speakers—or both, using the session_speaker table to provide the link.
Step 3: Explore.
Once your data is in Tableau, let your imagination run free. Are you interested in creating a dashboard to help others navigate the schedule, or are you just mapping out your own?
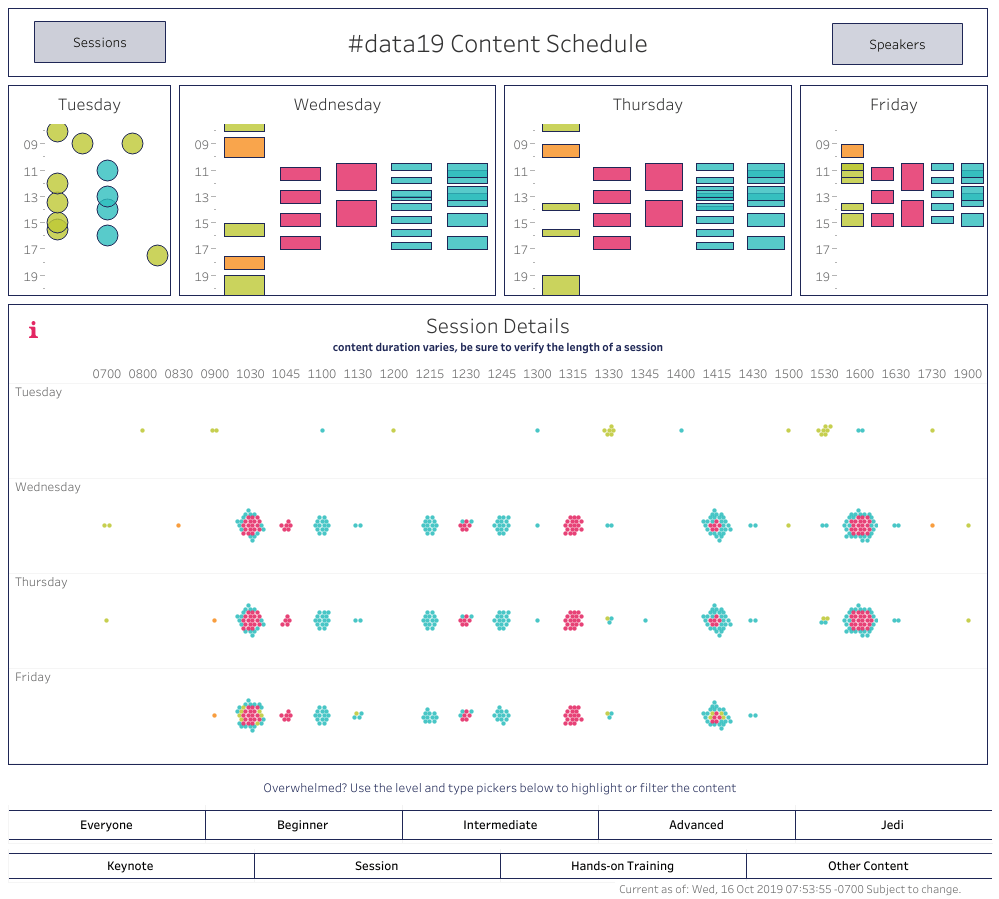
I decided to make an interactive schedule, below. The hardest part for me was figuring out how to deal with the various start times and durations of content sessions. My solution was to have a schedule overview to visually represent the different time slots separate from session details. What can you come up with?
Data source details
When you connect to the schedule data, you’ll see many fields. Here’s what they mean:
Sessions
- category - verticals of interest (Education, Finance, Financial Services, Healthcare, IT and Product Manager, Marketing, Public Sector, Retail, Sales)
- description - session abstract or description
- end_time - when the content ends (remember that end times that seem one minute too long are as expected)
- id - unique identifier for sessions (by title and timeslot, so repeated sessions have their own ID). Join on this field if using both Sessions and Speakers.
- level - difficulty level of the content (Everyone, Beginner, Intermediate, Advanced, Jedi)
- role - attendee roles that may have particular interest in this content (Analyst, Business User, Data Leader, Developer, IT Decision Maker, IT Professional)
- session_disclaimer - when the data was last refreshed
- session_type - what type of content the session is
- Ancillary: non-standard content such as morning yoga
- Certification Exam: paid add-on
- Interactive: Fanalytics, Makeover Monday LIVE, etc.
- Keynote : Iron Viz, Devs on Stage, etc.
- Hands on Training: 1 hour and 2 hour options
- Sessions: 15, 30, and 60 minute options
- Social Events and Activities: Data Night Out, anyone?
- start_time - when the content starts
- theme - all sessions fall into one or more of the 8 main themes ( Dashboard and Design, Data and Analytics Skills, Data Culture, Data Management, Embedded Analytic, Smart Analytic, Tableau at Scale, Tableau Community)
- title - session title
- topic - the most granular details about a session, including specific products and functionality
Speakers
- biography - the speaker's biography
- company - the organization the speaker comes from
- first_name - the first name of the speaker. See Notes section below for information on getting a full name.
- id - unique identifier for speakers. Join on this field if using both Sessions and Speakers.
- last_name - the last name of the speaker. See Notes section below for information on getting a full name.
- speaker_disclaimer - when the data was last refreshed
- title - the speaker’s job tile
- type - what type of speaker (Customer, Internal, Sponsor, Zen Master)
Notes on working with specific fields
Topics
The topic text field displays all topics associated with a session.
Because topics are strung together with commas, as shown in the screenshot above, you may run into trouble using filters. For example, if you were to filter for "Customer Use Cases,” you’d filter out “Customer Use Cases, Mapping” and “Customer Use Cases, ROI and Business Value” as those are recognized as different values.
Never fear! Just set up a parameter and calculation to avoid this issue:
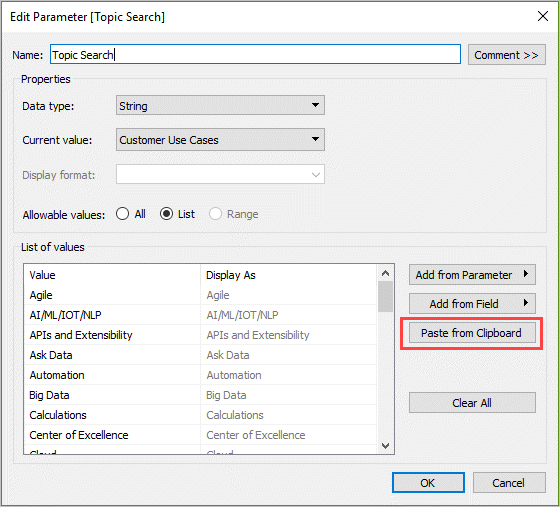
- Create a string parameter called Topic Search that’s simply a list of all possible topics. (All topics can be found in the TC19 Session Catalog.)
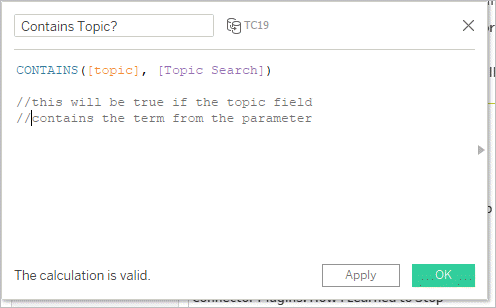
- Create a calculation that evaluates if the topic that is selected in the parameter is present in the topic field.
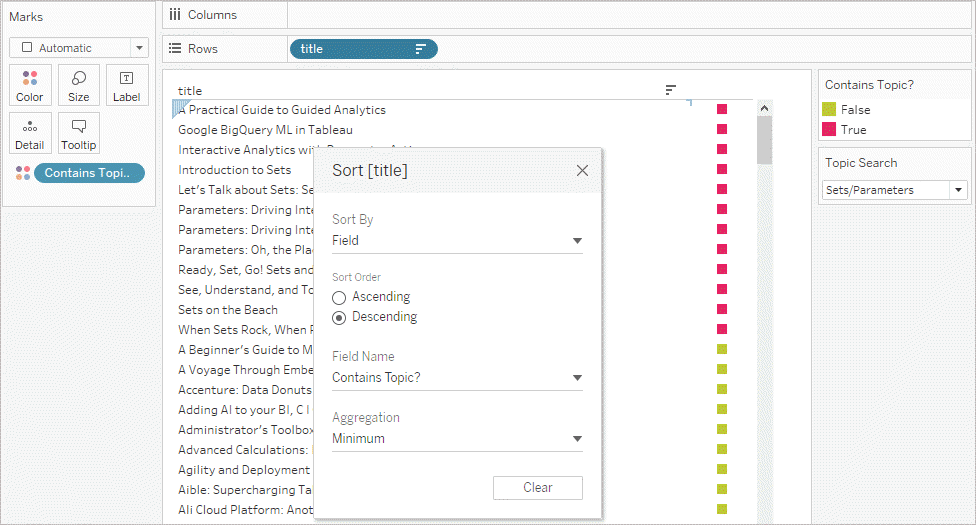
- Use that calculated field to color, filter, or otherwise manipulate your viz.
- For example: It’s easy to create a parameter for a list of values by simply pasting the values. Select the entire list of tags, as in the screenshot below, and use the “Paste from Clipboard” option.
Then, create a calculated field that simply evaluates True or False if the topic field contains the tag from the Topic Search parameter.
Now it’s easy to identify which sessions have a specific topic. You can use the calculated field to identify sessions with that topic. For example, you can filter to sessions where [Contains Topic?] = TRUE, or use the field on color and sort to bring true values to the top like in the screenshot below.
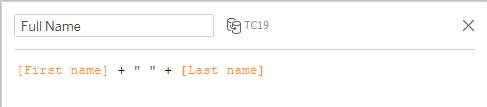
Full Name
To get the full name of the speaker, you’ll need to concatenate the First Name and Last Name fields. Don’t forget the space between them!
Start Time and End Time
As we mentioned at the beginning of this blog, several time blocks for sessions appear to end one minute after their actual end time. For example, a session may end at 10:00am, but it appears to end at 10:01am. This was built in to ensure that attendees can't overbook their schedule and prevent mistakes in registering for back-to-back sessions they can't actually attend. This detail is relevant for you if you're calculating duration or working with end times in the WDC schedule data.
By default, the Start Time and End time fields will come into your Tableau view as discrete dates—meaning, when you drag them onto the canvas, they’ll start with Year and be drillable down to Quarter, Month, etc.
If you set these fields to Exact Date, they’ll adhere to this format: 111/14/2019 11:45:00 AM. (Depending on where the field is used, it might also need to be set to Discrete.) But you can easily change the display properties of these fields so they show up how you want:
1) Access the format menu.
To set the default format of the date field:
- Right-click on the field in the data pane and select Default Properties > Date format.
To set the format for the date field in a specific viz:
- Bring the field into the view. Right-click on the pill and choose Format.
- The format pane will open over the data pane.
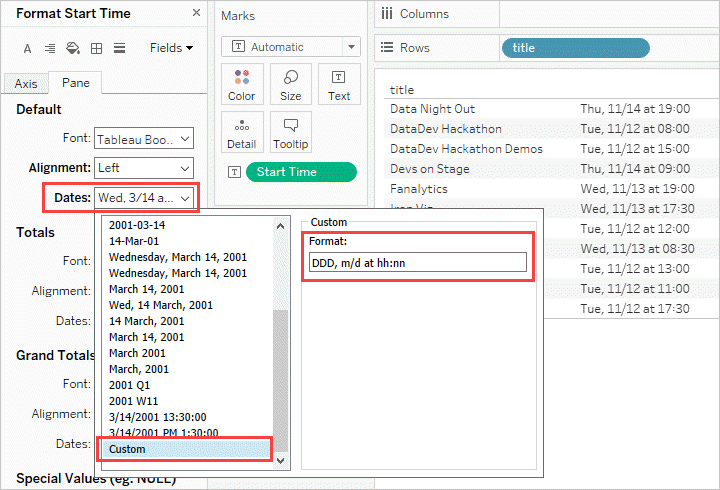
- Find the dates option under the Default section and expand the menu.
2) Choose Custom from the list and enter in the custom format you want for your date values.
- For example, dddd, m/d hh:nn AMPM would appear as “Thursday, 11/14 10:30 AM.”
The Custom format options are extensive, but some common ones are:
- dddd = full day of the week, such as Thursday
- ddd = abbreviated day of the week, such as Thu
- dd and d = numerical day, such as 12
- mmmm = full month, such as November
- mmm = abbreviated month, such as Nov
- mm and m = numerical month, such as 11
- hh = the numerical hour, such as 9
- nn = the numerical minute, such as 30
- AMPM = this will show AM or PM depending on which is applicable
- Only some punctuation is supporting in the format:
- Supported: . , ( ) / : - | { }
- Not supported: @ [
- Some letters already have meaning and can’t be used, but “at” can be typed out
- As an example, here’s some data formats and their results:
- ddd - hh:nn AMPM → Tue - 11:45AM
- dddd | hh:nn (AMPM) → Wednesday | 12:45 (PM)
- mm/dd at hh:nn AMPM → 11/13 at 10:30 AM
We recommend having a date in the view as you’re setting the custom format. It’s responsive, so you can test your formatting in real time.
Colors
Want to brand your dashboard with TC19 colors? It’s easy! Simply add the custom color palette to your preferences file.
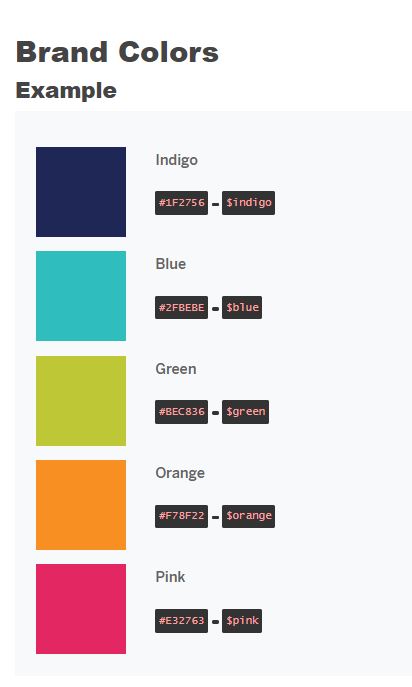
Detailed directions on how to Create Custom Color Palettes can be found in the Tableau Help.
Find the Tableau Conference schedule on the TC19 mobile app and TC website and viz your schedule. If you don’t already have your TC ticket, get it now! Don’t miss out on your chance to learn from and connect with 20,000 other data people. See you in Las Vegas, November 12–15.
相关故事

5 Ways to Use Tableau Public to Achieve Your Goals
 2025/01/11

World Mental Health Day: Elevating Awareness Through Data Visualization
 2024/10/10

From TV Screens to Tableau: Visualize Your Favorite Shows with IMDb
 2024/08/31