Use Dashboard Actions to Reduce Visual Clutter


All submissions to our first Iron Viz feeder contest are now available for your viewing and voting pleasure! And while everyone's voting and promoting their favorite vizzes, we plan to keep you entertained with some food vizzes and viz-making tips of our own.
While I initially planned to make a viz about cheese or wine (pardon me, I'm French!), I realized that burgers would make for a more universal food conversation. I took an economy angle to this topic by retrieving the data from The Economist's famous Big Mac index.
Below is my take at reproducing The Economist's Big Mac index dashboard, with some filtering action tips for those of you who are still not completely comfortable with that.

Before I share with you three tips to make your life (and dashboard designing) easier, here is a quick reminder on what dashboard actions are and what they do.
- You have the choice between three types of actions: filter, highlight, or URL
- You'll have to decide which element(s) of your dashboard trigger the action (the source sheets), and which element(s) are affected by the action (the target sheets)
- You will also decide whether the action should happen on hover, selection, or as a menu (i.e. a hyperlink to apply the action that shows up in the tooltip upon selection of an element)
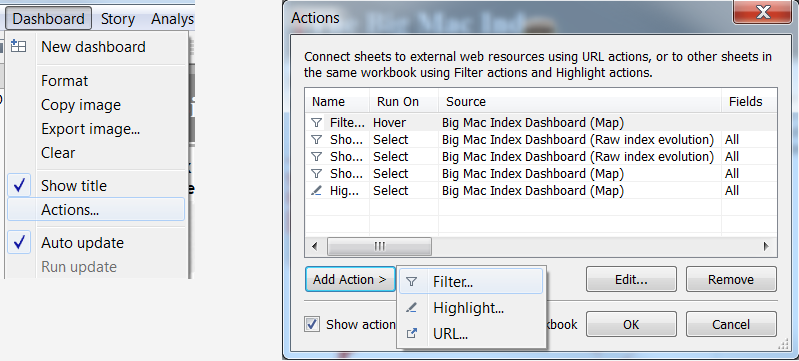
In the top menu, select Dashboard > Actions... > Add action.
And now, the three tips.
1. Make Sure the Source and Target Sheet(s) Both Contain the Filtering Dimensions
If you're scratching your head, wondering why your filter action doesn't work, a quick debug action is to check whether your source and target sheets share the same dimensions. For instance, trying to filter a bar chart (target sheet) by selecting a country on a map (source sheet) will not work if the bar chart doesn't contain the country dimension in the Marks, Columns, or Rows shelves.
2. Mentally Map Your Actions before You Start
A simple diagram of which source sheet(s) should interact with which target sheet(s) can go a long way in helping you save time and energy. if you're having a lot of dashboard action going on, go with pen and paper, and map all your sheets (big squares) and actions (arrows). Do not start implementing before you have the big picture.
3. Name Your Actions So that You Know What They Do
If despite step #2, you're still having trouble making your actions work, it will be much easier to debug your dashboard if you have given clear names to each of your actions. I did spend some time trouble shooting actions in my Big Mac index viz and you'll see below that I ended up giving very explicit names to each action to help myself.
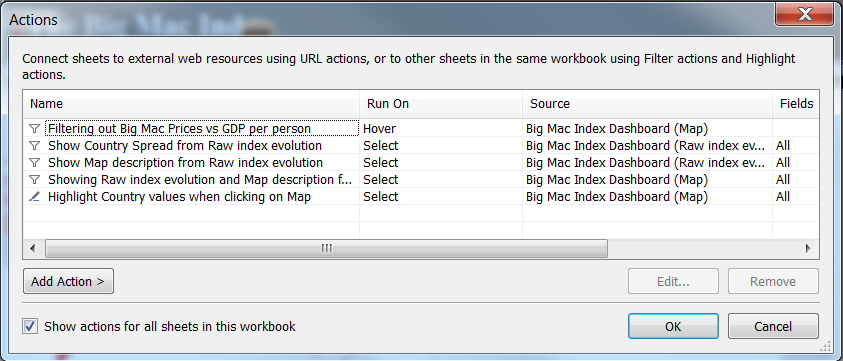
Here's an example list of specifically-named actions.
Now, go forth and use these actions to reduce clutter on your own dashboards!
相关故事

Iron Viz 2026: Read Between the Data
 2026/05/28

Tableau's Iron Viz Winners

Explore the 2026 Iron Viz Entries
 2025/12/15