How to Use Sampling in Tableau Prep


Tableau Prep is a data exploration and preparation tool that provides a visual, no code way for you to derive insights, by allowing you to interactively explore, clean, and shape your data in real-time before analysis. With Prep, you author (create or edit) flows, which are visualizations of the transformations you’re going to perform on your data. When you run your Prep flow, Prep runs the transformations you created against your input data and generates at least one data output.
Sampling Overview
In an ideal world, everyone would use full datasets to author their Prep flows. We unfortunately don’t live in an ideal world. Prep allows you to interactively explore and prepare your data by loading data into memory. Sometimes loading all data isn’t technically possible because your computer doesn’t have enough compute and memory resources.
A way around these bottlenecks is to use a subset of the full dataset. In other words, use a sample. In authoring mode, Prep automatically limits the amount of data it processes to ensure Prep is responsive while you author your flows. When you run your Prep flow, it’s always run on your entire dataset—and not to a sample—so you can walk away with a clean, ready-to-analyze dataset.
Tableau Prep’s Sampling Intelligence
Prep leverages an intelligent algorithm to determine the maximum number of rows required to effectively explore and prepare data. As mentioned in the Best Practices to Improve the Performance of Your Data Preparation Flows blog, the algorithm is rather complex, and considers the number of columns and their respective data types per Input Step.
Simply put, the more columns that are in your input data, the smaller the number of rows that Prep will allow. Prep will only apply sampling if the number of rows in your dataset is larger than the maximum number of rows. Prep otherwise won’t apply sampling and will load your entire input dataset.
Other Considerations
Filters applied in the Input Step filter remove data while authoring and running your flow. If you know that certain values, such as nulls, aren’t required for your analysis, filtering them upfront guarantees the data won’t be included when you author or run your flow. Starting in the 2023.1 release, you can add no-code relative date filters for DateTime data types in the Input Step.
Removing columns that aren’t needed upfront helps as well. If you have a large dataset that triggers sampling, removing columns in the Input Step will increase the number of rows that Prep loads. When sampling isn’t applied, removing columns in the Input Step will reduce the data volume that Prep loads.
Introducing Tableau Prep Stratified Sampling
Starting in the Tableau Prep 2023.3 version, you can use the new Stratified Row Selection to control how Prep samples data. You simply choose a column that you’re the most interested in, say State, and Prep will automatically select an equal number of rows for each value in the State column.
Previously, if you had a large dataset, and wanted a representative sample while authoring your Prep flow, you had to use the Maximum Number of Rows and Random Row Selection. The downsides are, depending on your compute resources, you can bog Prep down by loading the maximum amount of data, plus random truly is random, meaning you might not load the rows that you’re the most interested in.
How to Select the Best Sampling Settings
Automatic Number of Rows and Quick Select Row Selection are enabled by default. These are optimized to load data quickly and give most users enough data to confidently author their Prep flows. In fact, over 95% of users don’t change the defaults.
Sometimes you just need to understand the structure of your data, and would like Prep to be as responsive as possible. In those cases, you can use Specify Number of Rows with a small number of rows—1,000 or less—to speed up the time to load data and to improve Prep’s responsiveness.
Other times, you may have a large dataset, compute resources that meet the high performance requirements, and would like to pull in as much data into Prep as possible. In those cases, you can select Maximum Number of Rows to load up to 1 million rows.
Before the 2023.3 release, when you needed a representative sample, you would use Random Row Selection. This provides a better representation than Quick Select, which looks at the first N rows of your input data, plus rows that Prep already loaded, but loads data slower. The other downside is that you can’t direct the randomness.
Enter Stratified Row Selection. When you know your data, and want to direct which rows you have to a representative sample across, such as US states. The option takes longer to load data than Quick Select or Random Row but gives you the most representative sample.
Getting Started with Stratified Sampling
You can change the sampling settings for the Number of Rows and Row Selection in the Input Step.
Getting started takes just a few clicks:
- Navigate to the Input Step
- Select the Stratified Row Selection option
- Select a column to distribute sampled rows across
- Optionally, select a different Number of Rows
Let’s Look at an Example
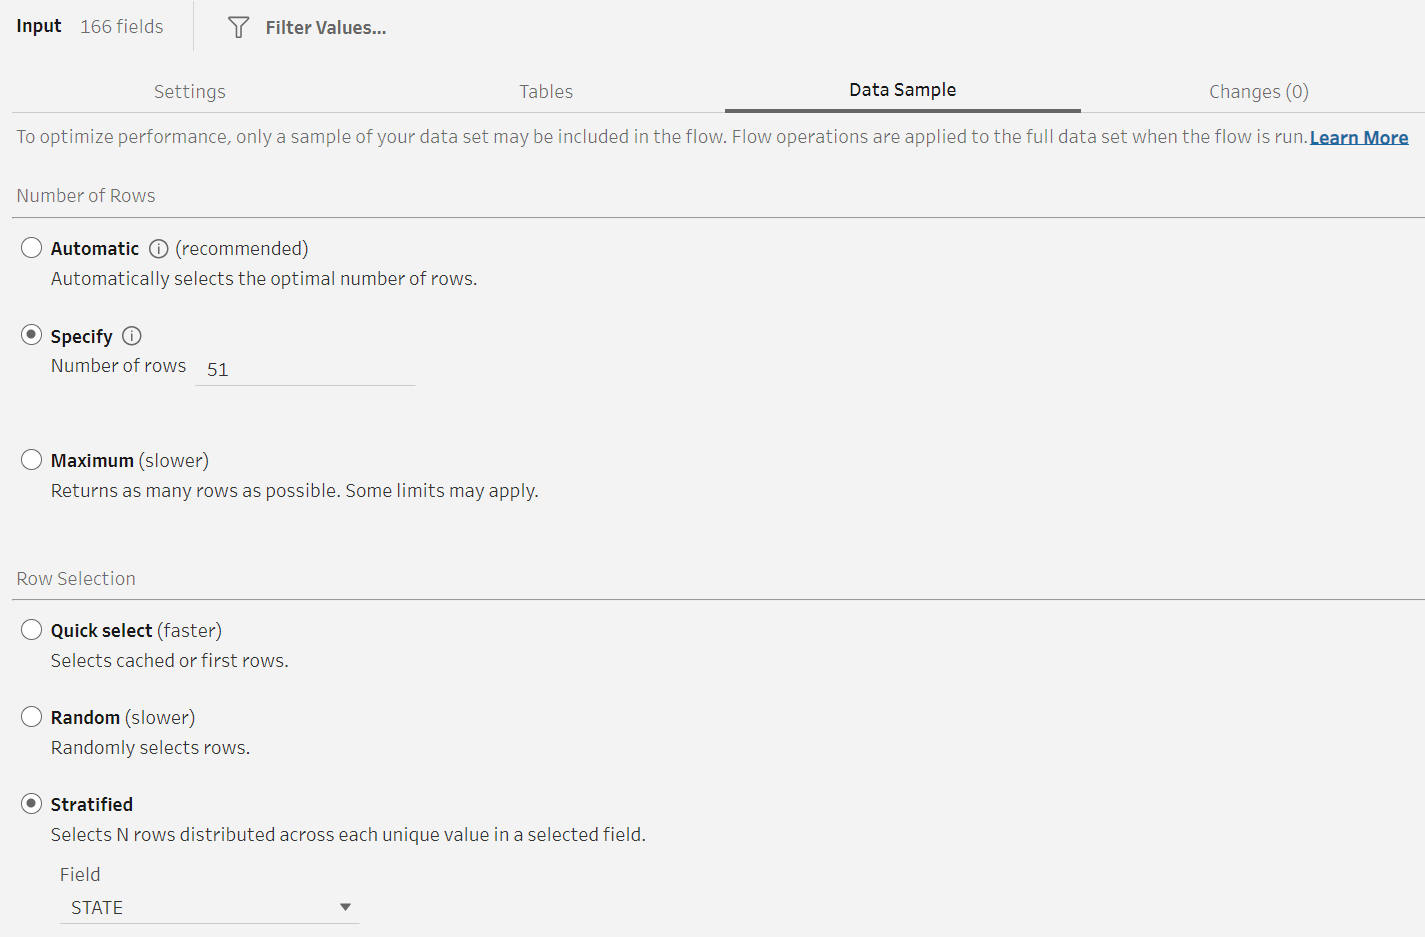
I built a Prep flow to analyze IRS tax returns by ZIP code and adjusted gross income (i.e. AGI). The file is quite large—over 200MB—and contains far too many rows for me to analyze. I instead start by exploring a single row from each state. I changed the Row Selection to Stratified and chose the STATE column to stratify across. I then selected Specify Number of Rows and set the limit to 51 to account for all U.S. states and the District of Columbia.
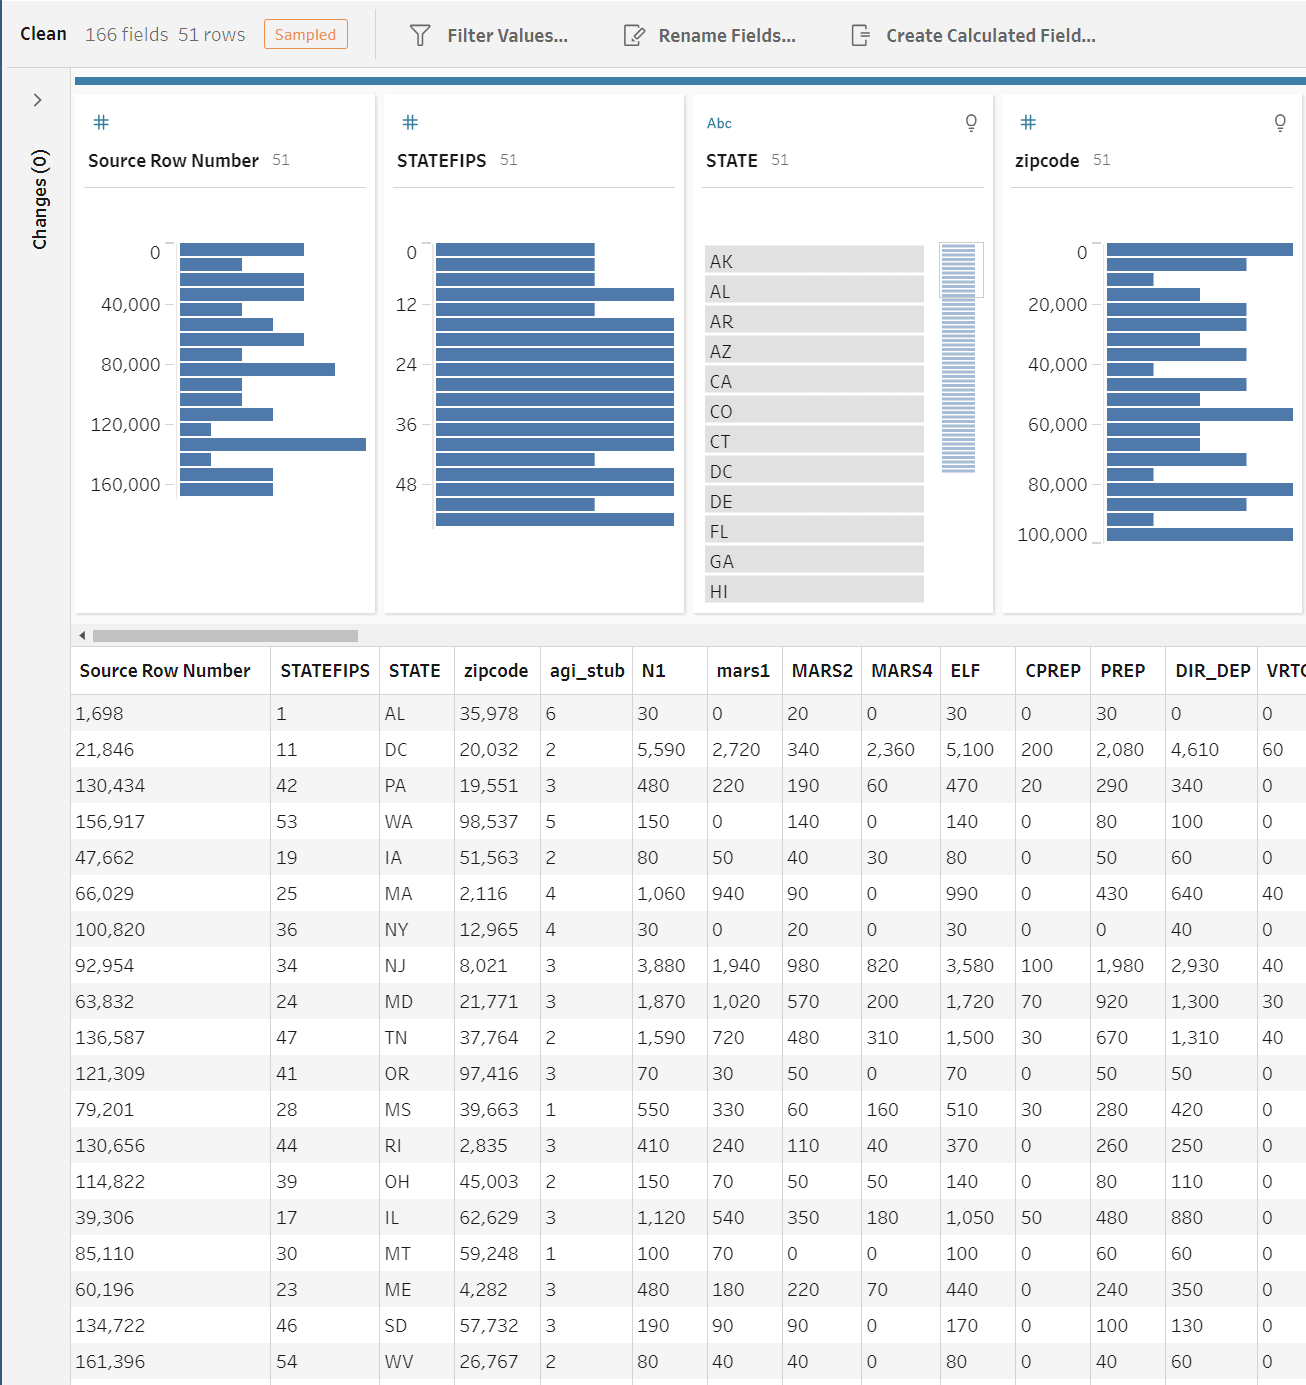
When I navigate to the Clean Step, I see an uniform distribution of rows per state, with exactly 1 row per state.
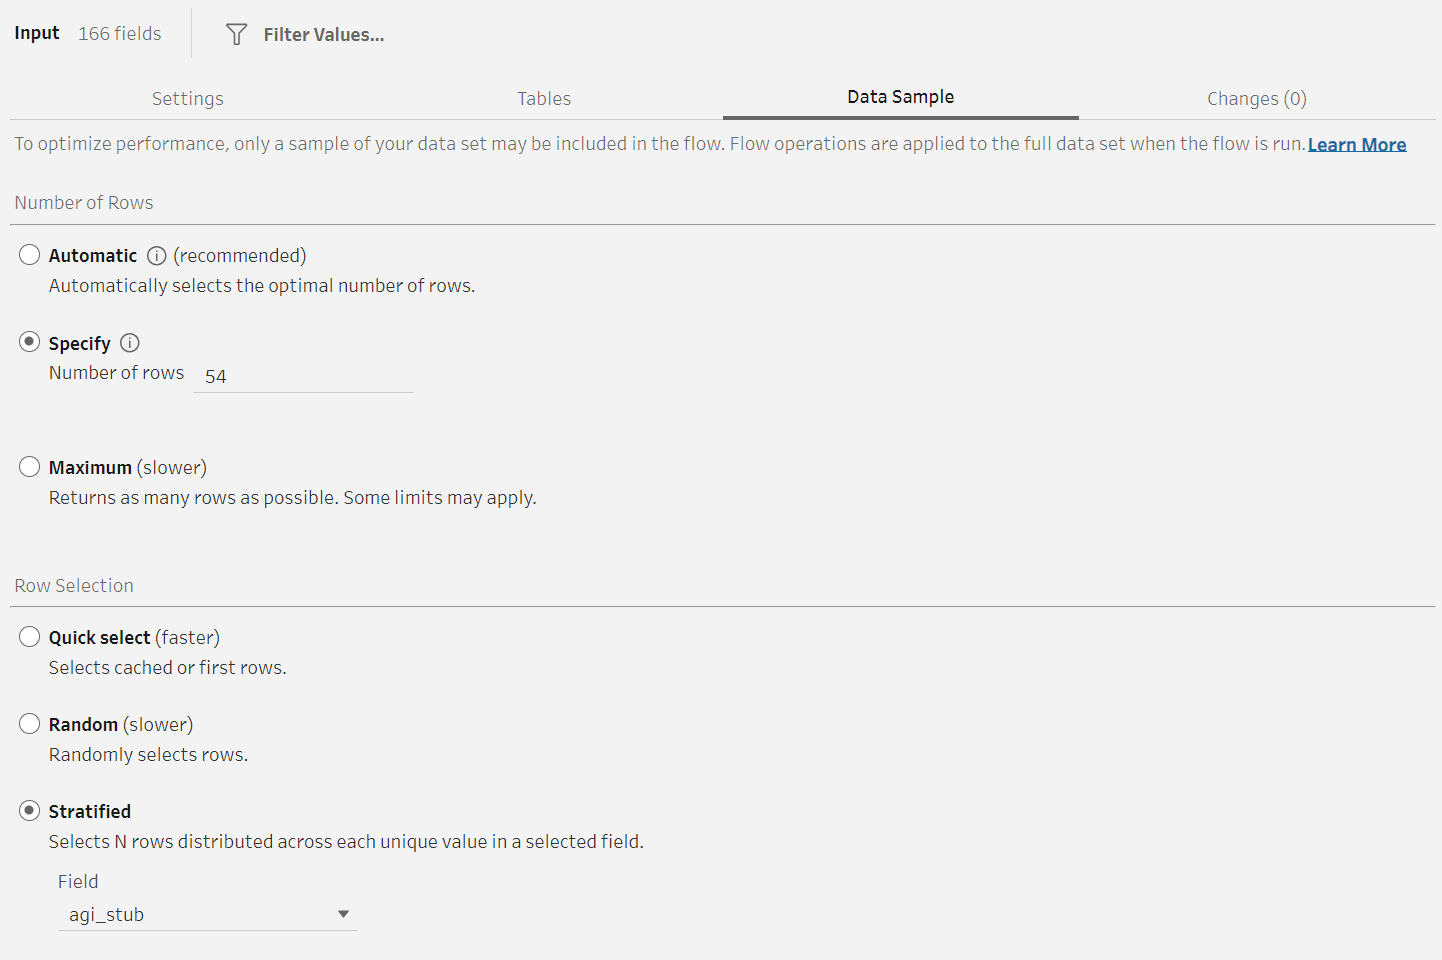
Let’s say that I want to stratify values across a different column though. I navigate back to the Input Step, and choose a different column to stratify across. This time by the adjusted gross income size (i.e. agi_stub) column. Since I know there are 6 categories I also change the Number of Rows to 54 (a multiple of 6) for illustrative purposes.
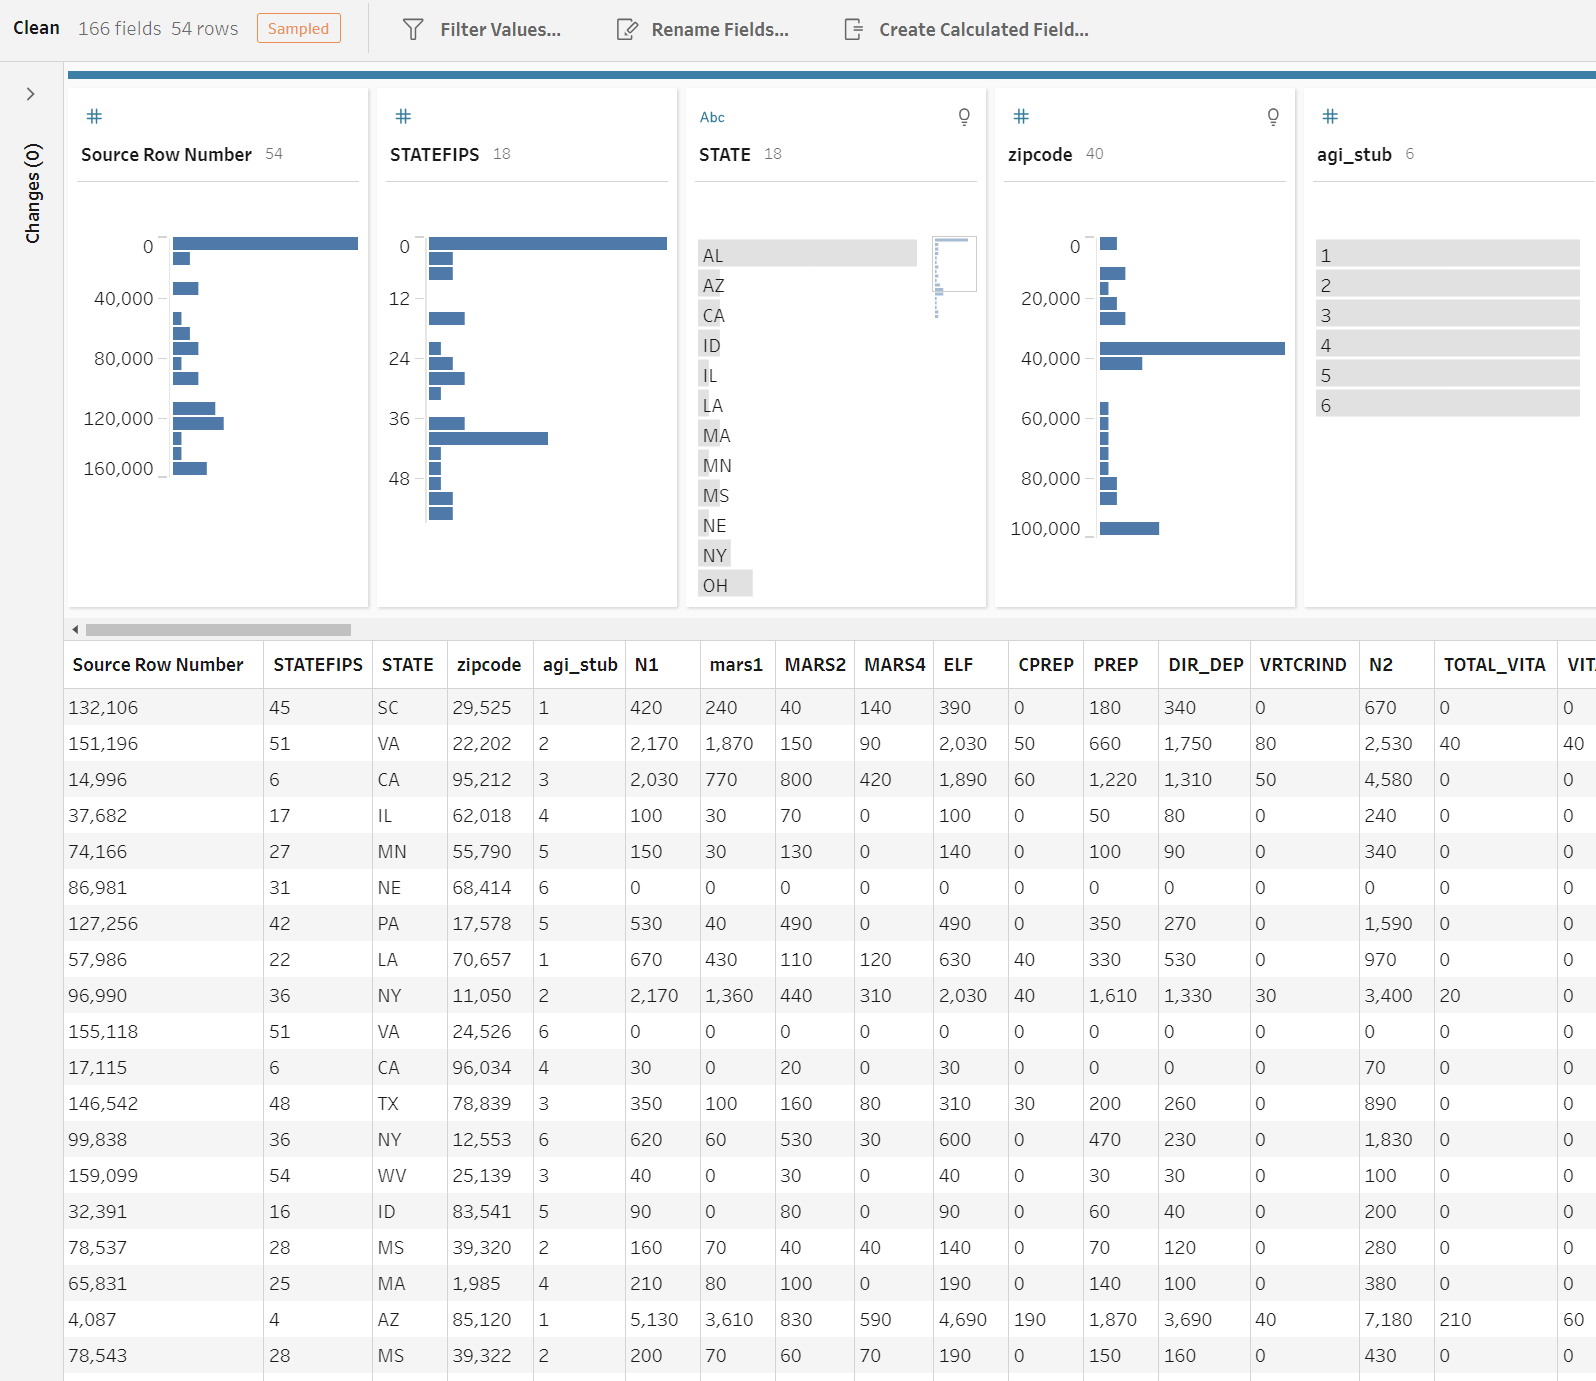
When I navigate back to the Clean Step, I see an uniform distribution of rows per agi_stub, with exactly 9 rows per bin.
While I used Specify Number of Rows in my examples, the Stratified Row Selection works with every Number of Rows option.
Want to learn more?
- Download the 2023.3 version of Tableau Prep today
- Read up about data sampling in Tableau Help
- Explore what else we released in Tableau 2023.3
相关故事

Extend Access to Embedded Tableau Content with On-Demand Access
 2026/07/22

The Tableau+ Bundle with Premium AI, Enterprise Capabilities, and Premier Success
 2026/06/24

What is Tableau Prep?
 2026/04/30