How to accurately translate analytics requests into dashboards, sheets, stories and more


Both analysts and citizen data analysts are faced with requests for information on a regular basis—from our colleagues, our bosses, or our clients. At the beginning of the analytic process, it's rare that requests are made or organized in a way that makes them easy to fulfill. It is our job to systematically break down these requests and organize them in a way that allows us to take action—to create analyses that accurately address the initial request with the least amount of back-and-forth possible.
Think of it like a grocery list. My family puts items we need on our list as we run out, which means they don’t always appear in the most logical order. Because I tend to be the shopper in my family, I like to organize the list so I’m not walking in circles around the store and missing half of the items. The best result happens when I also take the time to clarify the list first, making sure I am on the same page as the person that wrote the item on the list. That way, I can shop efficiently and show up with the items my family was hoping to get. The same principles apply to data analysis.
To create something that fulfills the original purpose of the data request, we need to do a few things up front:
- Take the time to understand the request.
- Organize the information in a way that makes sense and find the data.
- Select the type of analysis based on the question.
- Decide on the format of the final output. Is it a single graph, or a dashboard, or is it a narrative that solves a problem?
We’ll look at some scenarios and some sample questions to help accelerate this process. While this blog post isn’t designed to cover every scenario you may encounter, it will provide tactical steps to help you quickly and easily translate inquiries into action and answers. Let’s get started.
1. Take time to understand the data or analytic request
When we are talking about any type of request—including data analysis—it can be easy to assume we know what someone wants, instead of taking the time to deeply understand why someone is asking for it in the first place.
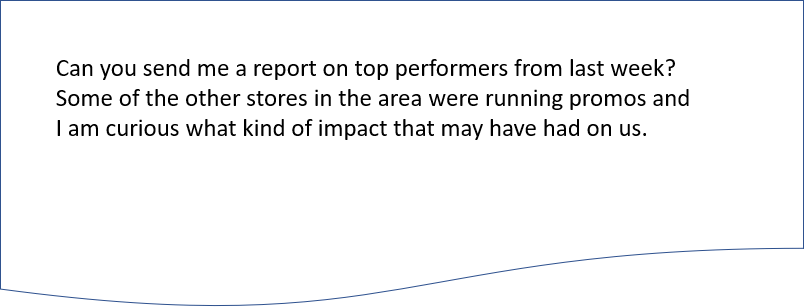
Analytics requests can come in the form of a verbal ask or through a written format like email. Our brains have a tendency to jump to solutions long before the other person stops talking or we finish reading. Unfortunately, that means we don’t always hear and understand everything that is being asked of us and our work misses the mark as a result.
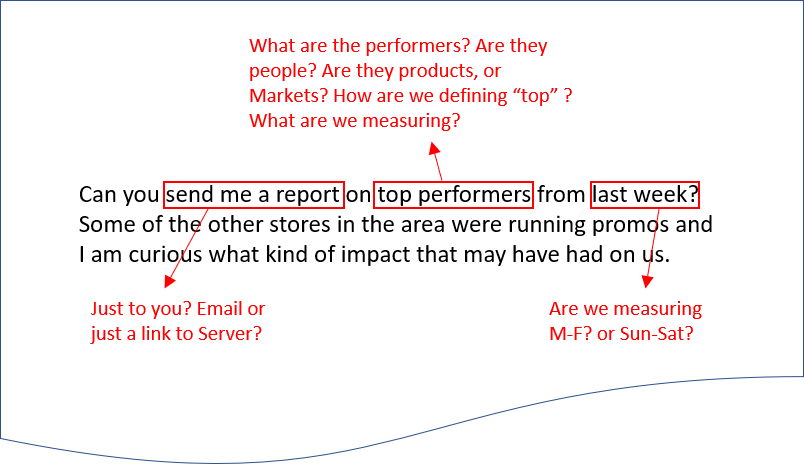
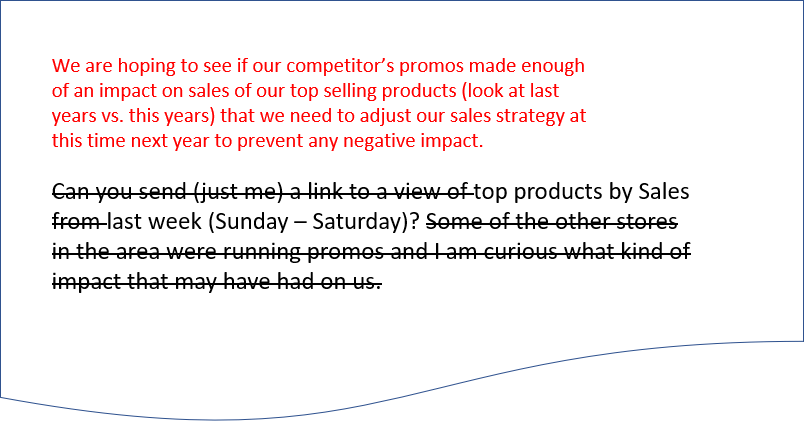
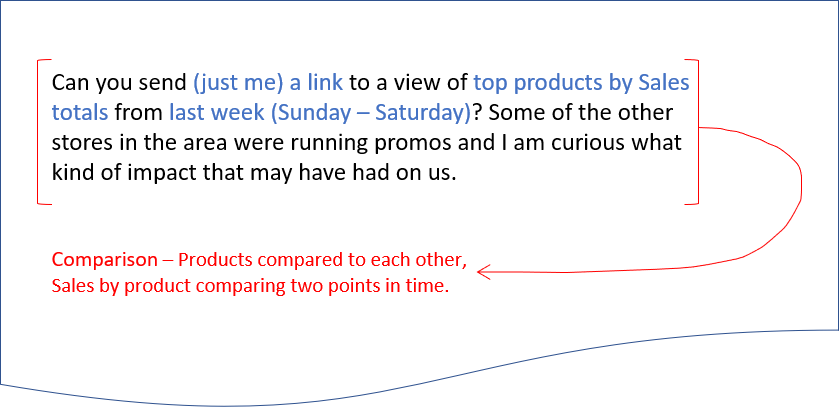
Write it down or type it out. At this stage, understanding the request is critical because you are going to build on this with every step hereafter. Writing down the request (on paper, in an email, or in your notes) allows you to see the information and identify areas that may need clarification.
Write out the question:
Identify the areas that need clarification:
If possible, repeat the request or question back to the person asking to make sure you have the same understanding. Often, we translate information as we take it in, and our interpretation varies from the original request.
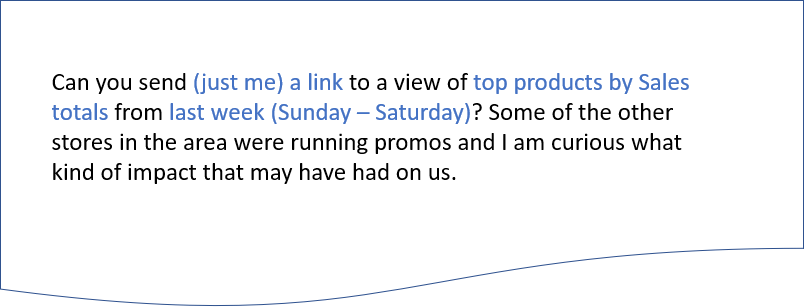
Rewrite the clarified request:
Be certain you understand the desired outcome of the request.
- Are they looking for numbers? “What was our patient satisfaction score for last quarter?”
- A summary? “Can you look to see if there is something specific that caused so many e-bike sales this year?”
- A tool to explore data with? “We’re not sure why yet, but we keep coming up short on our paper inventory counts compared to projected usage. Can you put something together so we can check it out?”
Knowing this will guide what you create and ultimately determine whether you hit, or miss the mark.
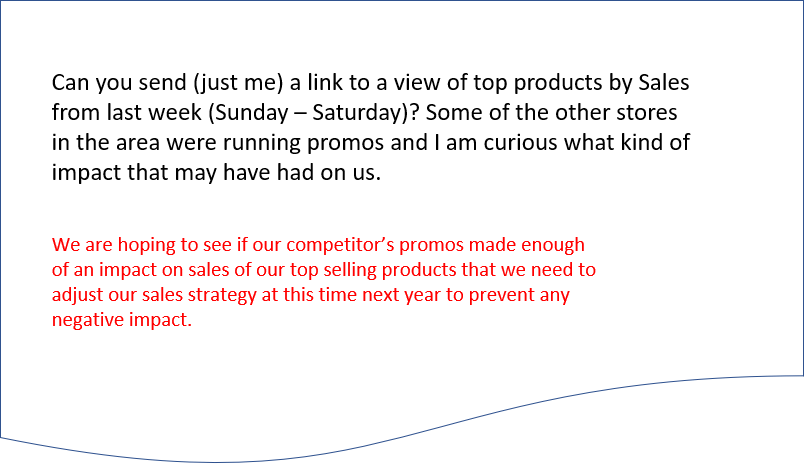
Identify your desired outcome:
Questions and requests are often complicated with unnecessary information. Take a moment to identify what information is necessary and what can be ignored to fulfill the request with the desired outcome.
Identify parts of the question, or comment on what isn’t necessary to answer the question:
2. Next, organize the information and find the data
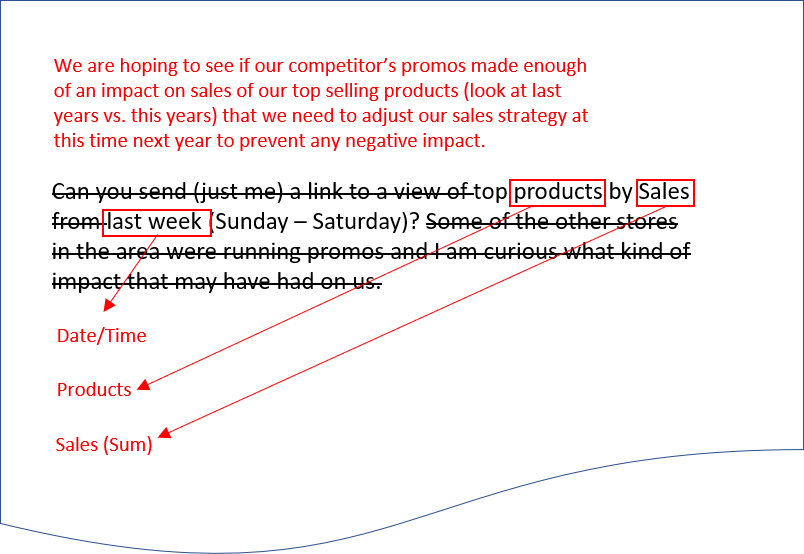
All of the information you just gathered above is data you’ll use to address the question or request. All of the pieces you need should be there, you just need to see each piece for what it is. Is it a field? Is it an action you need to take, or a type of chart you need to choose?
Start by combing through the written question to identify fields: Search for categories, metrics, and filters, then organize your fields by type (categories, metrics, or filters) and document them in a list. It could be written, typed, or even stored mentally.
Identify and organize the fields that are referenced in the request:
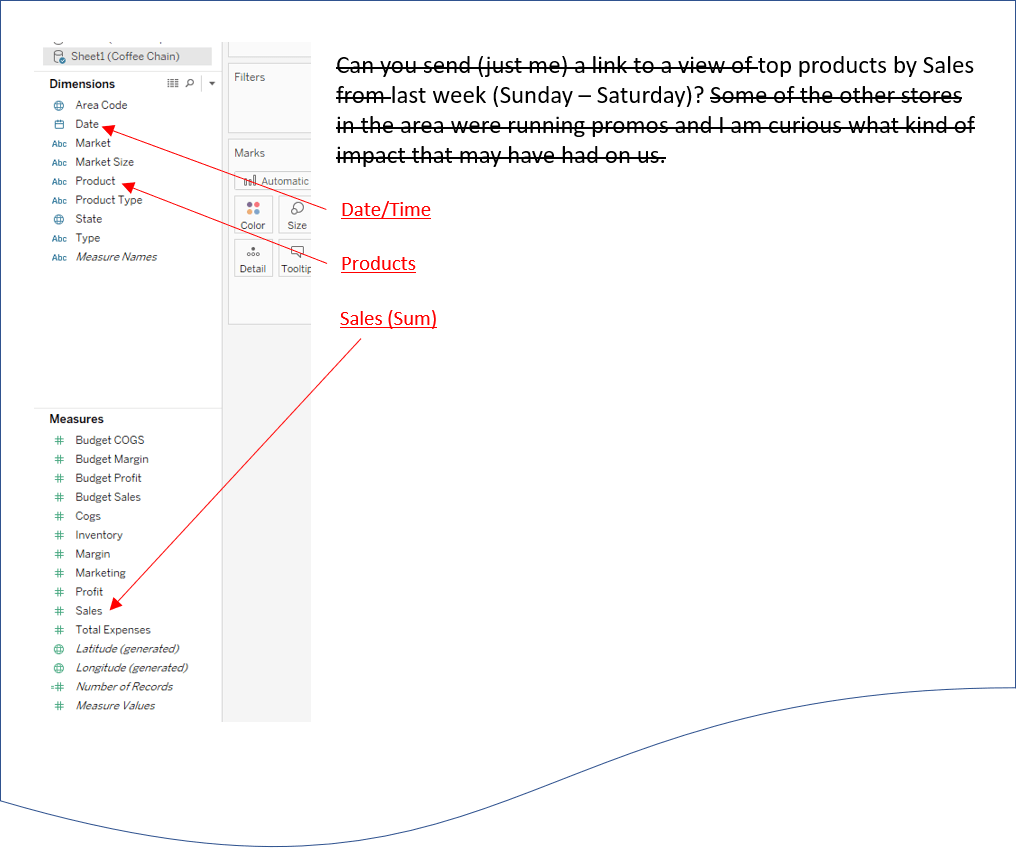
Now, locate the data and ensure that you have the fields you identified to build out the solution. Data access is often one of the biggest hurdles and may require you to work cross-departmentally to get what you need. Your earlier efforts toward gathering rich background information will allow you to accurately explain what you are trying to accomplish to your data team so they can guide you to the correct information. This may require that you combine multiple datasets to achieve the desired goal.
Once you have the data you need, double-check the members of each field that you think will be a match to the original request. It is not uncommon to have field names that mean something different to the creator than they do to the eventual consumer. Verify with a quick alias check or drag and drop the field in Tableau to save yourself time in the long run.
Make sure you have the fields you need and ensure that the data is what you expect:
3. Select your type of analysis
Now that you understand the request, translated the question into actionable items, connected to the correct data, and double-checked the accuracy of your fields, it’s time to make some decisions about your analysis based on what we know to get the best possible outcome.
A common tendency when analyzing data is to start building visualizations in hopes that inspiration will hit us during our random assembly of fields. To put this into perspective, this would be like trying to build a piece of furniture before you even know its purpose. Before we start to build anything we need to identify the type of analysis our question or request is calling for. Without that information, we are relying wholly on luck to guide us.
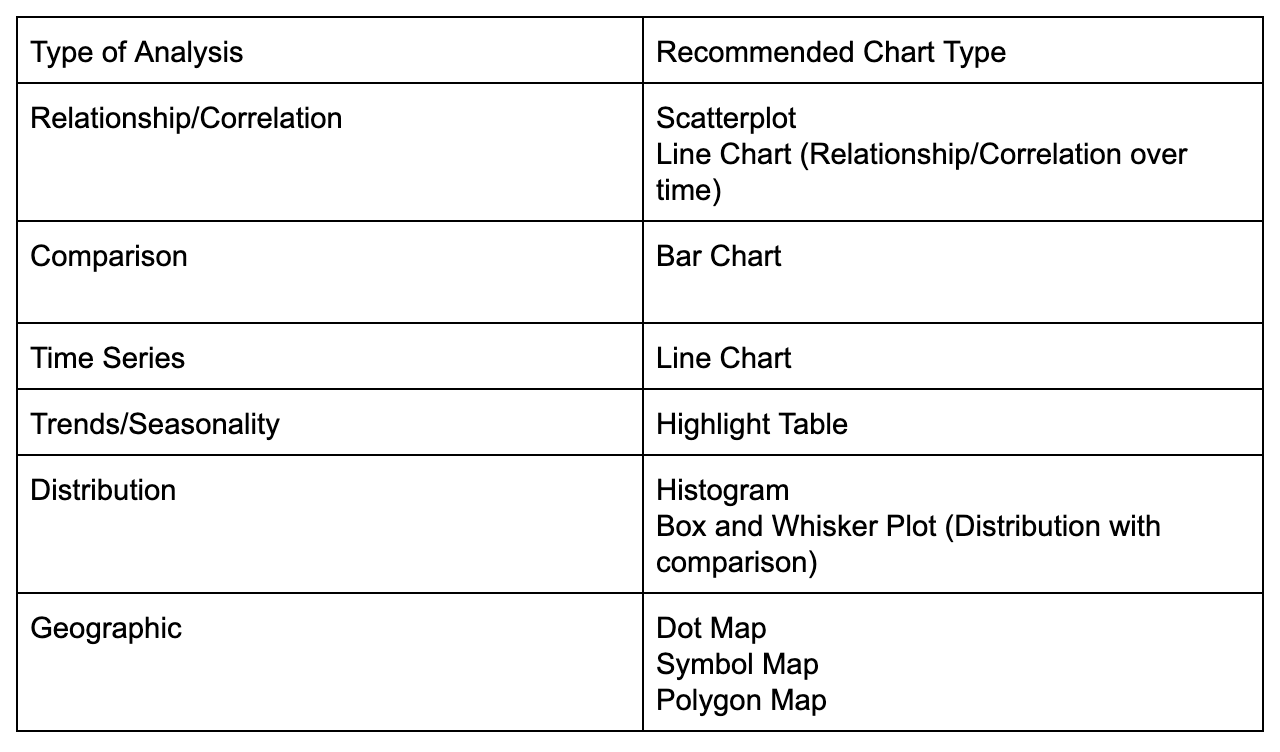
Selecting the type of analysis based on a question
Use this table to help guide you toward the right type of analysis:
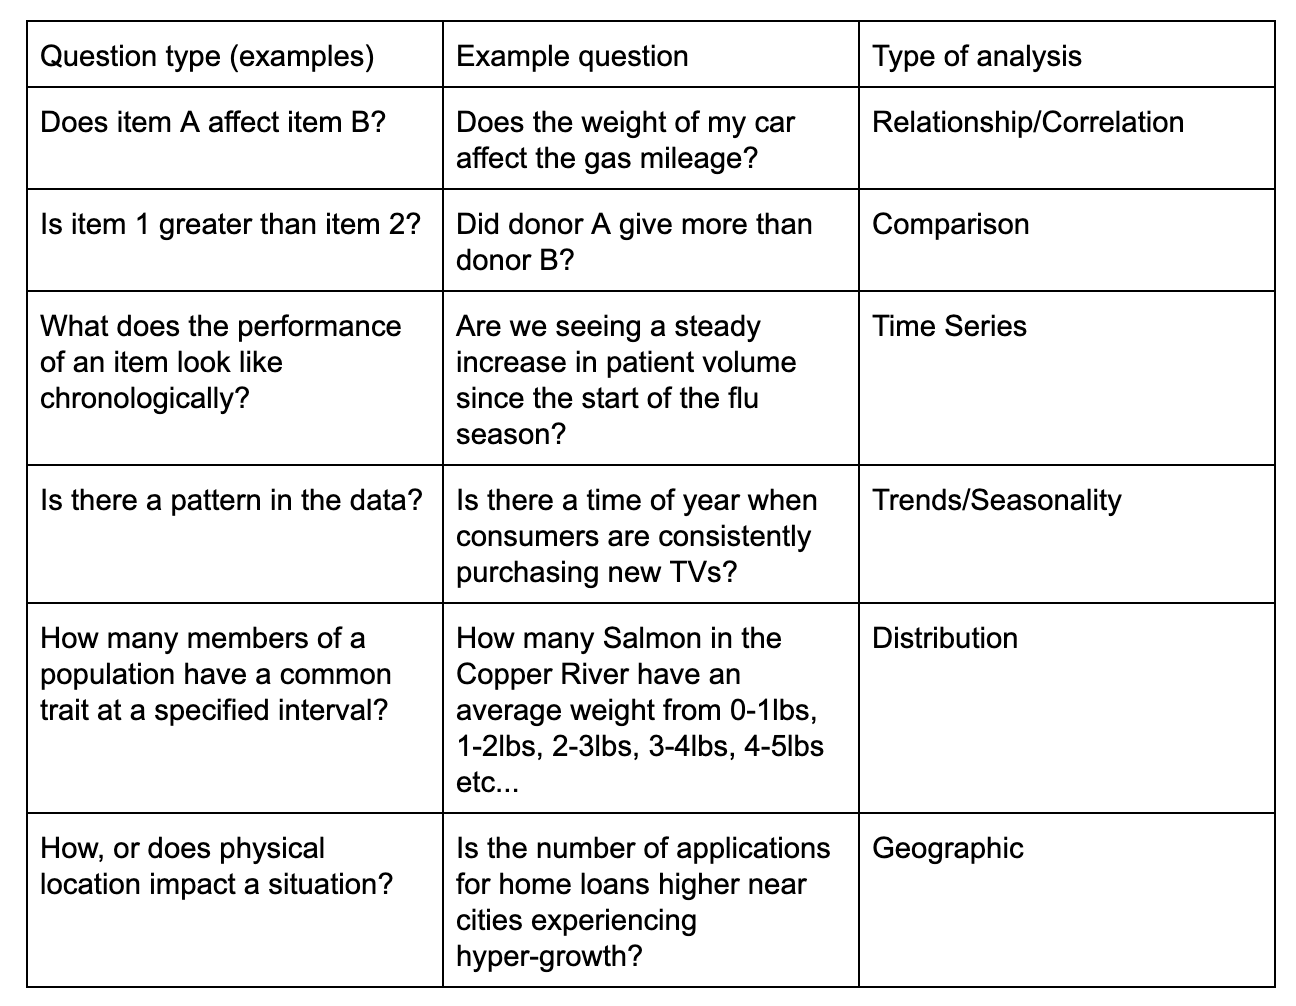
What type of analysis is the request calling for?:
4. Choose your chart type and presentation mode
Choosing the right chart type for each question can be one of the toughest parts of this journey and is often where people get stuck. Luckily most chart types have an intended use, and once you know this, the choices are much easier to make.
Here is a quick reference table to speed up your decision-making process:
What type of chart will work best for this type of analysis?
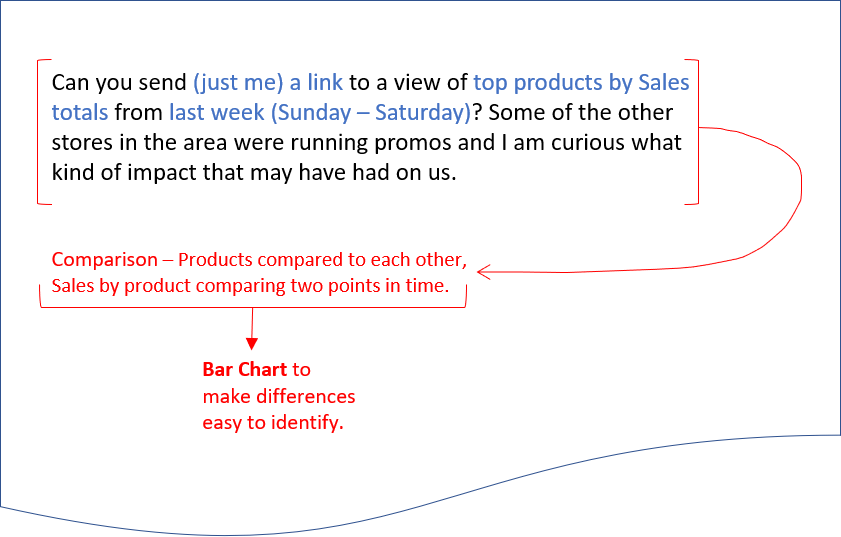
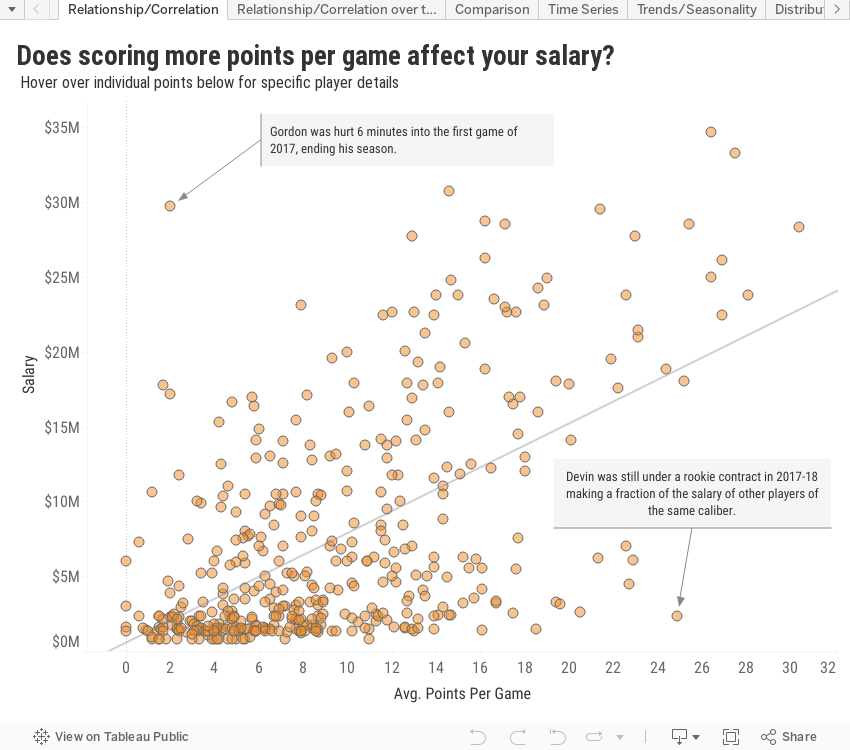
Chart examples:
A sheet, a dashboard, or a story: Selecting your presentation method
Once we have identified the best course of action using the tables above, we need to decide, is the request for specific answers, a tool for data exploration, or a narrative to illustrate a point to decide what type of view we should build?
Use the table below to help decide on the best fit for your situation:
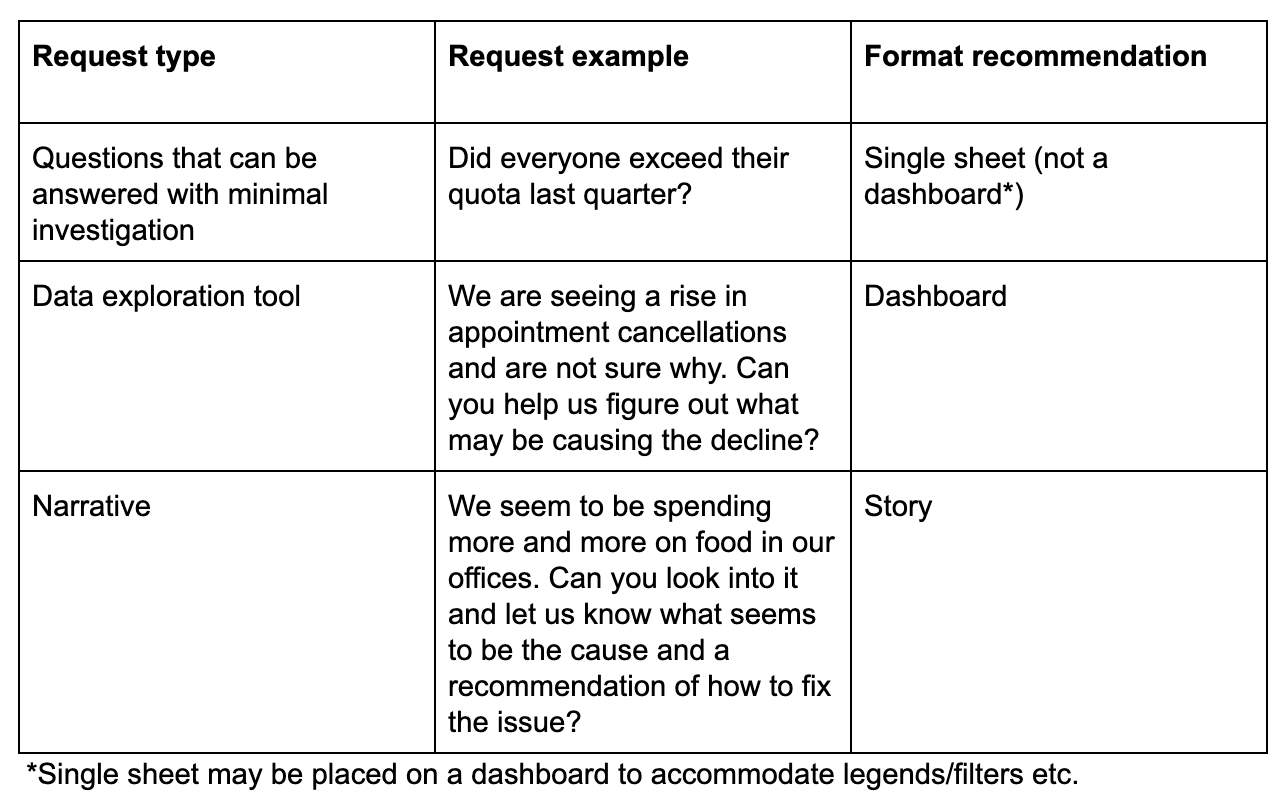
Here are some examples:

As is the case with all guidelines, there will be some exceptions, however, gaining clarity at the onset of the request will allow you to move confidently through the analytic process and hit the target on your first attempt.
相关故事
Learn the Basics of Well-Structured Data
 2024/12/06
How To Spot Misleading Charts: Review the Message
 2024/10/24
How To Spot Misleading Charts: Check the Axes
2024/10/17