Enrich data in Tableau with machine learning using Algorithmia


Tableau combines the ease of drag-and-drop visual analytics with the flexibility to dynamically integrate data from analytical systems. Algorithmia lets analysts go even further, extending worksheets with machine learning (ML) and allowing for the execution of Java, Node.js, Python, R, Ruby, Rust, and Scala code directly from within Tableau.
Take advantage of Algorithmia’s broad catalog of prebuilt algorithms or upload your own ML model or utility code into Algorithmia’s public or enterprise private cloud offerings, then integrate them right into your Tableau worksheets.
In this blog, we’ll explore a concrete example to show you how to leverage Algorithmia algorithms in your Tableau workflow.
How to leverage Algorithmia algorithms in Tableau
Let’s dive in with an example. The United States Geological Survey (USGS) provides an excellent database of global earthquake data. With Tableau, we can quickly display the location, time, and magnitude of these events on a map. But earthquakes that occur at night may carry a higher risk of injuries/fatalities, since escaping or taking shelter within a collapsing building when visibility is low is harder.
Time of day can act as a rough proxy for visibility, but a much better measure is the angle of the sun, which is affected by geolocation, date, and time of day. As an extreme example, the North Pole is sunless at high noon on December 21.
To determine visibility during an earthquake, we will enrich our worksheet using the SunMoonCalculator algorithm hosted on Algorithmia.com. This algorithm makes use of a package called SunCalc, written in Node.js, which allows us to easily connect to our worksheet using TabPy and Algorithmia.
PART 1: Using data From USGS, create a map in Tableau
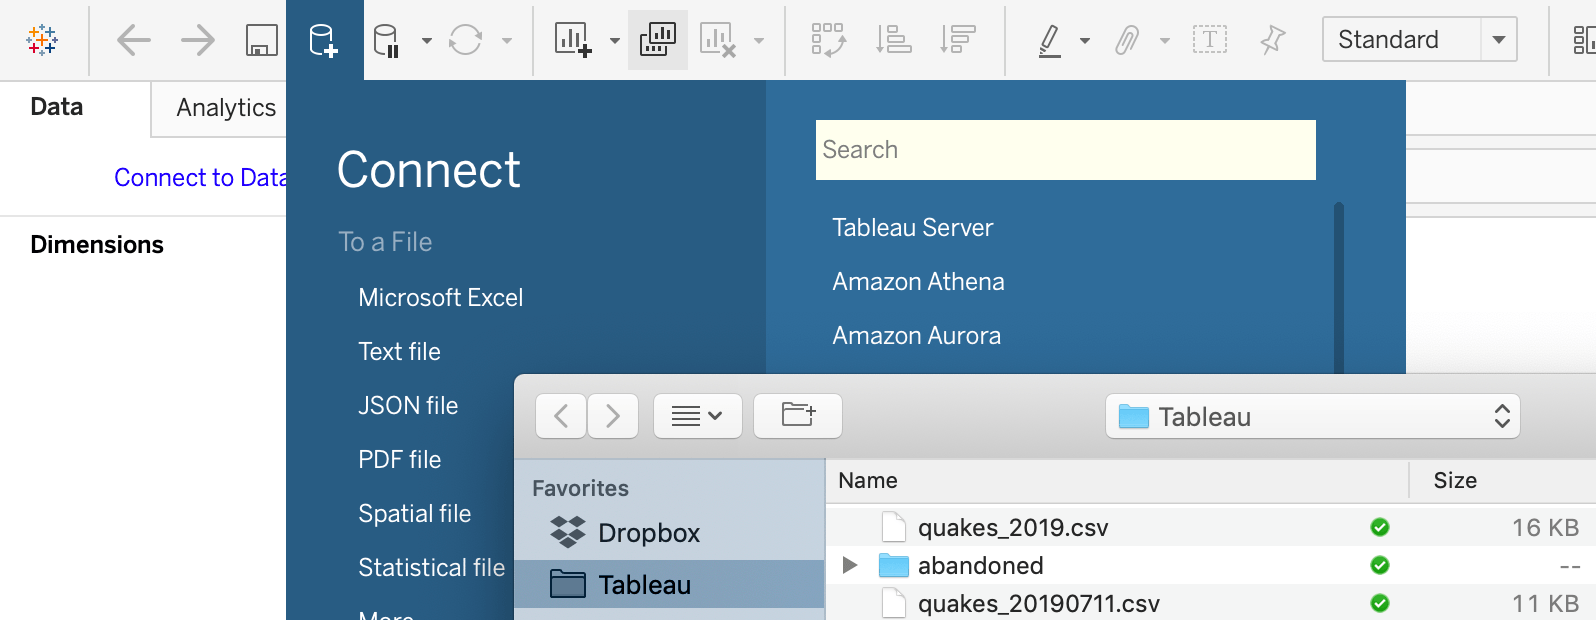
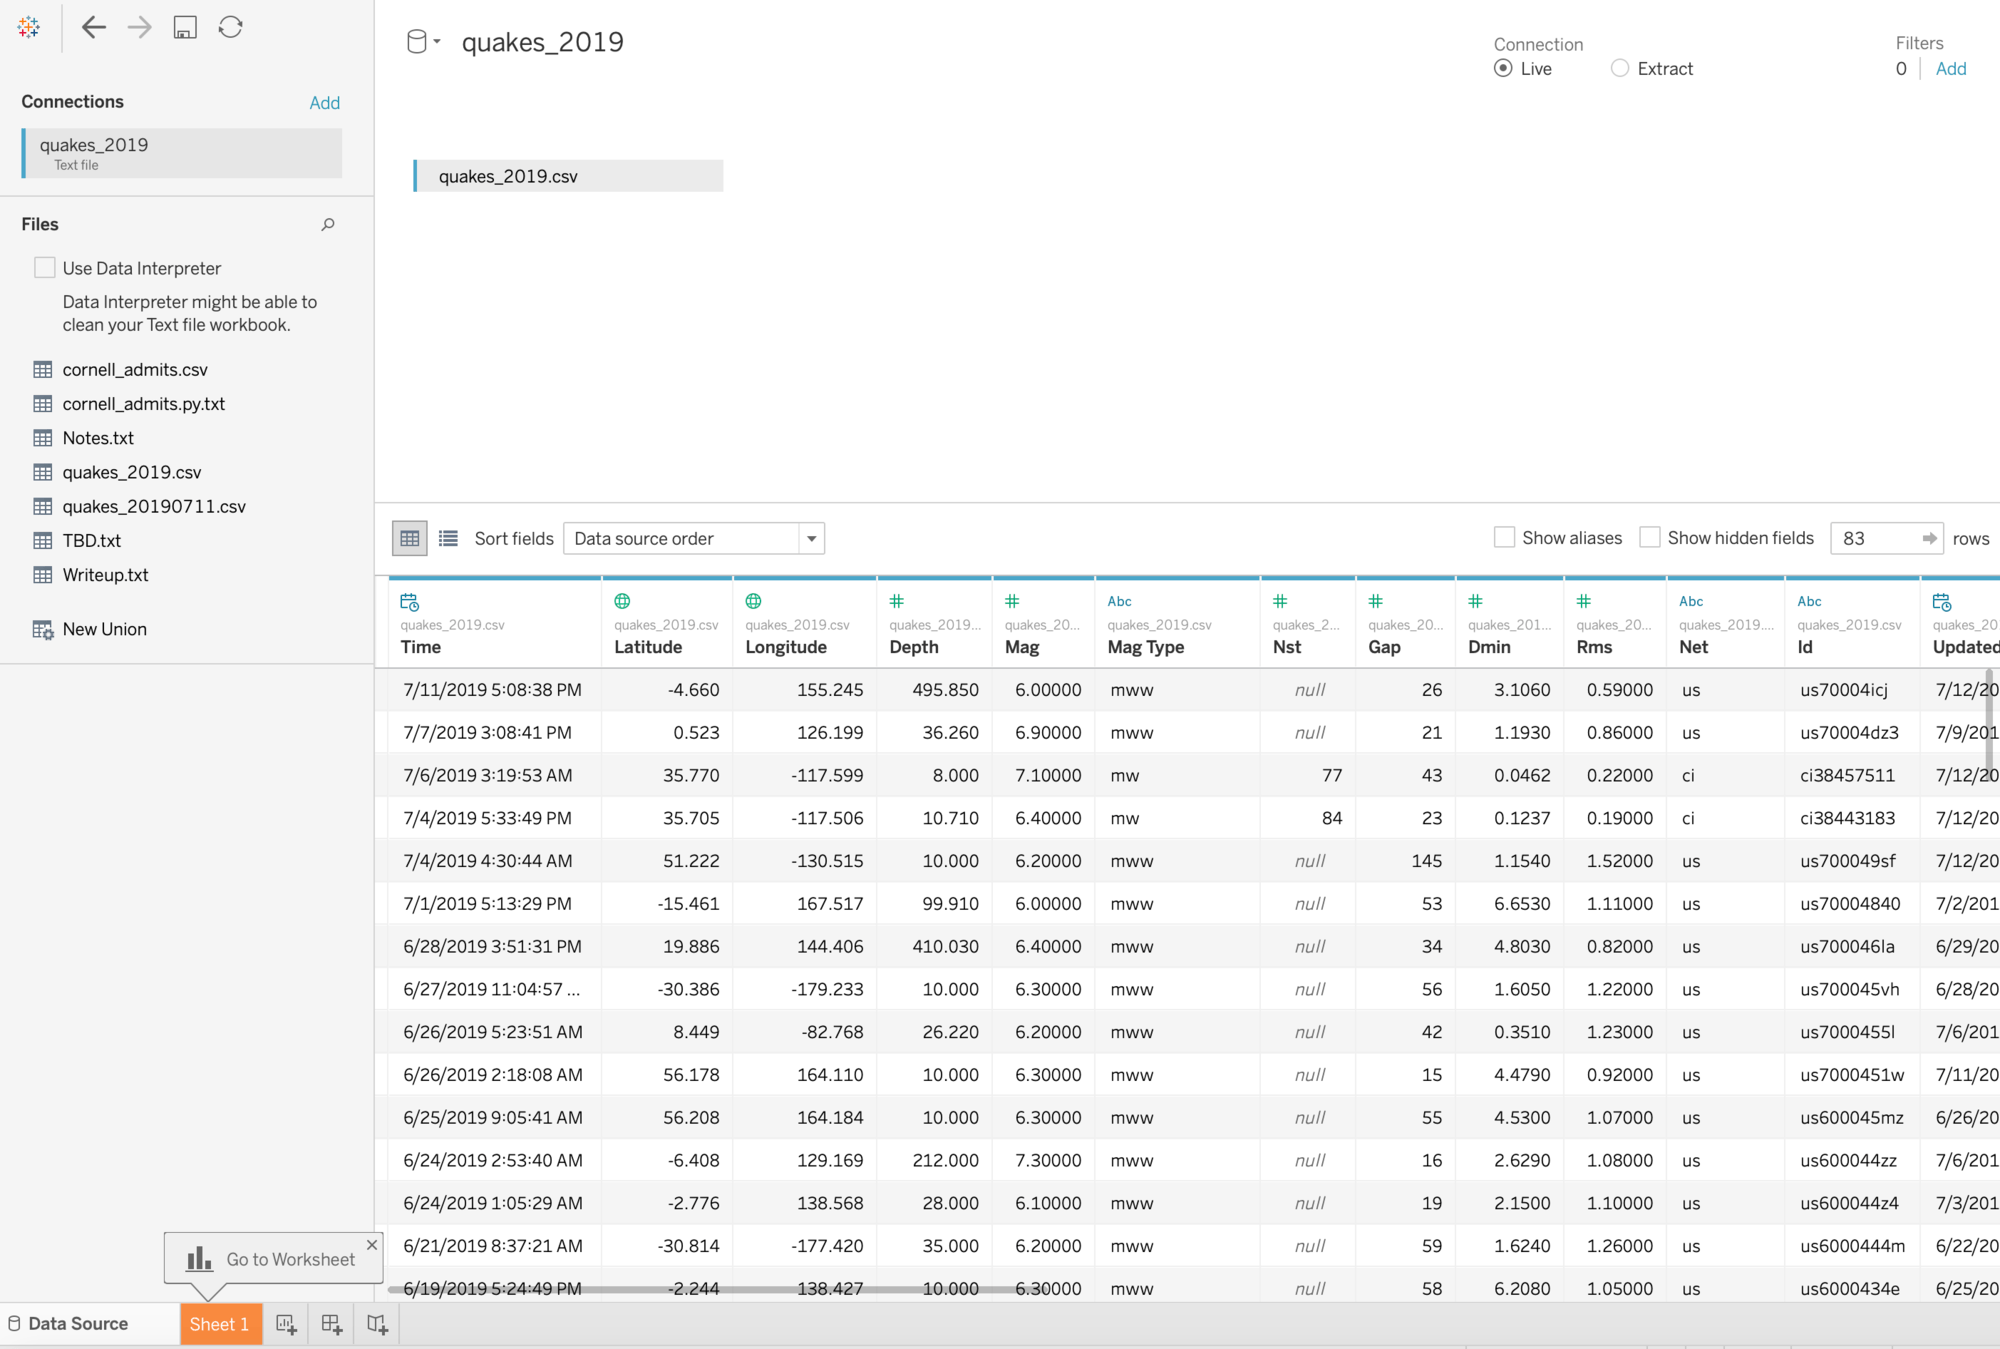
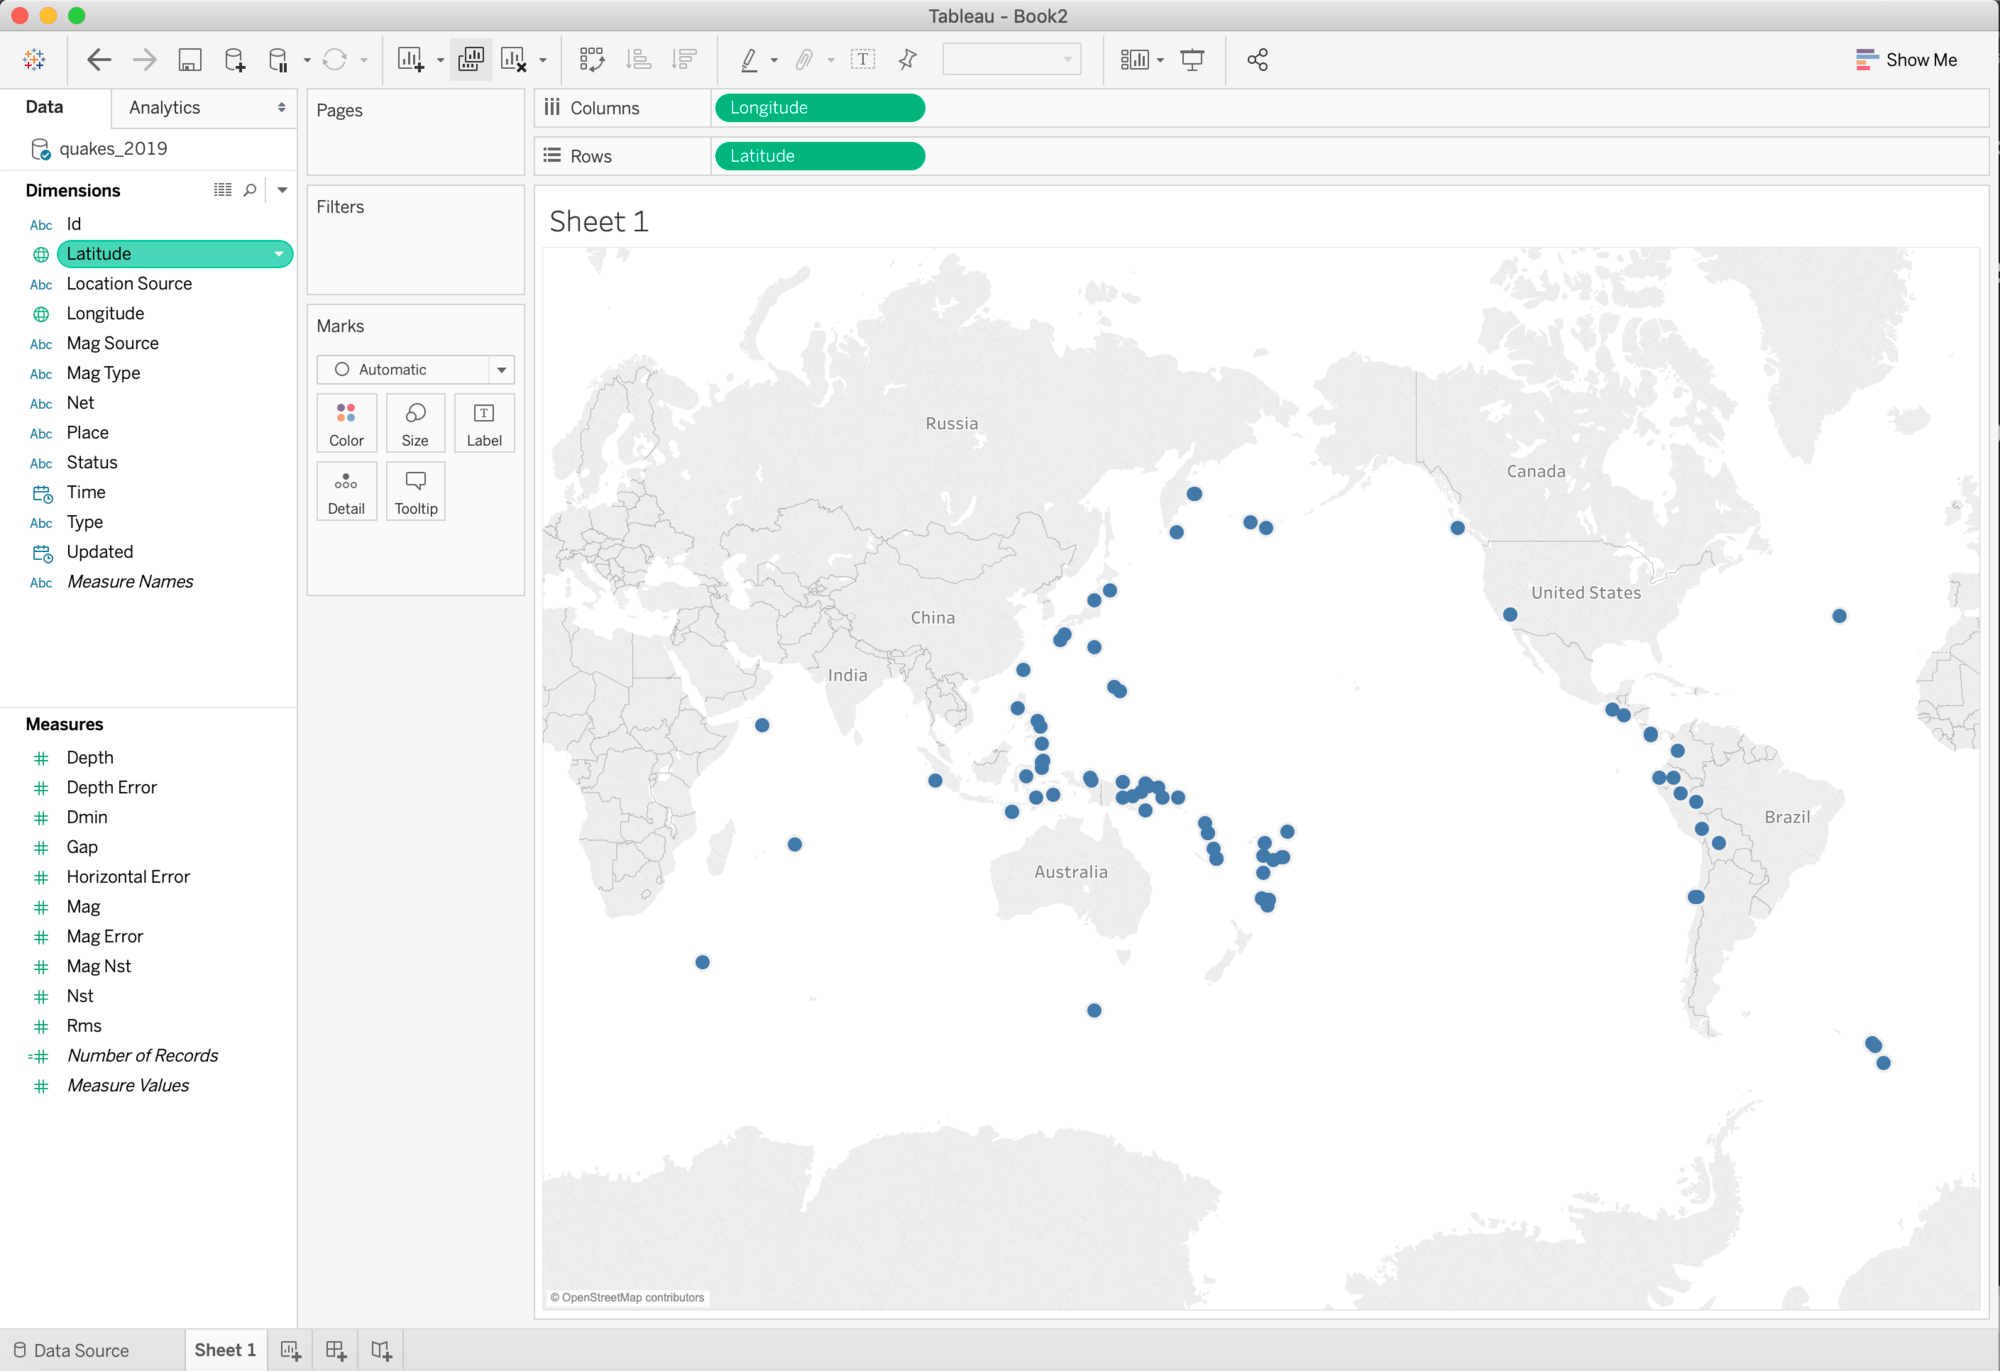
- Download the data: The USGS maintains an excellent Earthquake Catalog API that we can use to retrieve earthquake event data, including the geolocation, date/time, and magnitude of each event. This data is available in a variety of formats, including GeoJSON, but for now we’ll use a simple CVS export. Let’s start by downloading a small initial dataset: all magnitude 6+ quakes in 2019.
- Open Tableau and create a new worksheet: Select the menu item Data → New Data Source, and click “Text File.” Select the file you just downloaded and take a minute to explore the raw data. When you’re ready, click the "Sheet 1" tab in the bottom left to continue building the worksheet.
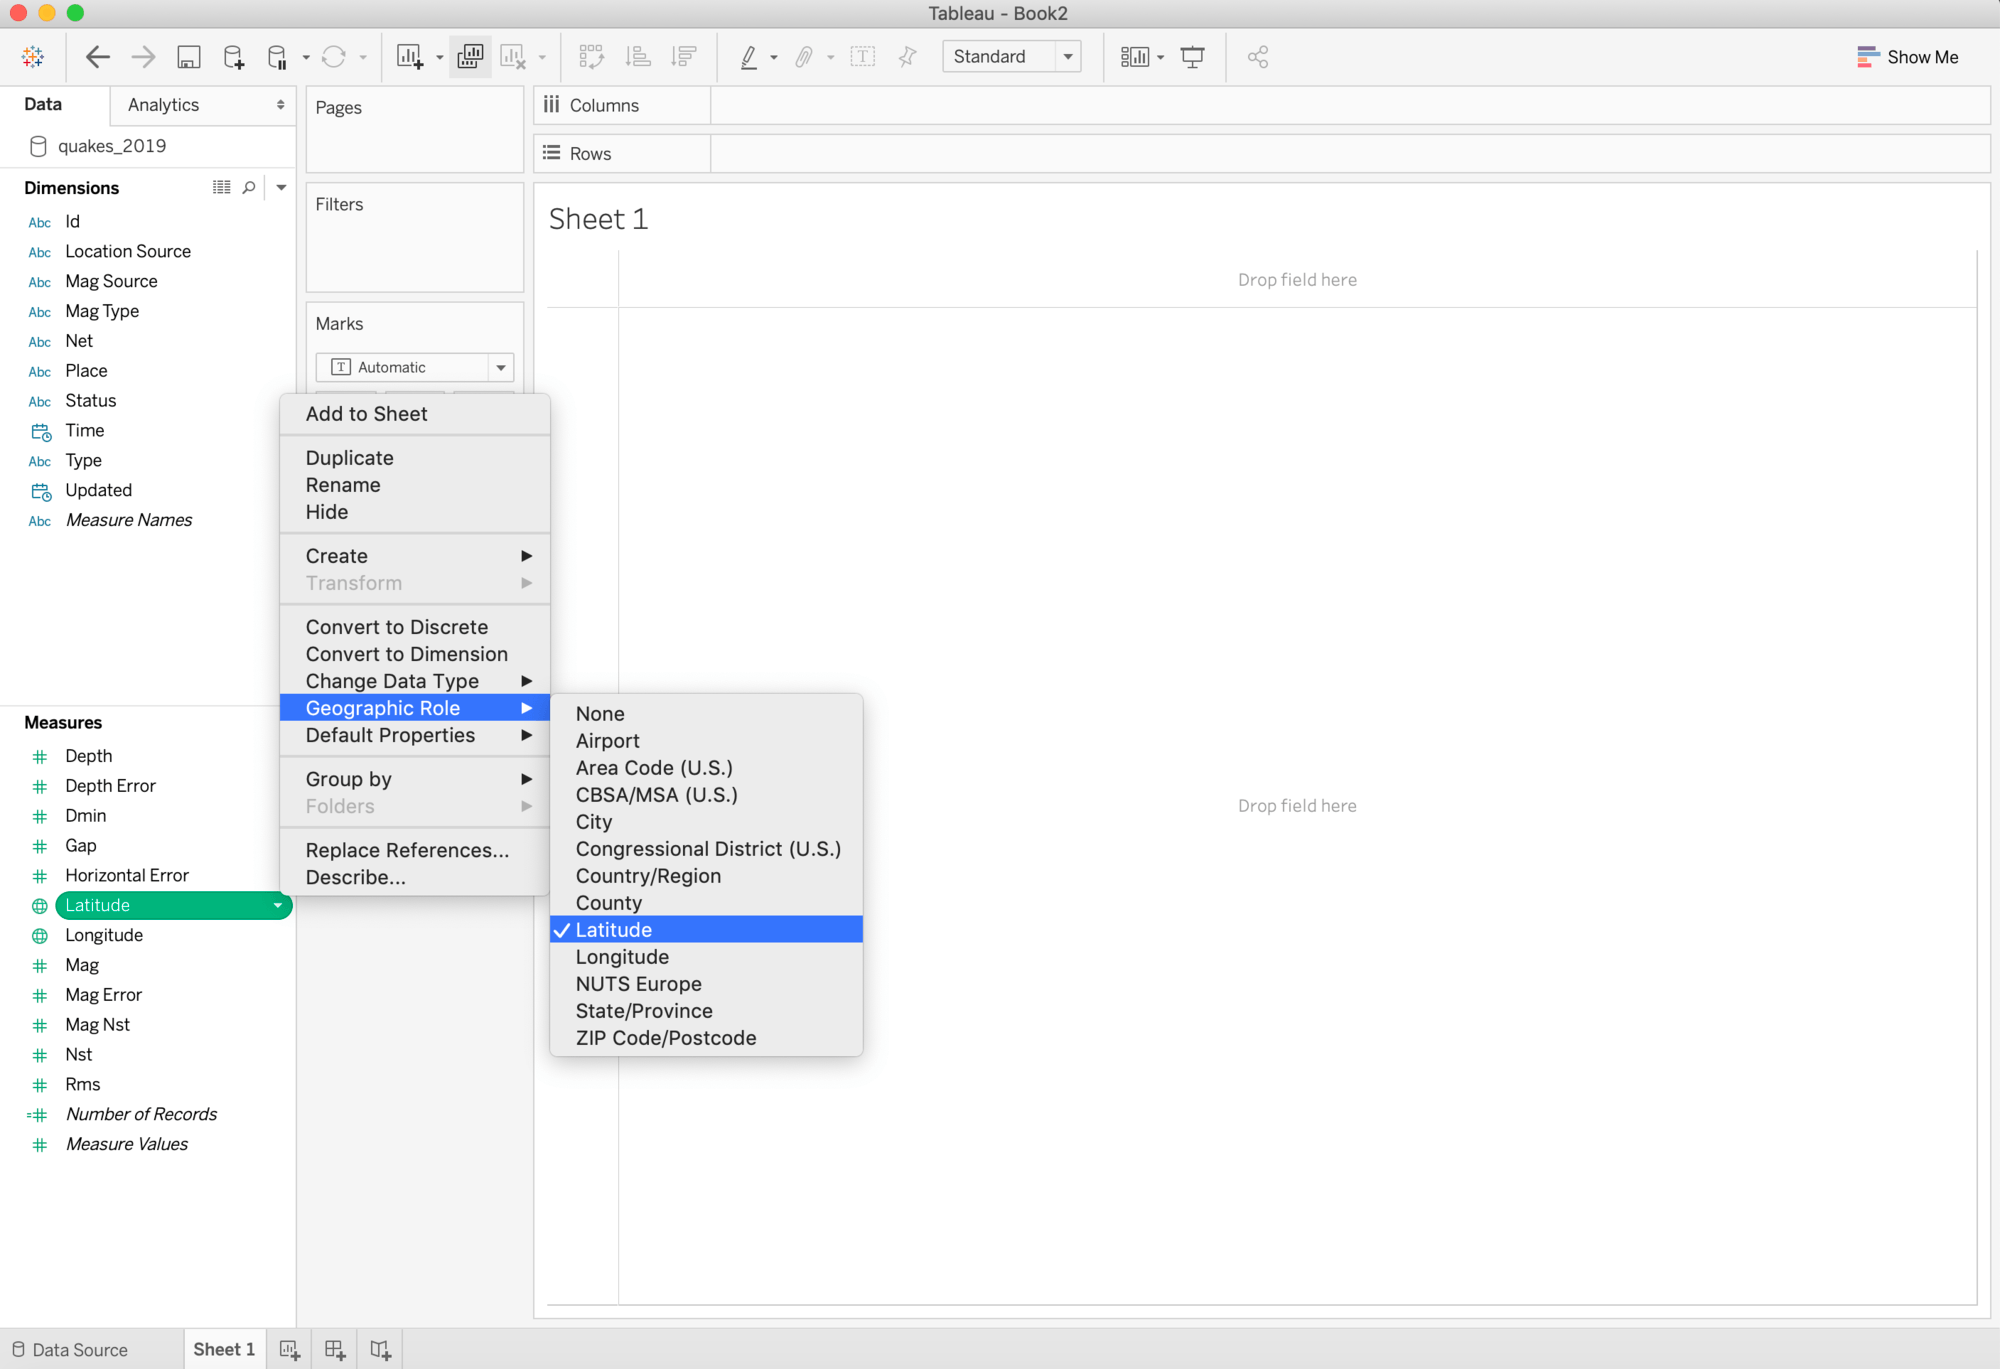
- Assign Geographic Roles: Under “Measures” on the left, you should now see the fields “Longitude” and “Latitude.” Tableau automatically assigns these fields Geographic Roles. You can confirm this by clicking on the pill and picking “Geographic Role” to see how it was assigned.
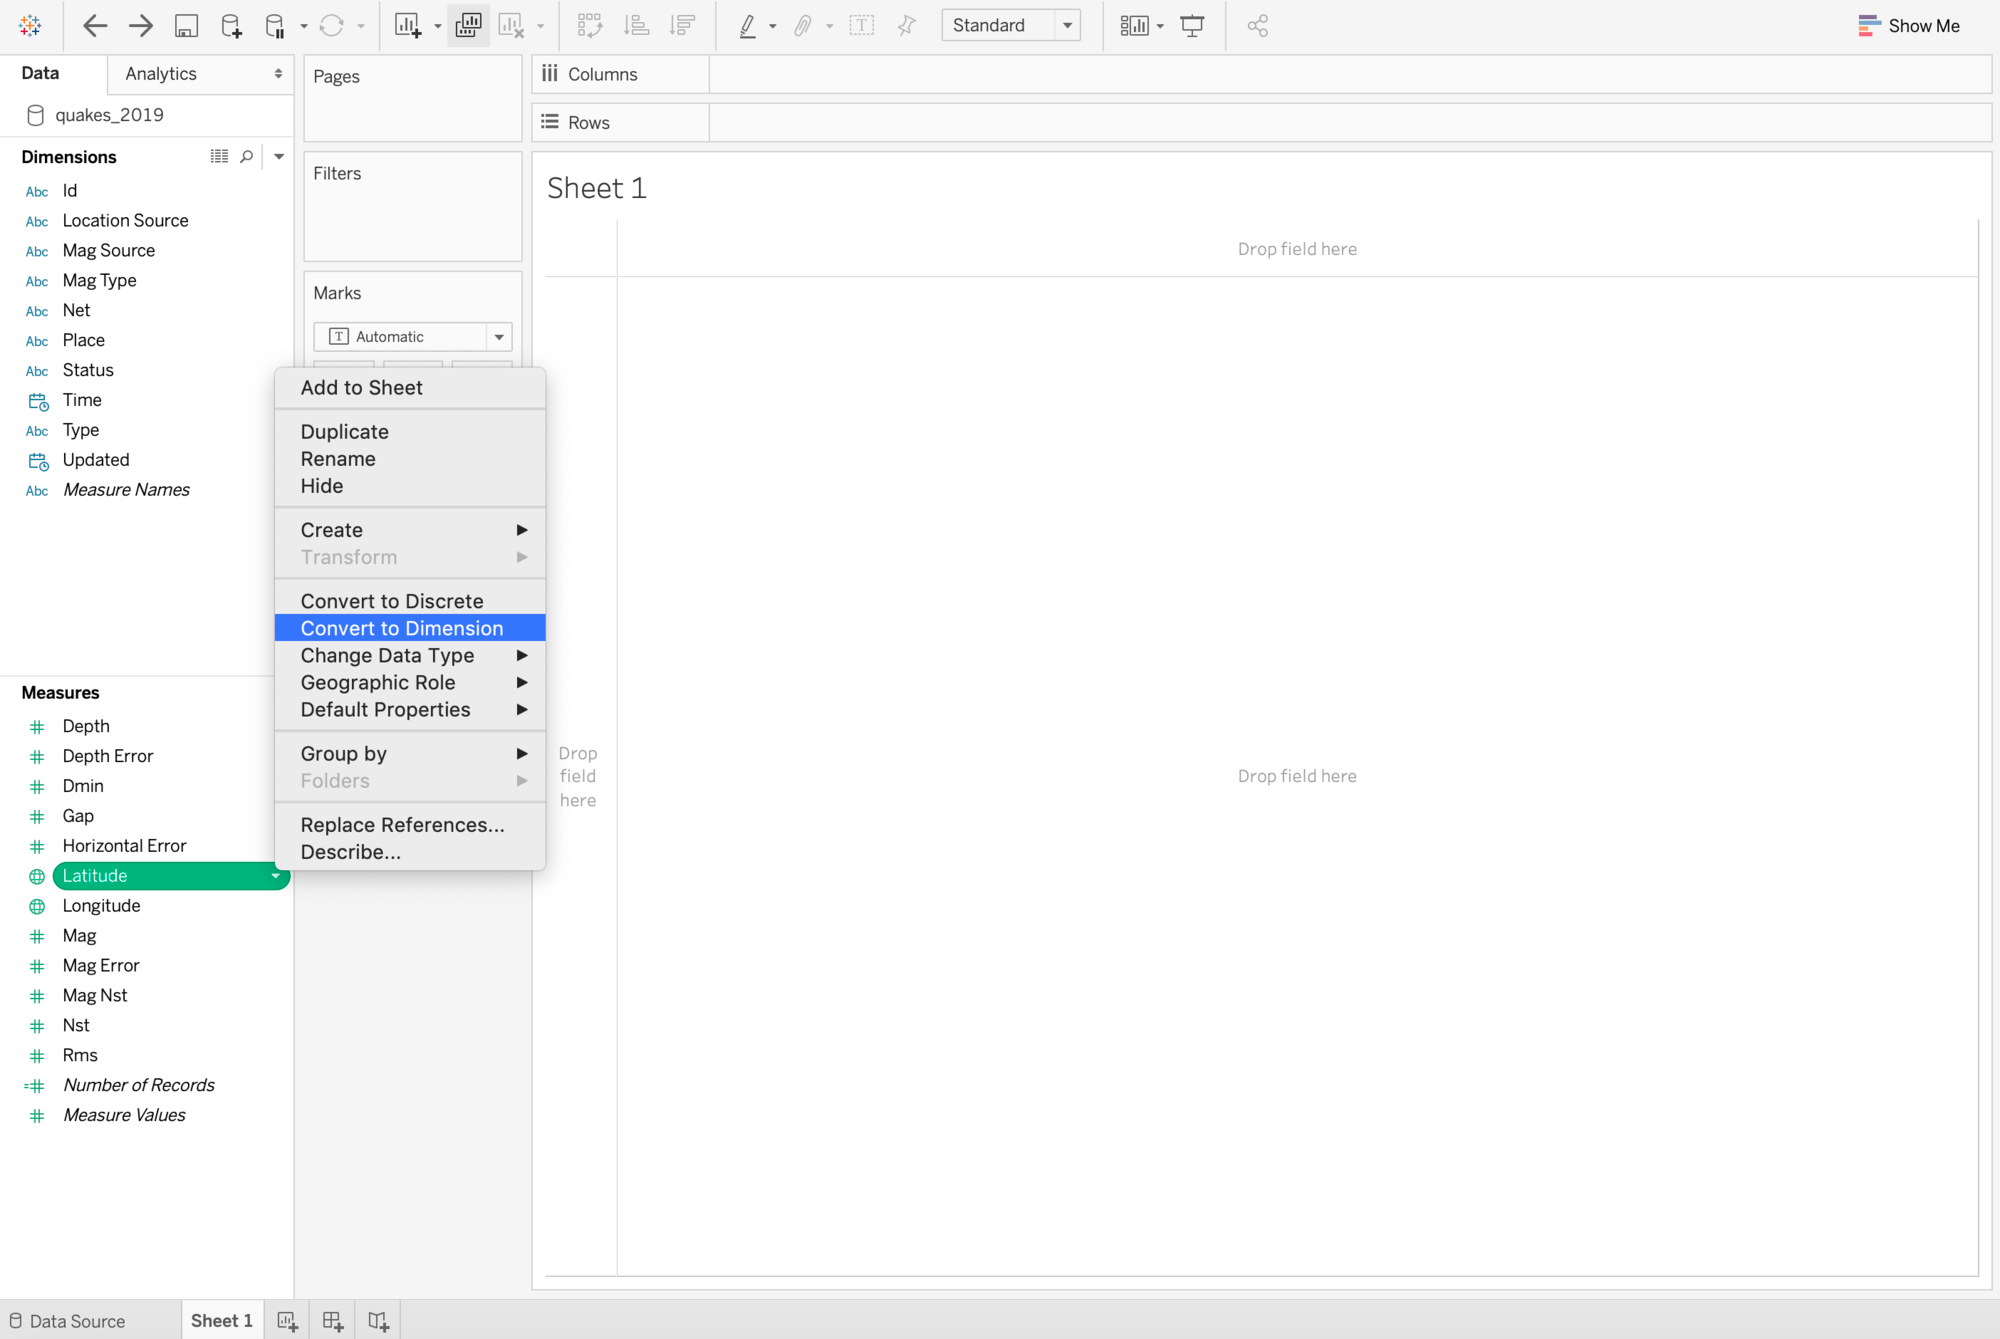
- Click the drop-down menu next to “Longitude,” but this time, select “Convert to Dimension.” Repeat this for Latitude.
- Create a map: Double-click Longitude, then Latitude. Tableau will add these fields to Columns and Rows and automatically render the points on a geographic map.
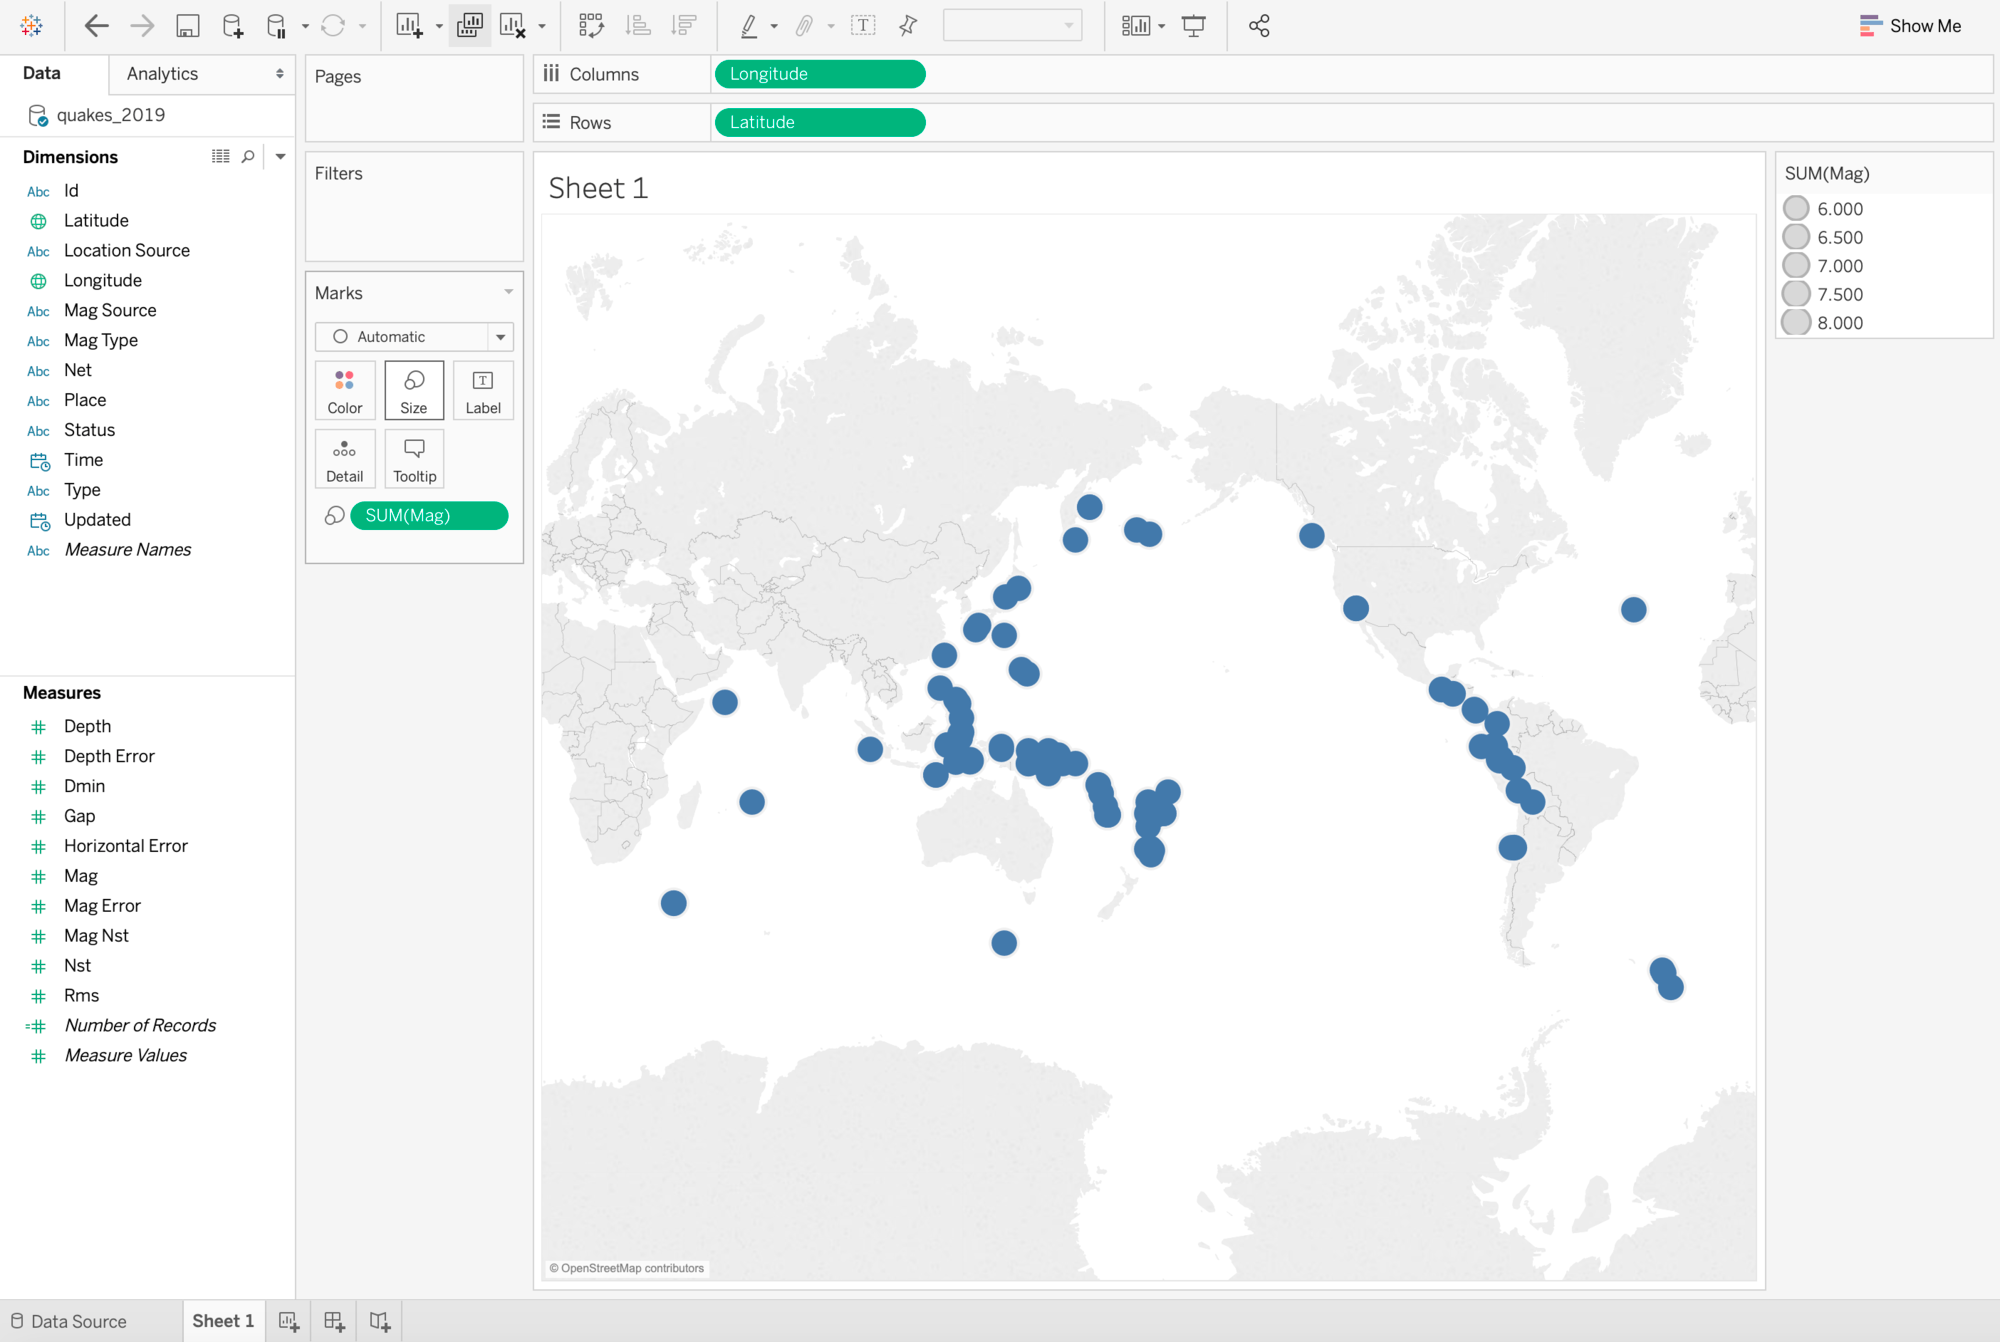
- Show size of quakes: To get a feel for the size of these quakes, drag the “Mag” measure onto the “Size” box under “Marks”, This should cause each point to size itself according to the magnitude of the earthquake, though the size differences won’t be particularly extreme since these are all magnitude 6-9 events.
PART 2: Locally install and connect to TabPy, Tableau’s Python Server
Tableau supports a set of functions that you can use to pass expressions to external services. One of these external services, Tableau Python Server (TabPy), makes it possible to use Python scripts in Tableau calculated fields. This can be run as a local server or installed centrally for your organization. For this example, we’ll use the local server.
- Download and install TabPy according to the instructions found at: https://github.com/tableau/TabPy/blob/master/README.md
- Ensure that the Algorithmia library is available in the Python environment under which TabPy will be running (‘pip install algorithmia’ in the relevant Python env or venv).
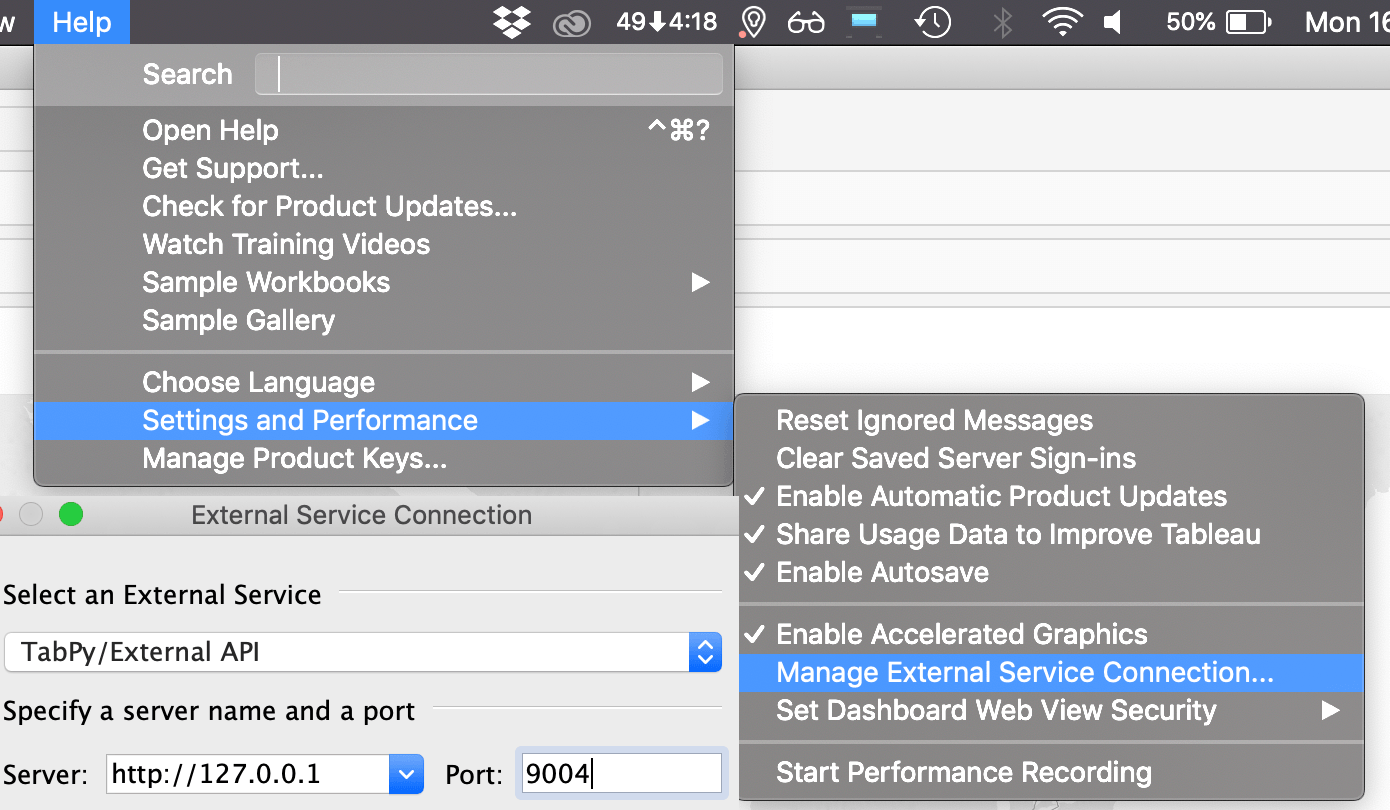
- Start the TabPy server and make note of the port on which it is listening (e.g. the console will read “Web service listening on port 9004”).
- Return to Tableau and connect it to the TabPy server: from the menu, pick Help → Settings and Performance → Manage External Service Connections. Choose “TabPy/External API” and make sure the port matches the one shown in the prior step. Test the connection and click OK.
PART 3: Use Algorithmia to enrich the view
Now that we have a way to execute Python code from Tableau, we can use Algorithmia’s Python Client to connect to run jhurliman/SunMoonCalculator on our data.
- If you do not already have a free Algorithmia account, head to https://algorithmia.com/signup and use promo code “tabpy.” This will put an initial $50 into your account, on top of the 5,000 free credits all users receive every month.
- On algorithmia.com, click on your avatar, then “Manage API Keys.” Copy your default API key beginning with “sim…”
- Back in Tableau, click on Analysis → Create Calculated Field: name it "Sun Altitude."
- Paste in the following code, replacing ALGORITHMIA_API_KEY with the key from step (2):
- Click OK to save the script, then mouseover the “Sun Altitude” measure on the left and click the drop-down arrow. Pick “Convert to Continuous.” This lets Tableau know the resulting angles represent a range of numbers, so it will colorize them on a continuous range in the next step.
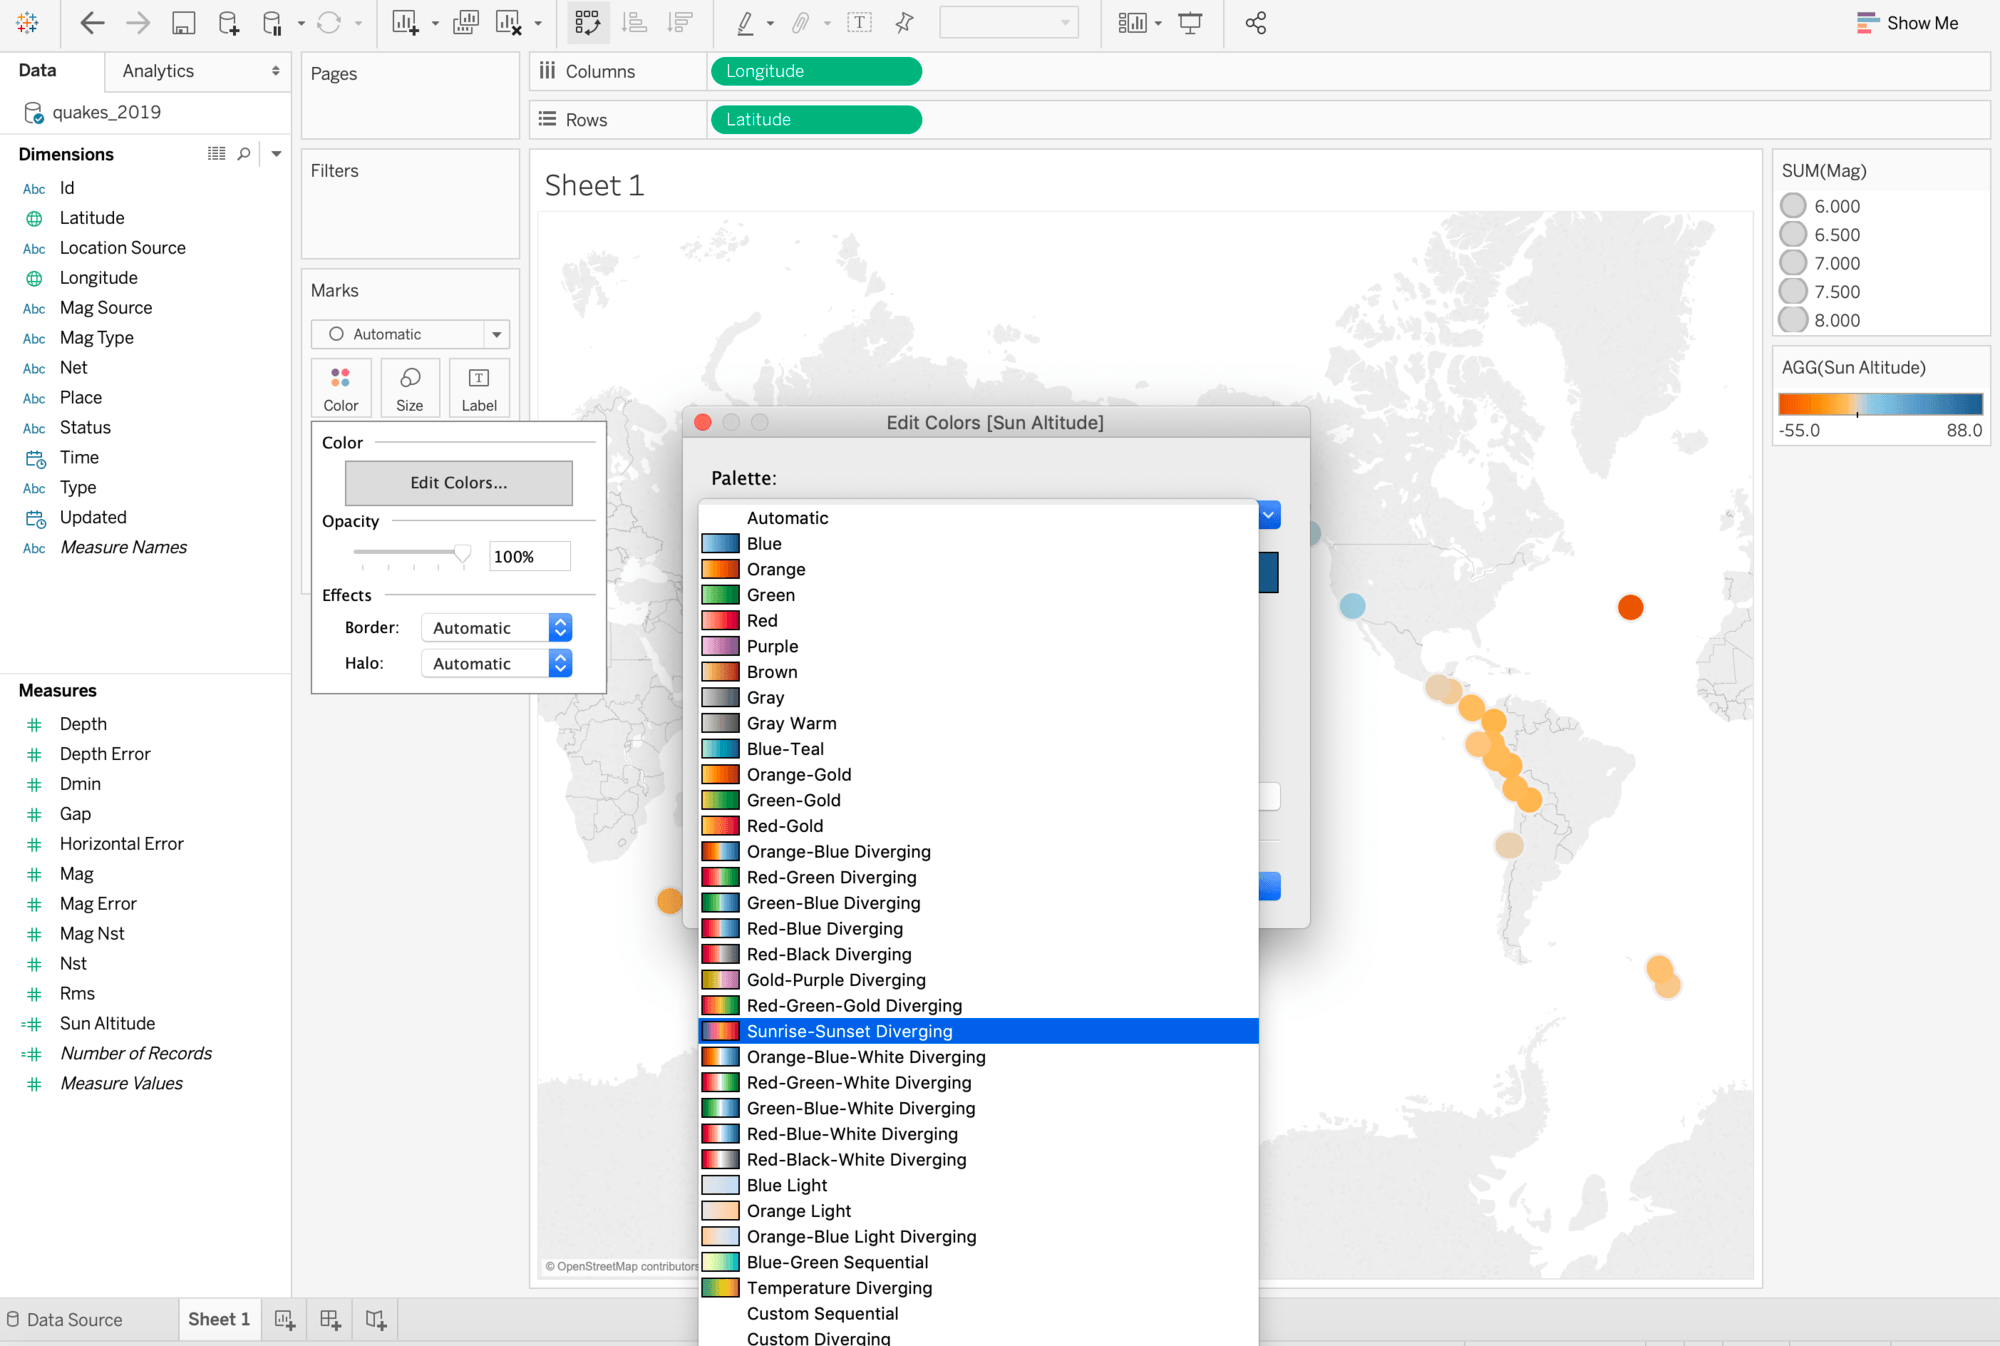
- Now that we have a way of calculating sun altitude from Lat/Long/Time values, we want to display them on our map. Tableau makes this easy: just drag "Sun Altitude" onto Color. Wait for the calculations to complete.
- Our points are now colorized according to time-of-day, but the colors aren’t quite right. Click Color → Edit Colors, pick "Sunrise-Sunset Diverging", and check “use full color range.”
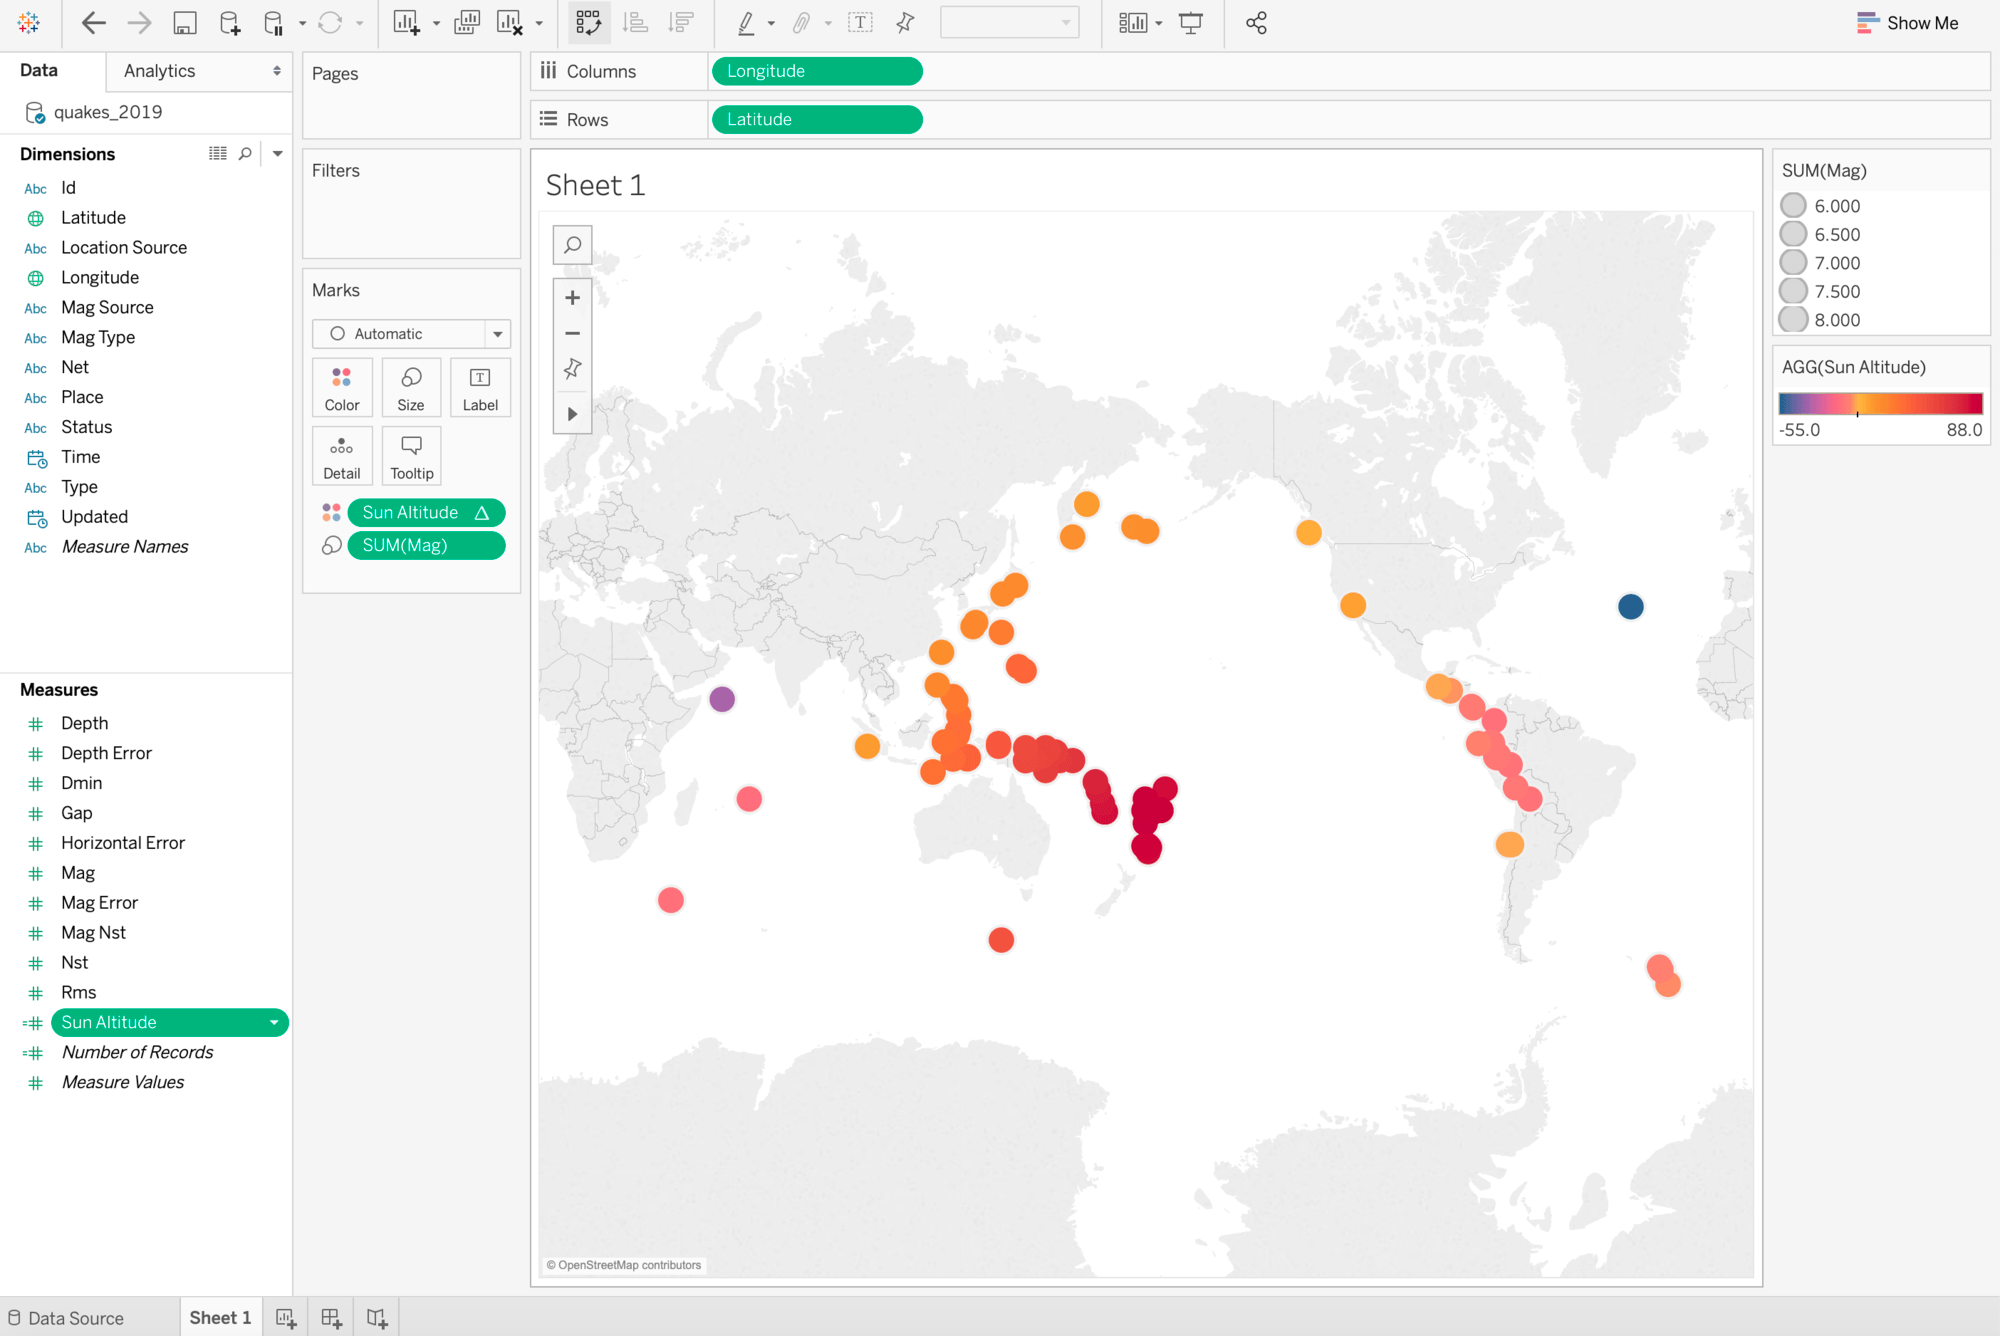
- If all has gone well, your map points will now be blue for nighttime (very negative) values, yellow near dawn/dusk (values near zero), and red for midday (highly positive):
SCRIPT_INT("
import Algorithmia
import math
client = Algorithmia.client('ALGORITHMIA_API_KEY')
algo = client.algo('jhurliman/SunMoonCalculator/0.1.0')
if _arg1[0] and _arg2[0]:
    input = {'lat': _arg1, 'lon': _arg2, 'time': _arg3}
    response = algo.pipe(input)
    rads = response.result['sun_altitude']
    return int(math.degrees(rads))
else:
    return 0
",
ATTR([Latitude]),
ATTR([Longitude]),
ATTR([Time])
)
Before continuing, let’s examine the code to understand what’s going on.
SCRIPT_INT() is Tableau’s wrapper function for executing Python code via TabPy; there are others, such as SCRIPT_REAL(), but in this case we’ll be returning an integer. The first argument is a String containing the actual Python that should be run. The remaining arguments — ATTR([Measure]) — extract data from our worksheet and pass it into Python as _arg1, _arg2, etc. All passed arguments are provided as List objects to the Python script.
Inside the Python code, we begin by bringing in the Algorithmia client library (as well as the standard math library). Next, we construct an Algorithmia Client instance using our user-specific API Key, which can be used to call Algorithmia functions. Then, we create an Algorithm instance, which is a callable reference to a function hosted on Algorithmia…in this case, jhurliman/SunMoonCalculator.
Then, after checking that we’ve been provided non-empty inputs, we assemble the argument into a single dict corresponding to the expected input format shown in jhurliman/SunMoonCalculator’s documentation, and pass this input to the Algorithm via .pipe(input).
All responses from Algorithmia’s functions contain a .result and a .metadata property, so we’ll descend into the .result and grab the 'sun_altitude' value (again, as shown on jhurliman/SunMoonCalculator). This is provided in radians, but Tableau renders integers a bit faster, so we’ll convert to degrees and truncate our return value to the whole integer.
PART 4 (optional): Making the integration more secure, efficient, and ergonomic
While this method of embedding scripts is functional, it has a few flaws: the API Key is exposed inside the worksheet, the Algorithmia client is re-created on each execution, and the script itself is longer than necessary. Fortunately, we can resolve all these problems by making use of a powerful feature in TabPy — deployed functions.
Open up a Python environment, modify the following code to use your ALGORITHMIA_API_KEY (and your local TabPy server port if not 9004), and run it:
import Algorithmia
import tabpy_client
TABPY_SERVER_URL = 'http://localhost:9004/'
DEBUG = True
def algorithmia(algorithm_name, input):
    if DEBUG: print("algorithm: %sinput: %s\n"%(algorithm_name,input))
    try:
        client = Algorithmia.client(ALGORITHMIA_API_KEY)
        algo = client.algo(algorithm_name)
        result = algo.pipe(input).result
    except Exception as x:
        if DEBUG: print(x)
        raise Exception(str(x))
    if DEBUG: print("result: %s"%result)
    return result
tabpy_conn = tabpy_client.Client(TABPY_SERVER_URL)
tabpy_conn.deploy('algorithmia', algorithmia, 'Run a function on Algorithmia: algorithmia(algorithm_name, input)', override=True)
Also note the DEBUG value: keeping this on will print some useful debugging information to your TabPy console, but you’ll probably want to re-run this with DEBUG=False in your production environment.
Head back to Tableau and change your Sun Altitude function to read:
SCRIPT_INT("
import math
algoname = 'jhurliman/SunMoonCalculator/0.1.0'
if _arg1[0] and _arg2[0]:
    input = {'lat': _arg1, 'lon': _arg2, 'time': _arg3}
    rads = tabpy.query('algorithmia', algoname, input)['response']['sun_altitude']
    return int(math.degrees(rads))
else:
    return 0
",
ATTR([Latitude]),
ATTR([Longitude]),
ATTR([Time])
)
Now, the API Key is embedded in your TabPy server instead of being exposed in your script, Algorithmia endpoints are easier to call because they don’t require manual construction of the Algorithmia client each time, and errors will be logged to the TabPy console. If desired, you can modify this code further to use a single global Client instance, or to acquire the API Key from env instead hard-coding it into in the deployed function.
Why Tableau + Algorithmia?
Tableau allows the rapid development and deployment of visualizations, so you can take insights generated by advanced analytics and bring them into the hands of decision makers at the speed of thought. With Algorithmia, you can take these visualizations to another level, enhancing them with machine learning models developed in-house or provided by independent developers on the Algorithmia.com marketplace.
Note: the code samples included in this post can also be found at: https://github.com/algorithmiaio/integrations/tree/master/Tableau
About Algorithmia: Algorithmia’s AI Layer makes it easy to deploy models as scalable services, regardless of framework, language, or data source. Deploy models from a variety of frameworks, languages, and platforms. Connect popular data sources, orchestration engines, and step functions. Scale model inference on multiple infrastructure providers. Manage the ML life cycle with tools to iterate, audit, secure, and govern.
相关故事

VizQL Data Service from Tableau: Use Your Data, Your Way
 2024/08/08

When and How to Use Multi-fact Relationships in Tableau
 2024/08/01

Top data books of 2021
 2021/12/12