DataFam Roundup: April 17-21, 2023


Welcome! Dig into this week's DataFam Roundup—a weekly blog that brings together community content all in one post. As always, we invite you to send us your content—and the DataFam content from your peers that have inspired you! Find the content submission form here.
Community Highlight
To recognize new and consistent Tableau contributors—we’re excited to have a section within the weekly DataFam Roundup called the Tableau Community Highlight. Find out how to get involved.

Jed Quinto, Senior Data Analyst at Toyota Motor Corporation
Melbourne, Australia
Jed Guinto (aka The Jellyman) is a Senior Data Analyst at Toyota Motor Corporation Australia. Jed runs a YouTube channel where he shares Tableau tips and tricks, has developed a Tableau Udemy course, and has created his own website for Tableau education called Jellyman Education with over 40 hours of content.
After spending 10 years studying and working towards becoming an Aerospace Engineer, Jed received his credentials and even worked in the field, however felt that it was not the right fit. He began his YouTube channel with the mission to help people get into the analytics industry by arming them with the technical skills to manage their career long term.
In 2013, Jed began teaching on Udemy and began developing his Tableau course in 2019. With a high demand for Tableau training and people turning to online resources during the pandemic, Jed found great success in teaching Tableau through this platform. However, even after creating a comprehensive course with more than 20 hours of content, Jed saw many gaps in what there was to know about Tableau. This led him to building his own website, Jellyman Education, that dives deeper into how to become an analyst. Despite having more than 40 hours of content currently available, Jed anticipates that within the next year there will be closer to 100 hours because of how much there is to learn. Jed’s focus is not only to teach Tableau, but to teach it from the perspective of an analyst in real life—with practical situations such as stakeholder management, agile development, career planning, job applications, salary management, etc.
Connect with Jed on Linkedin, Tableau Public, YouTube, and on his website.
DataFam content
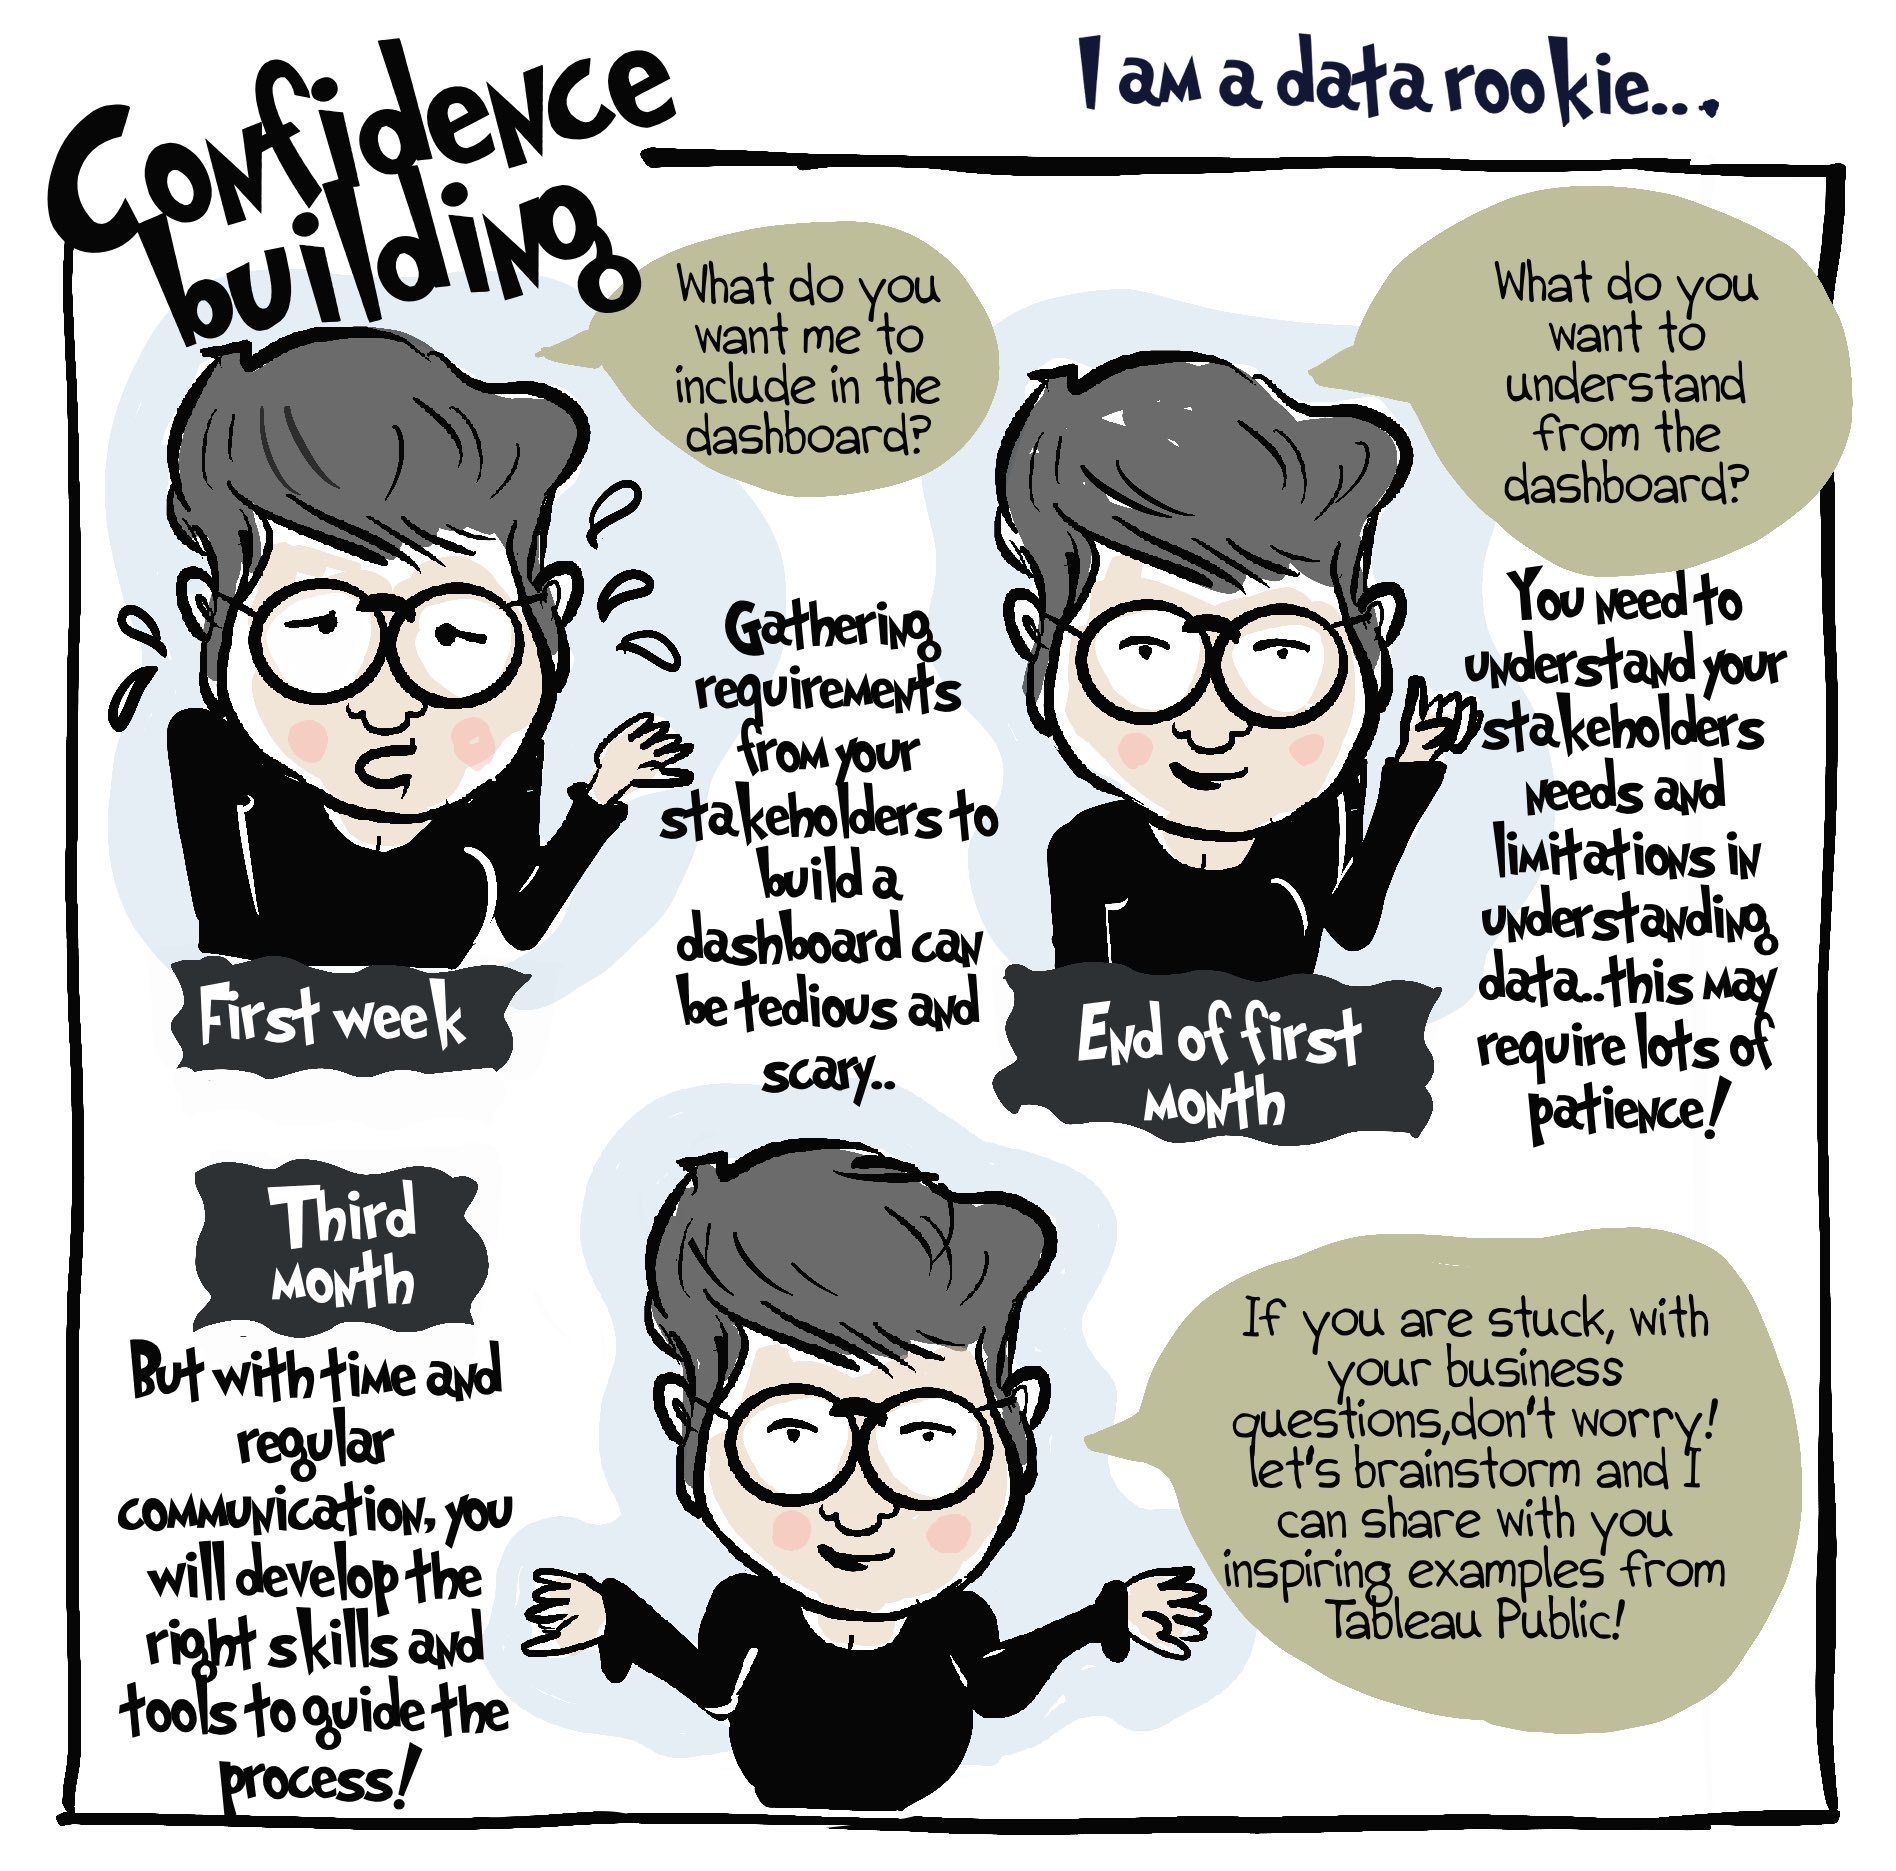
Shazeera Ahmad Zawawi: I am a data rookie Comic: Confidence Building
Dive into content created by the Tableau Community:
- Annabelle Rincon: Rativiz, How to control the zoom in Tableau.. and other things
- Jan Foo, The Data Leadership Collaborative: How Companies Can Drive More Impact with Data
- AOUANI Sabri: Tableau tip #40
- Emily Kund: #projecthealthviz
- Zach Bowders, Data + Love: Non-Sequiturs, Perspective, and Connections with Dzifa Amexo
- Steve Adams: Using Set Actions as a Filter Indicator
- Mark Palmer, Data Leadership Collaborative: AI Ethics and Regulation: A Guide for CDOs
- Brandi Beals: Pro tips to make the most of virtual Tableau Conference
- Shazeera Ahmad Zawawi: I am a data rookie Comic: Confidence Building
- Adam Mico and Nicole Klassen: Six Questions: Mental Health and the #DataFam
- Nicole Klassen: Scaffolding Tricks for Non-Date Data
Upcoming events and community participation
-
Data Leadership Collaborative (DLC) Networking Hour: Expand your network at an event designed to help facilitate connections among Data Leaders.
-
TrailblazerDX ’23 Tableau Quest: Leverage the power of data with the world’s leading analytics platform to drive better business decisions.
-
Community Calendar and Upcoming Events: stay up-to-date on the latest Women in Dataviz events and other data visualization-related events. If you'd like to submit an event to the calendar, please fill out this form.
Vizzes
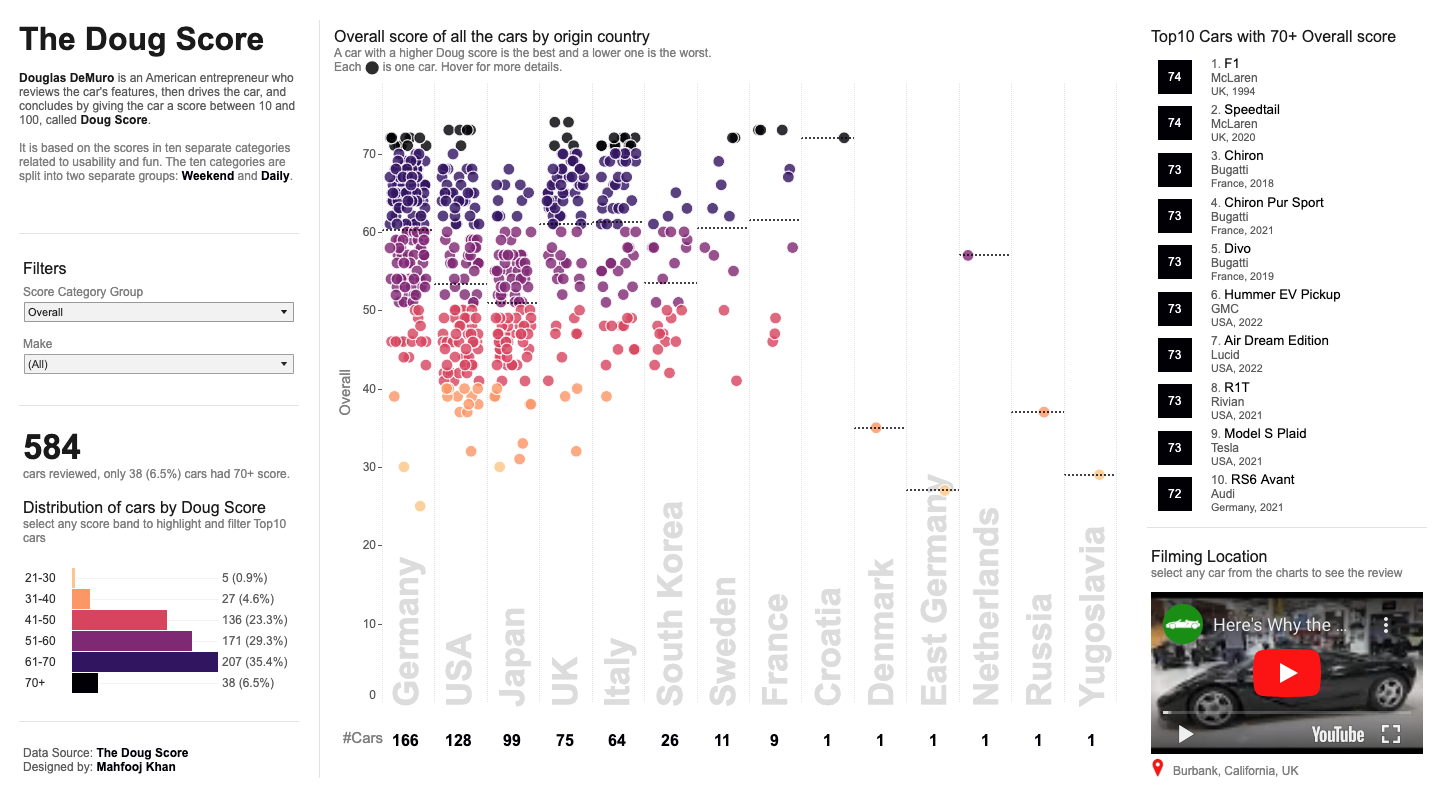
Mahfooj Khan: The Doug Score
See the latest Viz of the Day, trending vizzes, featured authors, and more on Tableau Public.
Check out some inspirational vizzes created by the community:
-
Chris Westlake: Flavour of Scotland
-
Mohit Maheshwari: Helpdesk Dashboard #RWFD
-
Mahfooj Khan: The Doug Score
-
PATH: Candidaturas Indígenas
Community Projects
Back 2 Viz Basics
A bi-weekly project helping those who are newer in the community and just starting out with Tableau. Not limited just to newbies!
Web: Back 2 Viz Basics
Twitter: #B2VB
Week 7: Create a Ranked Table
Workout Wednesday
Build your skills with a weekly challenge to re-create an interactive data visualization.
Web: Workout Wednesday
Twitter: #WOW2022
Week 16: Can you build insightful advanced tables?
Makeover Monday
A weekly social data project.
Web: Makeover Monday
Twitter: #MakeoverMonday
Week 16: Retirement Ages Around the World
Preppin' Data
A weekly challenge to help you learn to prepare data and use Tableau Prep.
Web: Preppin’ Data
Twitter: #PreppinData
Week 16: Easter and Full Moons
DataFam Con
A monthly challenge covering pop culture and fandoms.
Web: DataFam Con
Twitter: #DataFamCon
April 2023: Kids Month!
EduVizzers
A monthly project connecting real education data with real people.
Web: Eduvizzers
April 2023: Open Database of Educational Facilities in Canada (ODEF)
Games Night Viz
A monthly project focusing on using data from your favorite games.
Web: Games Nights Viz
Twitter: #GamesNightViz
Level 6: The Final Boss
Iron Quest
Practice data sourcing, preparation, and visualization skills in a themed monthly challenge.
Web: Iron Quest
Twitter: #IronQuest
Storytelling with Data
Practice data visualization and storytelling skills by participating in monthly challenges and exercises.
Web: Storytelling with Data
Twitter: #SWDChallenge
April 2023: design in light and dark
Project Health Viz
Uncover new stories by visualizing healthcare data sets provided each month.
Web: Project Health Viz
Twitter: #ProjectHealthViz
April 2023: The Lown Institute Hospital Index on Equity
Diversity in Data
An initiative centered around diversity, equity & awareness by visualizing provided datasets each month.
Web: Diversity in Data
Twitter: #DiversityinData
April 2023: Arab American Heritage Month & Language
Sports Viz Sunday
Create and share data visualizations using rich, sports-themed data sets in a monthly challenge.
Web: Sports Viz Sunday
Twitter: #SportsVizSunday
January 2023: Is it a Sport or a Game?
Viz for Social Good
Volunteer to design data visualizations that help nonprofits harness the power of data for social change.
Web: Viz for Social Good
Twitter: #VizforSocialGood
Apr 18 - May 23, 2023: World Health Organization (WHO)
Real World Fake Data
Create business dashboards using provided data sets for various industries and departments.
Web: Real World Fake Data
Twitter: #RWFD
Session 5: Diversity Score Card
Data Plus Music
A monthly project visualizing the data behind the music we love!
Web: Data Plus Music
Twitter: #DataPlusMusic
相关故事

DataFam Roundup June 2026

DataFam Roundup May 2026

Iron Viz 2026: Read Between the Data
 2026/05/28