
A Guide To Data Driven Decision Making: What It Is, Its Importance, & How To Implement It
What is data-driven decision-making?
Data-driven decision-making (DDDM) is defined as using facts, metrics, and data to guide strategic business decisions that align with your goals, objectives, and initiatives. When organizations realize the full value of their data, that means everyone—whether you’re a business analyst, sales manager, or human resource specialist—is empowered to make better decisions with data, every day. However, this is not achieved by simply choosing the appropriate analytics technology to identify the next strategic opportunity.
Your organization needs to make data-driven decision-making the norm—creating a culture that encourages critical thinking and curiosity. People at every level have conversations that start with data and they develop their data skills through practice and application. Foundationally, this requires a self-service model, where people can access the data they need, balanced with security and governance. It also requires proficiency, creating training and development opportunities for employees to learn data skills. Finally, having executive advocacy and a community that supports and makes data-driven decisions will encourage others to do the same.
Establishing these core capabilities will help encourage data-driven decision-making across all job levels so business groups will regularly question and investigate information to discover powerful insights that drive action.
The importance of data-driven decision-making
The amount of information collected has never been greater, but it’s also more complex. This makes it difficult for organizations to manage and analyze their data. In fact, NewVantage Partners recently reported that 98.6 percent of executives indicate that their organization aspires to a data-driven culture, while only 32.4 percent report having success. A 2018 IDC study also noted that organizations have invested trillions of dollars to modernize their business, but 70 percent of these initiatives fail because they prioritized technology investments without building a data culture to support it.
In pursuit to be data-driven, many enterprises are developing three core capabilities: data proficiency, analytics agility, and community. Transforming how your company makes decisions is no easy task, but incorporating data and analytics into decision-making cycles is how you will see the most transformative impact on your organization. This level of transformation requires a dedicated approach to developing and refining your analytics program.
Organizations benefiting from data-driven decision-making
Thanks to modern business intelligence, organizations are inching closer and closer to understanding the value of data-driven decision-making across all departments and roles. Here are a few examples of organizations that are effectively leveraging the value of their people and their data.
Lufthansa Group is a global aviation group that at one point, had no uniformity with analytics reporting across its 550-plus subsidiaries. Using one analytics platform, they increased efficiency by 30 percent, gained greater flexibility in decision making, and increased departmental autonomy. “We’re in a stronger position to create and design our analyses independently and a lot of people now understand the central importance of data for the success of Lufthansa,” shared Heiko Merten, Head of BI Applications in Sales.
Providence St. Joseph Health, a 51-hospital system with 100,000-plus caregivers, delivers high-quality, cost-effective healthcare to millions of patients annually. Patient data resides in many systems, but managing and integrating growing amounts of data is a complex task. Providence built dashboards accessible to the hospital system that make quality and cost data more transparent so providers can substantially improve quality measures and reduce cost of care. “We’ve moved the needle on the difficult-to-improve quality outcomes across the system and I believe part of that is because we’re all speaking a common language,” explained Dr. Ari Robicsek, Chief Medical Analytics Officer.
The Charles Schwab Corporation is one of the largest publicly-traded financial services firms based on client assets. Data is fundamental to enhancing the customer experience, driving operational leverage, and reducing risk. With growing staff interest in data and analytics, they rethought their capacity planning and data support model, opting for an enterprise BI platform that supports analysts and novice business users. “Without our visual analytics solution, we would be stuck analyzing enormous amounts of data in spreadsheets. Instead, our dashboards provide clear actionable insights that drive the business forward,” stated Donald Lay, Senior Business Intelligence Manager.
Without our visual analytics solution, we would be stuck analyzing enormous amounts of data in spreadsheets. Instead, our dashboards provide clear actionable insights that drive the business forward.
Create beautiful visualizations with your data.

6 steps to effectively make data-driven decisions
These steps can help you can find the “who, what, where, when, and why” to make the most of data—for you, for colleagues, and the business. But keep in mind that the cycle of visual analysis isn’t linear. One question often leads to another, which may mean you need to go back to one of these steps or skip to another—eventually leading to valuable insights.
Step 1 - Identify business objectives: This step will require an understanding of your organization’s executive and downstream goals. This could be as specific as increasing sales numbers and website traffic or as ambiguous as increasing brand awareness. This will help you later in the process to choose key performance indicators (KPIs) and metrics that influence decisions made from data—and these will help you determine which data to analyze and what questions to ask so your analysis supports key business objectives. For instance, if a marketing campaign focuses on driving website traffic, a KPI could be tied to the amount of contact submissions captured so sales can follow-up with leads.
Step 2 - Survey business teams for key sources of data: To ensure success, it is crucial to get inputs from people across the organization to understand short and long term goals. These inputs help inform the questions that people ask in their analysis and how you prioritize certified data sources.
Valuable inputs from across the organization will help to guide your analytics deployment and future state—including the roles, responsibilities, architecture, and processes, as well as the success measurements to understand progress.
Step 3 - Collect and prepare the data you need: Accessing quality, trusted data can be a big hurdle if your business information sits in many disconnected sources. Once you have an idea of the breadth of data sources across your organization, you can start data preparation.
Start by preparing data sources with high impact and low complexity. Prioritize data sources with the biggest audiences so you can make an immediate impact. Use these sources to start building a high-impact dashboard.
Marketing agency Tinuiti centralized more than 100 data sources with an analytics platform that supports faster data preparation to create custom dashboards for 500-plus clients and give them the full story of their brand efforts.
Step 4 - View and explore data: Visualizing your data is crucial to DDDM. Representing your insights in a visually impactful way means you’ll have a better chance of influencing the decisions of senior leadership and other staff.
With many visual elements like charts, graphs, and maps, data visualization is an accessible way to see and understand trends, outliers, and patterns in data. There are many popular visualization types to effectively display information: a bar chart for comparison, a map for spatial data, a line chart for temporal data, a scatter plot to compare two measures, and more.

Step 5 - Develop insights: Critical thinking with data means finding insights and communicating them in a useful, engaging way. Visual analytics is an intuitive approach to ask and answer questions of your data. Discover opportunities or risks that impact success or problem-solving.
JPMorgan Chase embraced a modern analytics solution to make decisions that are important to the bank’s health. JPMC gains a comprehensive view of the customer’s journey by reviewing line-of-business relationships (i.e. products, marketing, and service touch points) with customer data. For example, the Marketing Operations team performs analyses that influence design decisions for the website, promotional materials, and products like the Chase mobile application.
Step 6 - Act on and share your insights: Once you discover an insight, you need to take action or share it with others for collaboration. One way to do this is by sharing dashboards. Highlighting key insights by using informative text and interactive visualizations can impact your audience’s decisions and help them take more-informed actions in their daily work.
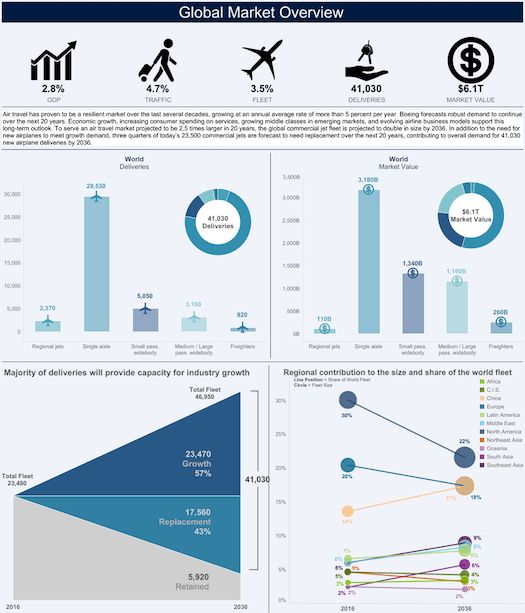
Market Overview Dashboard from Boeing
This dashboard from Boeing uses 10 charts to give viewers different perspectives and a chance to discover new insights about airplane demand over the next 15+ years.
Explore the Public Viz
With an analytics platform such as Tableau, you can create and share dashboards in a secure, governed environment where others can search, view, and reference data in their workflows. To ensure that you are serving the needs of your organization, you should regularly evaluate governance models and data sources so people can find the data they need.
Data-driven decision-making is transformational. When visual analytics is embraced by everyone in an organization, data becomes a critical enterprise asset. With a modern business intelligence solution, data-driven decision-making becomes a company mission, more than a hassle. This leads to faster, more-informed decisions. And these decisions will generate a stronger bottom line, greater creativity and commercial success, and more engagement and collaboration from employees.
Read more about the elements of strong Data Cultures and learn how to build your own with the step-by-step guide, Tableau Blueprint.