6 Myths of Moving from Traditional to Modern BI
In spite of the promises of modern BI, some organizations are hesitant to make a move away from their traditional platforms. To help dispel common fears and bring modern analytics to your organization, this eBook explores myths and misconceptions about migrating from traditional to modern BI, covering:
- Understanding visual analysis and self-service capabilities
- How to evaluate modern platforms, including total cost of ownership
- Governance as a partnership between IT and the business
- Navigating (and minimizing) the costs and timeline of a migration
It’s no myth or mystery that digital transformation has created a massive influx of information; data is everywhere, all the time, and it’s not slowing down. With huge data volumes and new analytics use cases, everybody expects to be able to access and use new information to drive decision-making and quench their business curiosity. And now, modern business intelligence has lowered the barrier to entry to widespread, secure, and governed data access and analysis. Today’s self-service analytics platforms not only help organizations get more value from their data, but empower more people to visually explore data, iterating on and sharing their discoveries.
Traditional BI has primarily served to illuminate the known unknowns; users ask specific questions and IT-led reporting provides them answers, repeating the cycle with new questions and changing business requirements to get the next insight. Modern BI has opened new doors for users across all skill levels to explore unknown unknowns—to not only ask and answer their own questions, but to arrive at impactful insights that they weren’t initially seeking. All the while, the modern analytics platform balances business agility with IT’s need for security and governance.
In spite of the promises of modern BI, some organizations are hesitant to invest. Perhaps they misunderstand the true value of modern, self-service analytics and their transformational potential, or they're afraid to navigate the challenges to migrate and adopt a modern solution. Sometimes analytics are the last piece in modernization as they move other work to the cloud, which can introduce other challenges. In the end, organizations are held back from unlocking the creative potential and enhancing the decision-making of their employees that a modern, self-service analytics platform and the right data strategy can provide.
In this eBook, we’ll explore common myths and misconceptions about moving from traditional to modern BI.

MYTH #1: Traditional BI already has a solution for visual analysis and data exploration
As you set sail on your journey to modern business intelligence, don’t be lured by a beautiful dashboard under the guise of true, agile analytics. Unless you can discern the self-service processes of visual analysis from simply creating a visualization, your BI efforts may be headed for shipwreck—or at the very least anchored in stagnant waters. Be wary of vendors offering just enough “modern” functionality to keep you supporting their accompanying technologies. Are they investing in your success with visual analysis, or trying to to maintain a market share? Mind the motive beneath the song each solution is singing—only when you fully understand the value of modern analytics can you sail on to new, transformative waters.

Tableau is on a mission to help people see and understand data. There are many ways we enable visual, self-service analysis, data discovery, and exploration.
True visual analysis makes data easy to explore by using the visual as an interface for the data, not simply as a way to display a result. Many traditional tools retain antiquated processes that require a set of predetermined criteria to create visualizations, only to limit the insight end users can glean as a viewer. What happens when they have follow-up questions or need to pivot their analysis? Do they go back to IT and wait?
The transformative value to the business is not in an end result, but in the availability of new insights that users discover along the way as they visually explore the data. With a modern BI solution, immediate visual response allows limitless, self-service data exploration. Reaching additional insights aren’t constrained by initial requirements, nor is deep technical expertise required to ask iterative questions and pivot the analysis. In fact, modern platforms are constantly adding more machine learning and AI-driven features to augment or guide analysis for faster insights or explanations of results.

It’s like giving you a flashlight, and you’re able to look at the corner of that dark room that you’ve never been able to see before.
Learn how Southwest Airlines brought new insights to 36 departments
VizQL, our patented visual query language, provides immediate step-by-step visual feedback as it translates drag-and-drop actions into queries and visual results right before your eyes—no “building” vs. “viewing” modes.
Show Me is a powerful feature that suggests the best visualization types based on the data you’re working with. You don’t have to know the end format. Just select the data that might help you answer your question and explore the suggested chart types.
Built-in mapping abilities include display data by country, state, city, and more without latitude or longitude. Tableau automatically recognizes geographic fields, and supports spatial files, linear geometries, dual-axis maps, and more.
Statistical and advanced analytics are made simple with drag-and-drop trend lines, distribution bands, clustering, and more.
Date hierarchies allow you easily move from years to quarters to months to days, or easily define custom drill-down paths. Tableau automatically recognizes and supports dozens of date formats.
Metadata management is equally simple and visual. Perform cross-database joins, create sets, groups, and hierarchies, or exclude columns, rows, or values (like outliers) with just a few clicks. Do any of this mid-analysis without having to start over.
Smart recommendations make insights even easier, from suggesting data prep functions to surfacing certified and popular data sources, as well as published content with high traffic and engagement.

MYTH #2: Modern BI can be evaluated like traditional BI platforms
Embracing a modern BI platform means letting go of the past. A powerful, modern approach to analytics demands appropriate evaluation criteria. Certain aspects of your traditional BI system that served you well may hold you back from success with a modern platform. Don’t let antiquated processes haunt your organization. It’s time to pay your respects to the feature checklist of yesterday and follow the bright light—not of transcendence, but of transformation. If you’re invested in modern analytics for driving change, you must take the time to understand the full value of a modern platform with an extensive evaluation.
It’s clear from the first myth that the greatest value of modern BI comes not from the destination, but how your users get there. And just as critical as the journey to insight is the journey to selecting your modern analytics platform. When so much transformational potential lies in the experience of visually working with data (not just the final results it can produce), it doesn’t make sense to evaluate a modern solution solely on the end visualizations possible.
Think of it this way: An airplane and a car can each get you across the country, but the experiences and processes involved are vastly different. Would you use the same criteria to choose a car as you would to book a flight? What about the bag you’d pack for the trip, or the meals and activities you’d plan for when you’re en route? Not every traditional analytical capability has value in a modern platform when the way you arrive at insight is so different.
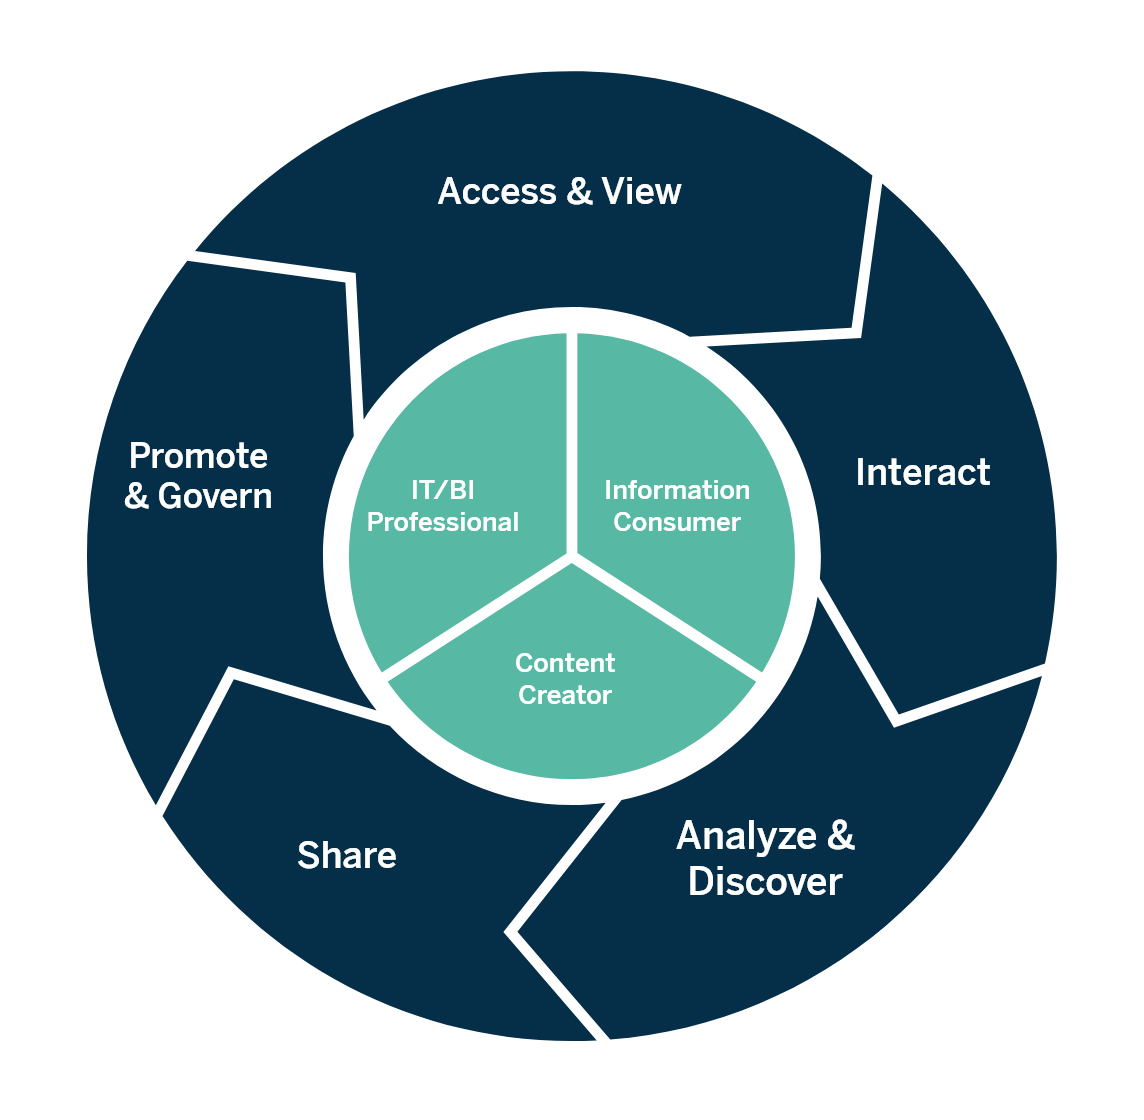
To ensure your organization’s investment in a modern analytics succeeds, you’ll need to work collaboratively—IT and the business, together—to understand how modern BI will help your organization reach success. This means a clear understanding of the roles, responsibilities, and processes of the modern analytics workflow alongside the right depth of analytical ability and ease of use in a modern analytics technology.
Here are some important criteria to consider when selecting your modern BI platform:
A smooth experience from integration to accessibility
- Do users have to switch products, modules, or otherwise interrupt their flow?
- What is IT’s role in the process of users getting answers from the data?
Flexible deployment options
- Does the platform restrict or dictate your architecture and data strategy?
- Does it scale up and out as needed in a straightforward manner?
Fast adoption at scale
Effective user enablement
- What are the available training, help, and community resources surrounding the platform?
- How is the vendor’s reputation for resolving issues, engaging with and empowering users?
Clear pricing and packaging
- Is the model transparent, flexible, scalable?
- Do the licensing options offer the right features and value for the price?
Dive deeper into these and other important considerations with our Evaluation Guide


Modern Analytics Workflow
MYTH #3: The cost of moving to modern BI isn't justifiable
Deploying a modern analytics solution doesn’t mean you have to burn everything down and rise from the ashes to find success. Perceived costs may ruffle your feathers, but there is immense value in how modern analytics can transform an organization's data culture—and potential cost savings with careful consideration and planning. When you ignite a curiosity and passion for data, it can lead to huge benefits—from massive amounts of time saved to new insights that increase efficiency and reduce costs.
You’ve poured money, time, and resources into your data strategy, so it’s natural to feel fear and anxiety at the thought of pivoting such an investment. Fortunately, you don’t have to break the bank to make the transition possible, because modern BI can leverage the technology investments you’ve already made to support your data strategy. Additionally, strategic timing of the migration can help to minimize spend, while valuable training and support resources can speed up your time to market and adoption, helping your organization see greater benefits from modern BI faster.
For ROI, seek high value—not low cost
While a free, bundled solution may be tempting, think carefully about why you’re adopting modern analytics: Don’t you want to drive transformative decision-making with a platform people love to use? A free or low-priced solution doesn't mean it won’t cost you somehow. You need a provider whose analytics platform is purpose-built to drive change—not just make and share reports. Will your solution help you modernize, succeed in the cloud, and connect to and integrate all your data and technology investments?
Beyond total cost of ownership
Consider more than the price of a software seat; what's the multi-year cost of infrastructure, deployment, maintenance, and full-time IT employees to deploy, support, and scale the system? If you have to license and connect a stack of products or disconnected tools to get the full value of your modern analytics solution, that’ll only add costs and complexity to the deployment, maintenance, and administration.


Maintenance and migration timing
Another way to potentially reduce costs of moving to modern BI is to time your migration with your traditional platform’s maintenance renewal. The perfect window of time will vary from organization to organization based on which traditional platform you’re using and the complexity your data pipeline and environment. You’ll need to scope the work and establish a timeline that accounts for the proper training and testing to validate your new solution and optimize this period of overlap to minimize spend.
Some organizations feel that the immediate benefits of self-service analysis are worth the move, even if they are early into a renewed maintenance contract. Through a proof of concept, you may see the potential time or cost savings, increased efficiency and collaboration, and new insights to justify the spend of a longer coexistence before sunsetting your traditional solution. Alternately, should you discover that certain use cases don’t make sense to modernize, optimizing costs becomes a matter of scaling each solution to the right users and use cases.
Time to market and adoption
IT has too often deployed a solution—even one in high demand from the business—only to see adoption stall or drop off. With much of modern BI’s success reliant on engagement, you’re only guaranteed lasting value if your investment is sticky. Engagement is a shared responsibility, but creativity and aid can offer plenty of encouragement. As you weigh the costs and value of moving to a modern BI platform, don’t forget to factor in customer success resources that can speed up your time to market and adoption—including training, help documentation, forums, and the user community.
MYTH #4: All I need to reap the benefits of modern BI is the right technology upgrade
The right modern BI technology is critical for organizational and digital transformation, but much like a full moon on a clear night, it’s just an enabler in the transformation process. Data-driven decision making requires changes in the very fabric, or DNA, of the organization, to awaken the thirst for data in your people. This means IT and the business must collaborate—with clearly defined roles and new processes—to help employees balance their instincts with new insights. It may sound like a hair-raising venture, but with a tight strategy, your change management efforts won’t be met with torches and pitchforks.
A new technology alone won't drive behavioral change in the workplace. Modern BI adoption requires a thoughtful strategy to ensure success. Backed by leadership and a supportive community of passionate data users, IT and the business must work together to navigate changes in analytics roles and responsibilities, processes and pipelines, and how success is measured. Fortunately, the ease of use and powerful insights of modern BI platforms often make business users more excited than wary to participate.
Remember the airplane vs. car analogy? Installing a modern BI platform and expecting great results without addressing organizational and behavioral changes is like giving your employees a plane—and then wondering why they’re driving it down the freeway.
A Blueprint for building a data culture
Every employee holds the ability to discover the next breakthrough. The promise of modern analytics is that you can harness that ability, and anyone can find business-altering insights in their data. But most organizations struggle to engage their people and manage change. They fail to build a culture where data is valued and applied to everyday decisions.
Tableau has developed a Blueprint based on the best practices gathered from tens of thousands of customers around the world, and more than a decade of helping people see and understand data. This step-by-step guide can help you build a successful data culture in your organization with critical capabilities centered around a flexible governance framework—designed to enable adoption, not restrict it.

Teams have gone from report building to decision making… We can create insights much faster and quickly make decisions across the business.
Learn how A&F built a self-service data culture with governance standards
MYTH #5: Modern BI means ungoverned, self-service chaos
Data governance can mean different things to different people, but its serious nature is universally understood. As security, governance, and risk mitigation are core IT functions, IT has naturally safeguarded the organization’s data like the treasure it is—flashing teeth and fiery breath when necessary to protect it. Although modern BI promises to share data with everyone, it certainly doesn’t mean the masses will charge with swords unsheathed to take what isn’t theirs. Rather, a modern governance framework helps business users participate in data and content security, access, and freshness as a shared responsibility.
As guardians of the organization’s data integrity, IT is wary of an ungoverned, wild west wherein unfettered data access and rogue content risk creating confusion or contradictions. But moving from top-down, IT-led business intelligence to a modern self-service model of enablement doesn’t mean a drastic change in governance overnight.
Initially, IT may retain more traditional roles in regards to data access, metadata and content management, and site administration. Over time, IT should delegate responsibilities to properly trained business users to help the modern analytics deployment scale.
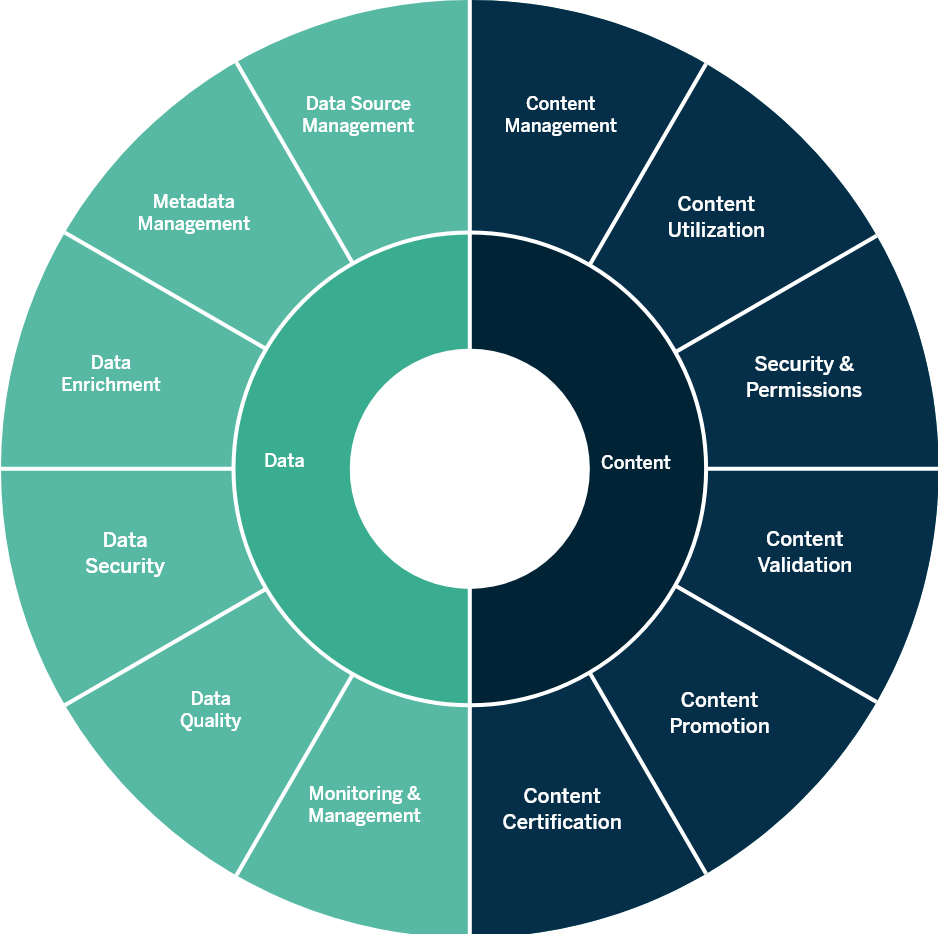
Tableau offers a governance framework comprising data governance and content governance. Here are a few examples of ways to empower the business as your deployment scales:
Create clear guidelines so the appropriate users can build the skills to publish and certify their own data sources while complying with governance policies.
Configure automatic database and content permissions based on user roles to provide access to the trusted data that matters most to users. Leverage your existing authentication standards—whether Kerberos, SAML, SSL, Active Directory, client certificates, etc.
Automate, embed, and extend Tableau to fit specific business requirements or address specific workflows. For example, you can build a script to log in, create new user accounts, generate a subscription, and so on.
Maintain separate hierarchies for sandbox (experimental, test) projects from your production (live, certified, promoted) projects. This simplifies inherent content permissions for project leaders or site administrators managing the content.
Learn more about governed self-service analytics at scale

We need to enable the business to create things we can never even imagine as an IT department. We just can’t create those things in an ivory tower.
Learn how AmeriPride increased governance, collaboration, and customer success

Governance Framework
MYTH #6: The transition to modern BI is just too complicated to be done
Deploying a new solution while maintaining important day-to-day work is no simple commitment. Occasionally, organizations navigate most of the twists, turns, and complexities of the project only to be met by a beastly complication in the final stretch. It’s a great disappointment to reach the end of the maze and find your new solution is half success, half failure. You’ll need an experienced navigator with a solid, strategic framework to help you find success—but it can be done!
If you relate to this fear, you’ve probably tried to deploy a new technology solution and missed critical deadlines, overspent your budget, or fell short to deliver on the promise of the solution. It’s a legitimate concern to spend so much time and effort on a complex deployment just to have it fall flat, even if certain forces are outside of your control. It’s not always easy to anticipate the speedbumps, roadblocks, or dead-ends that appear during your journey, nor is it viable to take internal resources away from their important work for long.
There’s good news: You don’t have to do it alone. The industry is full of BI experts, and in fact, we recommend you find a strategic partner—a consultant or systems integrator—with the right expertise and framework to help you navigate the transition. This partner should have prior experience in migrating or replacing traditional BI with the modern analytics platform you choose. Additionally, they should have a deep understanding of the nuances of your needs and how to satisfy them through modern BI. Finally, they should have a solid framework and be able to help you outline an appropriate timeline to deploy your new solution.

Here is an example framework to make your transition from traditional to modern BI successful:
The first phase involves planning, scoping, an inventory of your reporting and needs, and a closer looking at your financial model to develop the necessary strategy for the migration. During this time, you’ll also need to establish or evaluate your cross-functional steering committee, organizational roles and responsibilities (including mapping users to license roles), and key aspects of your data and governance strategy that will set users up for early successes.
The second phase is the heavy lifting to migrate the most impactful modern BI content. Since traditional reports have often been designed according to user requirements developed before modern BI capabilities were largely available, this is a good time to work with the audience for reporting to give them best-in-class analytics. As key use cases are built with Tableau, you may continue to solidify processes around reporting, governance, maintenance and monitoring, etc., begin working with workbook and data source prototypes, and kick off user training.
The final phase is for validation during a coexistence of your traditional and modern systems. As users will ramp up on your new modern solution, you should expect them to validate that it not only meets their reporting needs, but that visual, self-service analysis offers new insights to their data and benefits to the business. Ideally, you’ll sunset or scale down your traditional platform as you reach the maintenance contract renewal period.
Why Tableau
The Tableau platform provides the greatest depth and breadth of analytical capabilities to deploy the data that matters across your organization—including flexible data access and powerful data prep capabilities. Solid security and governance features keep data in the right hands and ensures users can find the accurate and trusted content they need to make decisions.
Deploy Tableau where you want—on Linux or Windows, on-premises, in the public cloud, or fully hosted SaaS, even embedded in web portals and applications. Work with any shape, size, and type of data, whether on-premises, in cloud applications, or flat files, and analyze your data where it is—live or in-memory. And we provide a full suite of API for extensibility. Flexibility and choice are Tableau philosophies.
Evaluating a solution doesn’t stop at the software. You should also consider how it will be rolled out, enabled, scaled, and supported to ensure adoption and engagement. One of the most valuable assets that differentiates Tableau, speeds up time to market, and ensures lasting engagement is our community. We’re fortunate to have a passionate, global user base with more than 150,000 active participants in our Community Forums and 165,000 participants in 500 user groups worldwide. We often hear from our customers that “the community will not allow you to fail.”
Finally, everything we do is driven by our mission to help people see and understand data. We are solely focused on the modern BI and analytics market, with an unmatched investment into research and development. We focus on building data skills and internal communities that drive ongoing success as your data strategy and business needs evolve and expand.
Tableau is so great because it talks to all these different softwares. And for us, this was a big milestone—tying them together…
Learn how Verizon combined billions of rows of data to reduce support calls by 43%

We changed our course with our increase to 12,000 Tableau users along with a new leadership direction that was heading towards self-service analytics. We wanted to change into a more supportive and nurturing environment and the users came with us in this journey.
Learn how Charles Schwab grew their Tableau adoption and Center of Excellence
About Tableau
Tableau is a complete, easy-to-use, enterprise-ready visual business intelligence platform that helps people see and understand data through rapid-fire, self-service analytics at scale. Whether on-premises or in the cloud, on Windows or Linux, Tableau leverages your existing technology investments and scales with you as your data environment shifts and grows. Unleash the power of your most valuable assets: your data and your people.
Additional resources
Tableau for the Enterprise: IT Overview
Tableau Blueprint
Governed Self-Service Analytics at Scale
Modern BI & Analytics Evaluation Guide
Why IT Professionals Choose Tableau for Modern BI
Making Digital Transformation Actionable through Analytics