
The data of IT
Connect directly to ServiceNow, Splunk, and more
IT is the backbone of every business, keeping every other department up and running. Today, IT organizations have more data than ever before. Whether its service ticket management, asset tracking, budgeting, staffing, or software monitoring – that data has the power to speed up and simplify your job.
With Tableau, you can help your team keep a constant pulse on your tools and systems. Centrally monitor all of your infrastructure with a single dashboard and make proactive decisions to minimize risk and maximize your budget. Know where your resources are allocated and the impact they’re making. Improve the life cycle of every support case. Leverage the data you have - from ServiceNow, Splunk, Google Analytics, or wherever else it may live - to increase efficiency and optimize effectiveness.
Explore below to see how IT organizations have used data to discover insights that lead to better decisions.
See how Nationwide uses Tableau with their IT data.
Discover Tableau: your new IT partner.
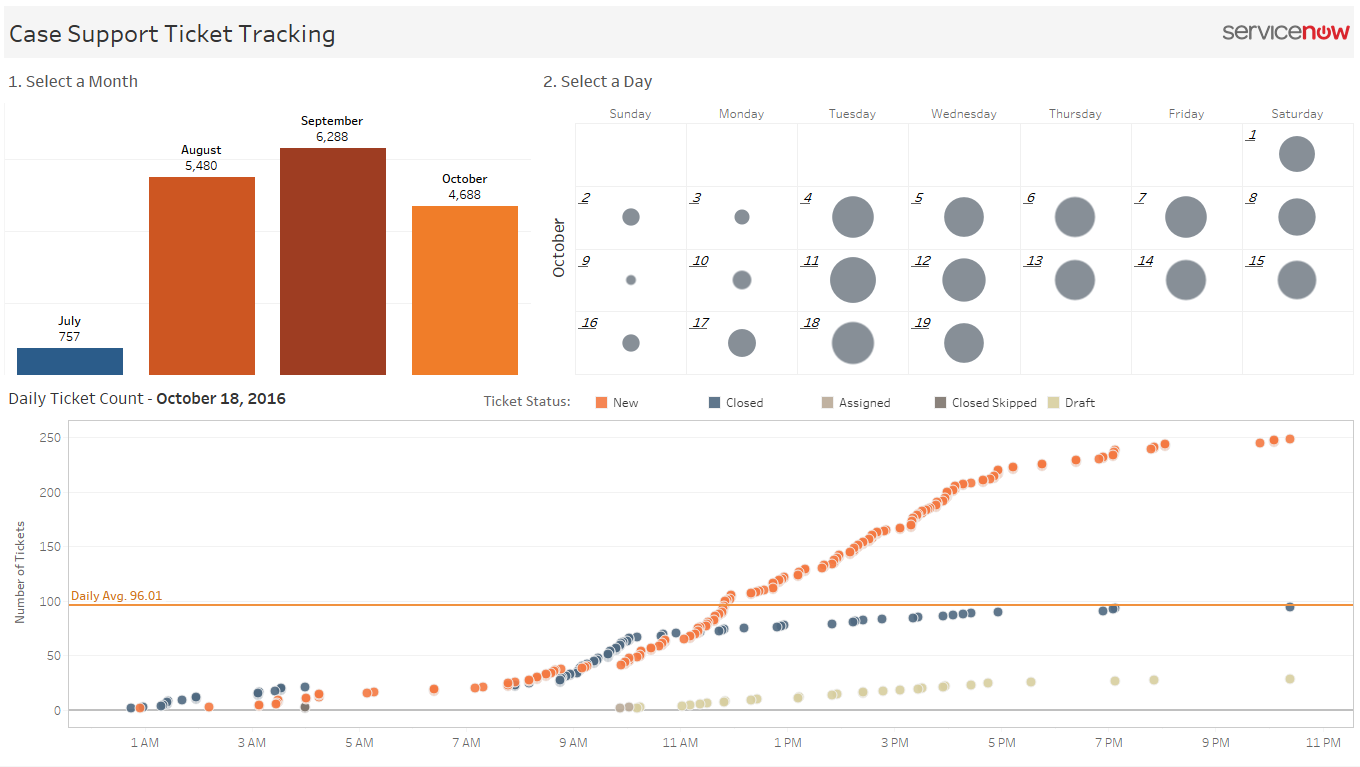
Track tickets
Connect directly to your software and hardware systems—like ServiceNow—to get a better understanding of who owns what, what the status of a project is, or where an opportunity for improvement exists. Interact with the dashboard to the right to see the status of a case on any given day.
Explore the Dashboard
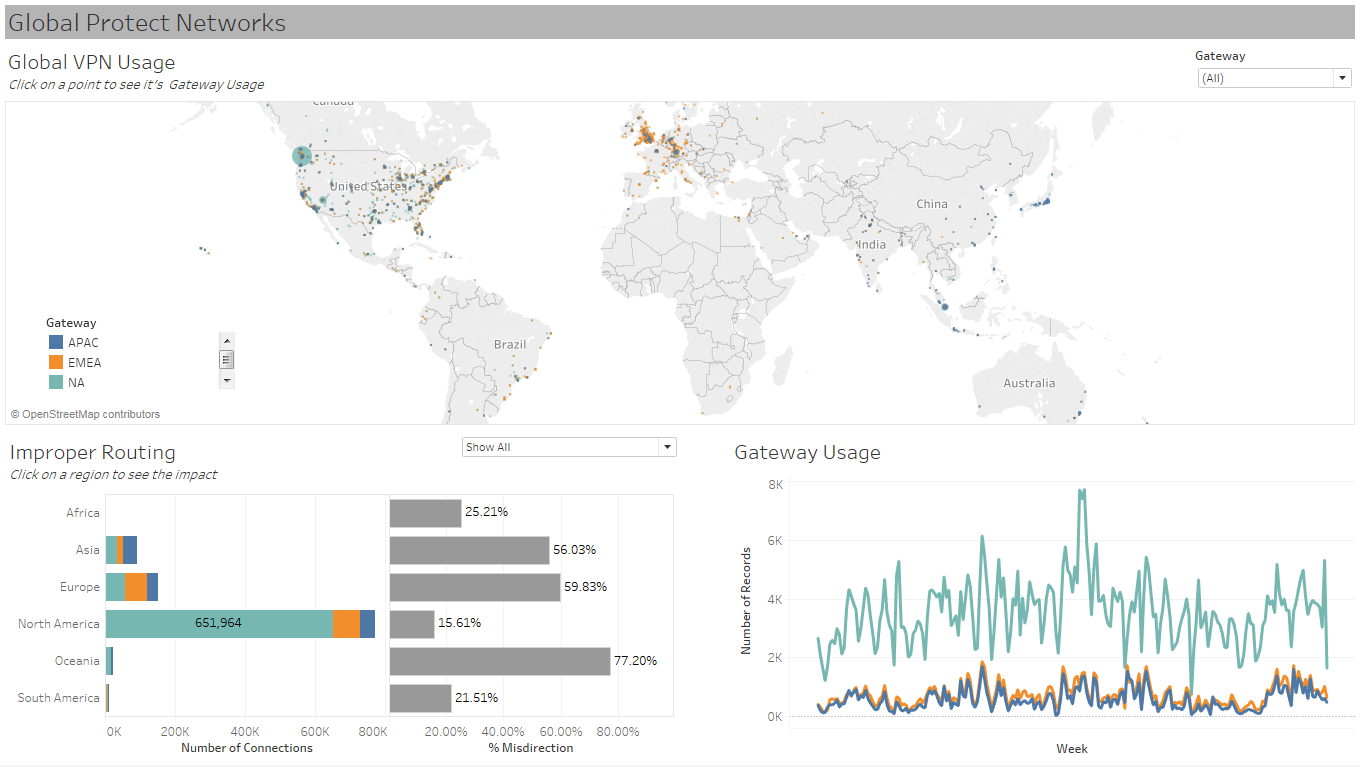
Monitor utilization
It's important to know what systems are up—and if they’re nearing capacity—at any given moment. With Tableau, get ahead of system outages and ensure that your customers are never interrupted. Use data driven alerts on Tableau Server to be notified when your data is at a given threshold.
Explore the Dashboard
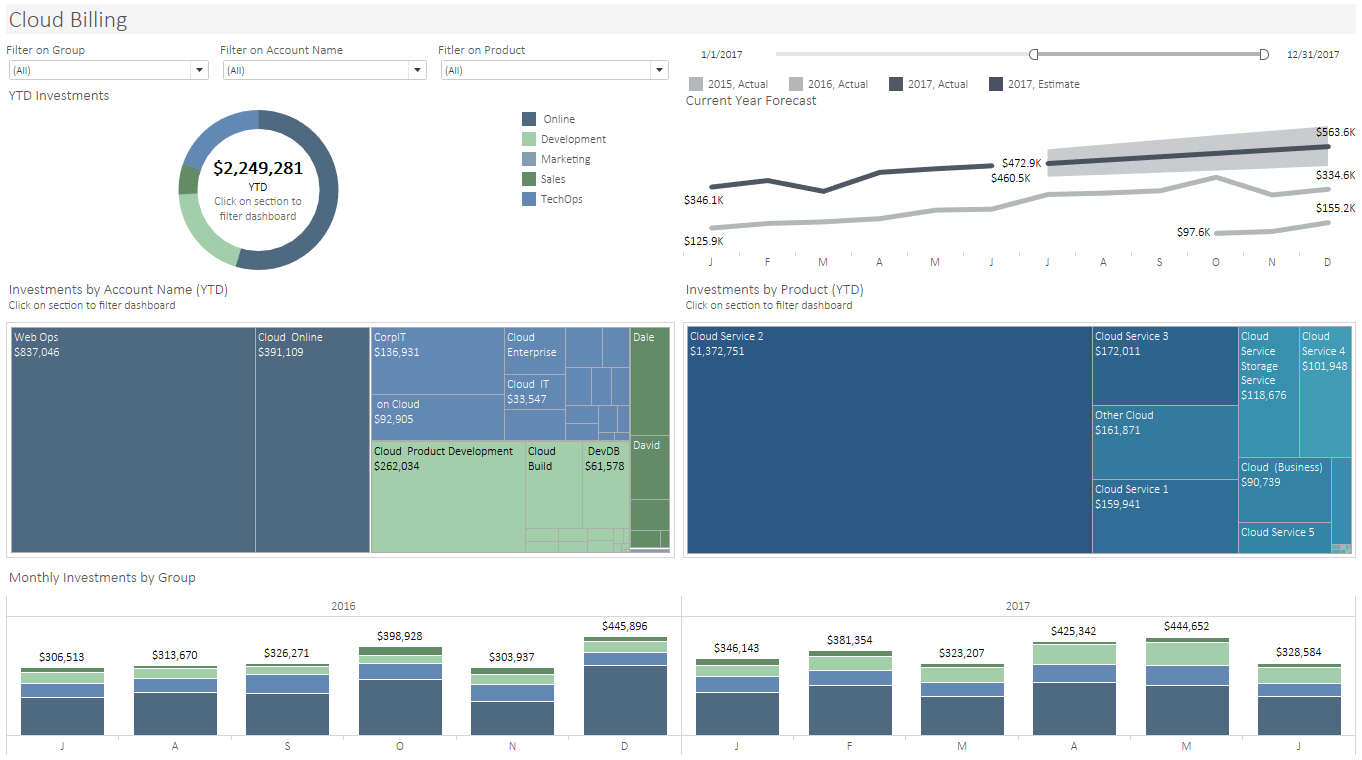
Allocate resources
Understand how your resources are being used, and make adjustments where necessary. Whether it's time, people, or materials, use Tableau to monitor and improve how your organization allocates its assets and avoids collisions. With a go-to dashboard for monitoring your IT activities, your organization will scale more efficiently.
Explore the Dashboard
10 Best Practices for Building Effective Dashboards
Learn how to create a useful and compelling dashboard to make an impact today.
Building a Culture of Self-Service Analytics
Learn how to make data analytics a part of everyone's job at your company.
Things like helpdesk usage statistics, user analytics from our web portal, an analysis of classroom usage, and a look at a computer lab’s student use metrics to help decide a facilities question. You name it; we've written a Tableau report that pulls it in.
See what's new to Tableau
Native connectors - ServiceNow
Dive directly into your source systems and take a closer look at how they’re performing. We even have a native ServiceNow connector to get you up and analyzing instantly.
Keep stakeholders informed
Easily produce interactive dashboards with clear tooltips. Curate, describe, and create metadata to make it easier for other to understand your log files and machine data.
Data-driven alerts
Tableau Server now gives you the ability to get alerts based on thresholds in your data. Be notified when a system is down or when a limit has been reached. Learn how to set an alert with just a few clicks.
Table & join recommendations
Tableau uses machine learning to recommend database tables and joins based on your organization's data source usage metrics. See how easy it is to find the right tables to join to perform relevant analysis.