Tableau brings data literacy to the classroom at School 21


At Tableau, we’re on a mission to create a data-literate world. To get there we’re educating the next generation by arming students with valuable analytical skills. Our academic programs empower students to explore, understand, and communicate with data and make data-driven decisions, both in their professional and personal lives.
Tableau partnered with School 21, a pioneering UK school that prepares students for success in the twenty-first century, to ask students how they’d address data literacy.
School 21 believes in doing things differently to equip young people with the skills and experience needed to succeed in life, so it created the Real World Learning Project, a 16-week program that brings students and the professional world together in a meaningful way. In the program, students Years 10 and 12 work in teams to solve real problems for real organisations like HSBC, The Met Police, and EY. One team of 16- and 17-year-old students were tasked with the challenge of data literacy—how they’d transform a group of individuals from data illiterate to data literate—culminating in an epic “viz off” competition.
Real-world mission: Data literacy
Students were provided Tableau for Students licenses through Tableau’s Academic Programs, which includes access to Tableau Desktop, Prep Builder, and our eLearning platform. The group of students, Matika, Riyaaz, Aaron, and Sadia, began by working through the Tableau Fundamentals course to learn about data roles and how to work with data.
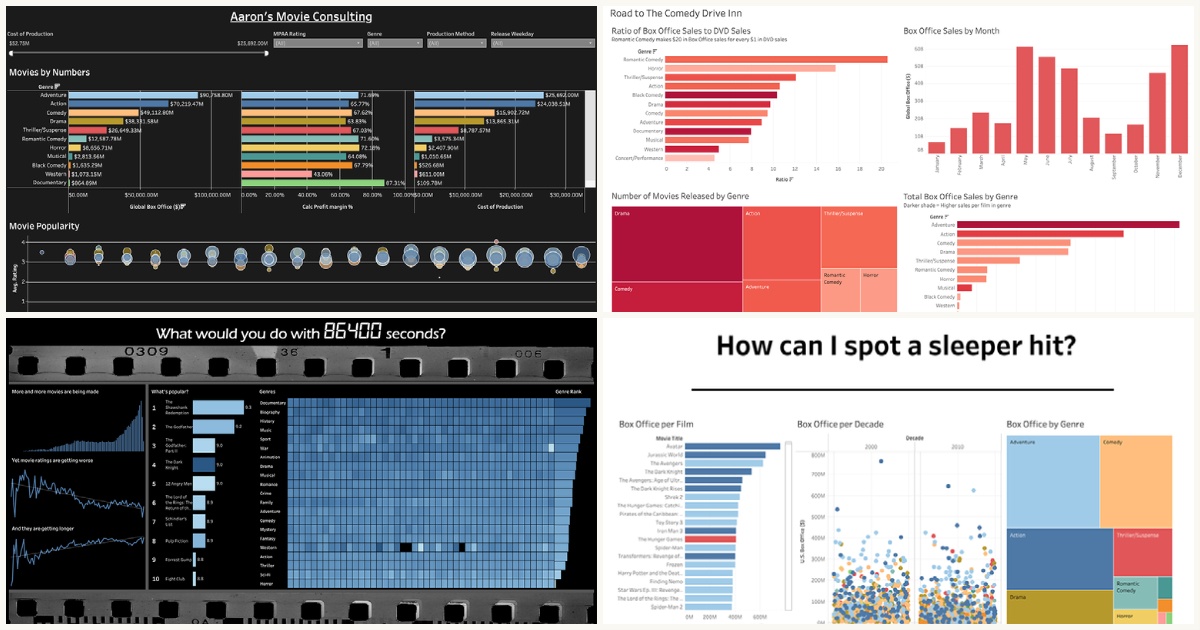
The team was then given an International Movie Database (IMDb) data set to create a viz, along with two mentors from Tableau for support. They participated in an Iron Viz-style viz off, showcasing their work to a panel of 4 executive judges: Tableau EMEA VP Dan Pell, Experian Product Director Sarah Robertson, The Information Lab Head Coach and Zen Master Carl Allchin, and former Tableau EMEA Senior Community Manager Louis Archer.
Each student began with a presentation about themselves and their journey to data literacy, including how their thoughts and opinions on working with data evolved during the project. They were scored on three key elements: overall delivery, storytelling with data, and dashboard design.
When the judge’s scores were counted, one student was crowned the Tableau winner: Marika, with her data visualization on what it takes to make a mega hit.
“One of the best projects” of the year
Judge Carl Allchin was thrilled with the competition, saying, "I loved seeing the passion and energy of the students talking about their use of data and their findings. Really fun approaches to the problem posed and I hope they keep that spirit going in their future careers. Fellow judge Louis Archer declared it, “one of the best projects I have been involved in all year.”
It’s not hard to see why. Each of the students took unique approaches to the data, presenting their takes in a beautifully informative data visualization:
- Aaron created his own consultancy to help production companies use data to inform decisions for future productions
- Riyaaz took a Dragon’s Den style approach and used the data to pitch his Comedy Drive Inn business idea
- Sadia shared she wasn’t really into movies, so if she were to spend time watching one she wants to make sure she picks a real winner!
- Marika used the data to find out what makes a mega hit, drilling down to find the best genre, director, and lead actor and actresses to make the most profitable film
The partnership with School 21’s Real World Learning Project demonstrated that Tableau is applicable to anybody and everybody, including data novices at the secondary school level. It also showed that interactive training and support from the Tableau Community provide a huge boost on the journey to data literacy. Tableau for Students (TFS) is enabling the next generation of data workers by supporting data skills education for all students to help them successfully prepare for the workplace.
You can start your data literacy journey, too! Students, apply for a license at www.tableau.com/students or join the Tableau Community and sign up for Tableau Public today!
Historias relacionadas
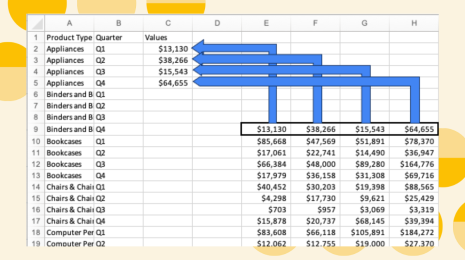
Learn the Basics of Well-Structured Data
 6 Diciembre, 2024
What is Iron Viz: Student Edition?
 27 Noviembre, 2024

Tableau for Teaching: Free access and resources to teach Tableau
 3 Noviembre, 2024