Now Available in 2024.1 Release: Tableau Pulse, Metrics Layer, Viz Navigation, and More


We’re excited to announce the 2024.1 release of Tableau and the general availability of Tableau Pulse. The latest version of Tableau empowers every employee in your organization with intelligent, personalized, and contextual insights delivered in the flow of work, enabling you to scale insights across the business with unified metrics, and maximizes your data potential with enhanced flexibility to streamline your data analytics journey.
Tableau Pulse
Tableau Pulse is now generally available! It’s a reimagined data experience that enhances the Tableau platform to make data-driven decisions easier than ever. Tableau Pulse helps everyone in your organization integrate data into their daily jobs with AI-driven insights and personalized metrics. Without having to learn a new tool or build comprehensive visualizations, Tableau Pulse helps you go beyond the how and what and shows you the why behind your data so you can drive business impact.
Tableau Pulse is included with all Tableau Cloud editions and Embedded Analytics solutions. It leverages generative AI to automate insight summaries in natural language, anticipate user questions and surface key metrics to make it easier for everyone to leverage insights everyday.
Tableau Pulse on Mobile
You can stay on top of your important metrics and understand how they are trending on-the-go. You can check your Tableau Pulse metrics on Tableau Mobile and get the same AI-powered insights that help you understand important changes to your metrics.
For a deeper analysis on mobile, you simply click on the Tableau Pulse metrics delivered in email and Slack digests, which will take you directly to the Tableau Mobile app insights exploration page.
With Tableau Pulse on Mobile everyone can access deeper insights with a single click no matter where you are. Tableau Pulse is available on Tableau Mobile iOS and Android.
Metrics Layer
Scale insights across your business with unified metrics. Tableau Pulse Metrics Layer helps you easily create standard metric definitions and enrich them with real-world business context. Tableau Pulse ensures that there is only one metric definition for a set of metadata—providing a single source of truth—that you can reuse to solve countless use cases and maintain consistency across your organization. Any changes that you need to make to the metric definition can be made once and will automatically apply to all Metrics related to that definition.
A metric layer incorporates the definition of what the data represents, including semantics such as whether an increase in the data is favorable. In Tableau Pulse, the Metrics Layer can understand the underlying business semantics associated with user queries. This, in turn, powers Tableau Pulse to answer better the what and why questions business users pose when asking for a specific metric.
Tableau available through AWS Marketplace
Streamline your data journey with Tableau Cloud on the AWS Marketplace. For the first time, Salesforce will begin offering its products, including Tableau Cloud and more on the AWS Marketplace. This expanded availability helps IT leaders simplify billing, streamline procurement, and have a comprehensive view of IT spending.
Additionally, you can maximize your data potential by utilizing the expanded data storage in Tableau Cloud. All Tableau Cloud sites get 1TB of data storage. Customers with the Enterprise license and Advanced Management get 5TB.

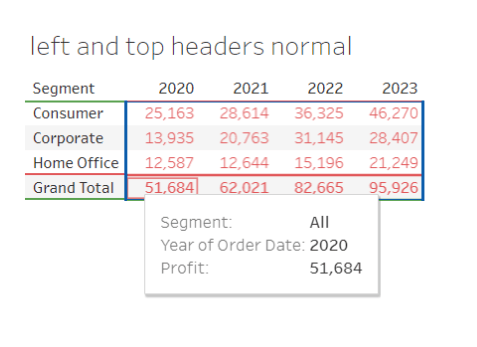
Viz Navigation for Text Tables
Explore, navigate, and interact with data visualizations, dashboards, and stories without relying on your mouse. Visualization Navigation, or Viz Navigation for Text Tables, introduces a new mode of data exploration that doesn’t rely on mouse interactivity. Straight from the Community Ideas Forum, you can now use keyboard navigation and assistive technology to navigate the marks of a text table. If you are using a screen reader, you will hear the information for each tooltip.
Viz Navigation for Text Tables gives authors a way to improve the accessibility of dashboards. For example, you can create a dashboard that has text tables as supplementary visualizations to more complex visualizations, enabling exploration of the data without needing to use the View Data experience.
Thank you, Tableau Community!
You inspire us to improve with every release. Thank you for your incredible commitment to Tableau and one another, solving the most complex of analytics challenges and expanding the boundaries of what is possible for a business intelligence platform. We would not be where we are today without your support, creativity, and feedback.
See your suggestions come to life by visiting the Ideas Forum to discover all the capabilities we’ve incorporated in Tableau. Upgrade to the latest version of Tableau to start using all of these powerful new features.
Historias relacionadas

Extend Access to Embedded Tableau Content with On-Demand Access
 22 Julio, 2026

The Tableau+ Bundle with Premium AI, Enterprise Capabilities, and Premier Success
 24 Junio, 2026

What is Tableau Prep?
 30 Abril, 2026