Iron Viz: Student Edition 2023: Top 3 Vizzes Investigating Global Education Trends


Iron Viz: Student Edition provides students with the opportunity to develop and display their data skills, connect with the broader DataFam, and practice for future Iron Viz competitions. Iron Viz: Student Edition cultivates the next generation of data rockstars.
This year’s competition tasked students to highlight the global impact of education on a given region’s demographics. Using the 2022 Iron Viz competition data, students brought the data to life and told a story in Tableau. Participants built data visualizations that were judged on their design, storytelling, and analysis by Tableau Community leaders and internal Tableau data experts.
We received incredible entries from students in different countries across the world and it was no easy task to narrow the competition pool down to 3 winners. Tableau extends a huge thank you and congratulations to all of the students who entered the competition—even participating is an accomplishment that we hope was challenging and rewarding.
Explore the 3 Finalist Student Visualizations
Conor Bolger, Technological University Dublin
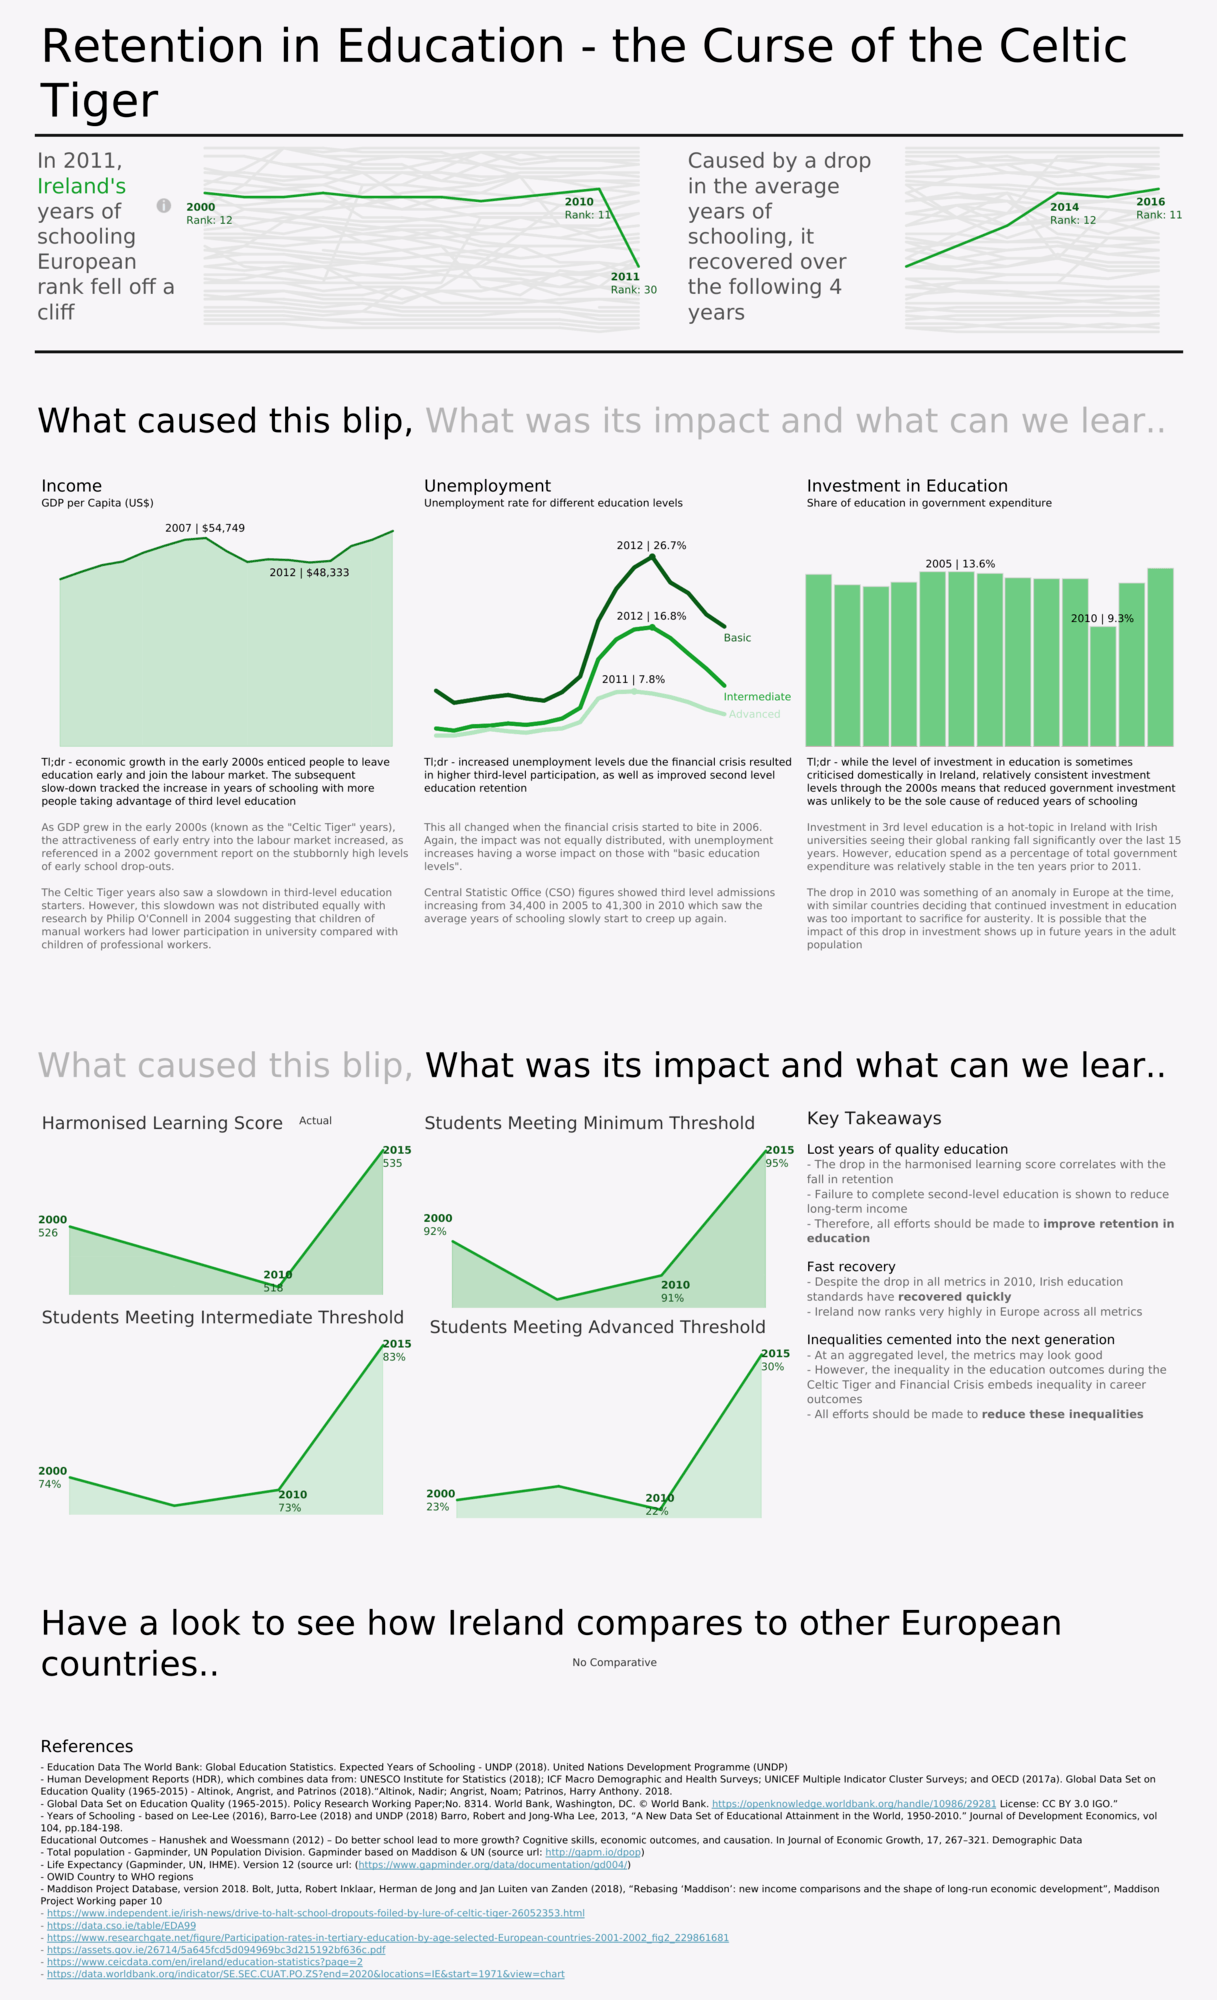
Retention in Education - the Curse of the Celtic Tiger in Ireland by Conor Bolger
Feedback from judges: “I found the green palette a solid choice for the overall viz, which ensured a cohesive user experience. The layout was easy to follow along with the story being told. Each chart was selected with clear intention… overall, a well-designed viz!”
Karolina Grodzinska, Northeastern University
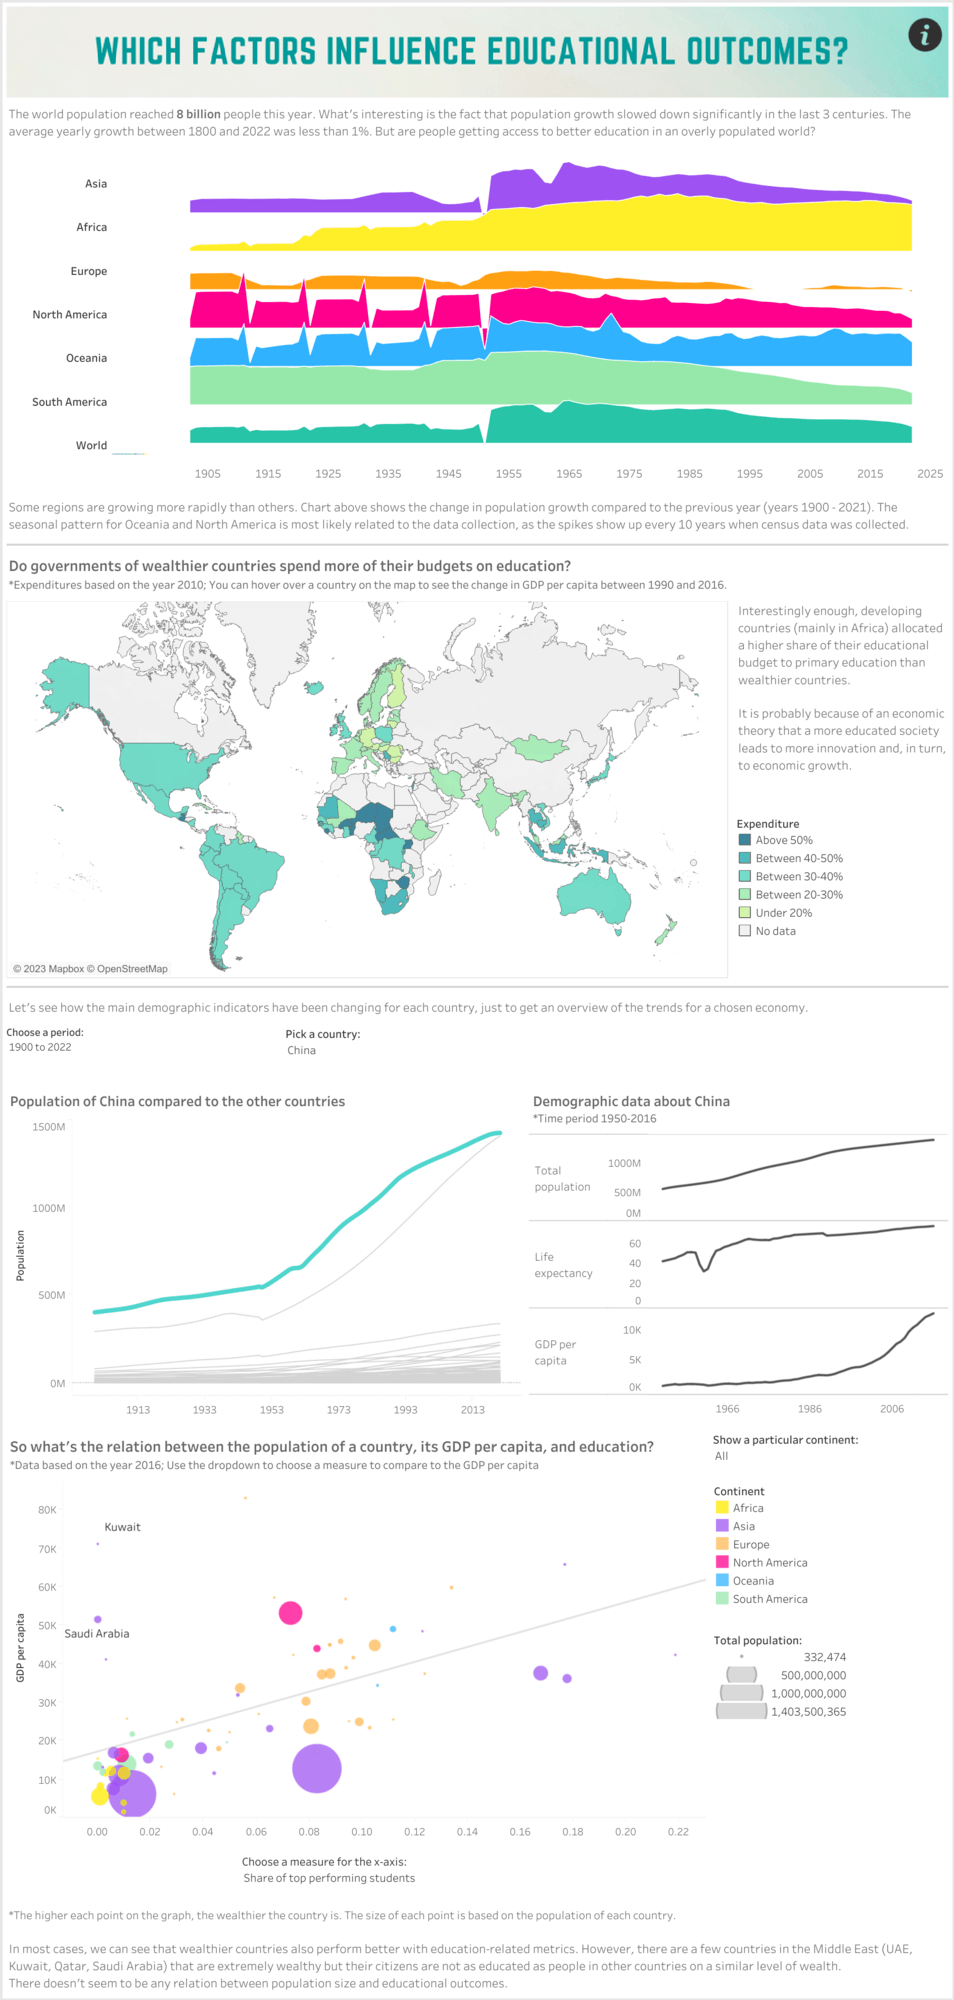
Which factors influence educational outcomes? Student #IronViz by Karolina Grodzinska
Feedback from judges: “I liked the use of the joy plot as the first chart, it was really eye catching from the get-go. There was intentional formatting done to help tidy up the charts. ”
Jenny (Hoang Van Linh) Nguyen, Monash University
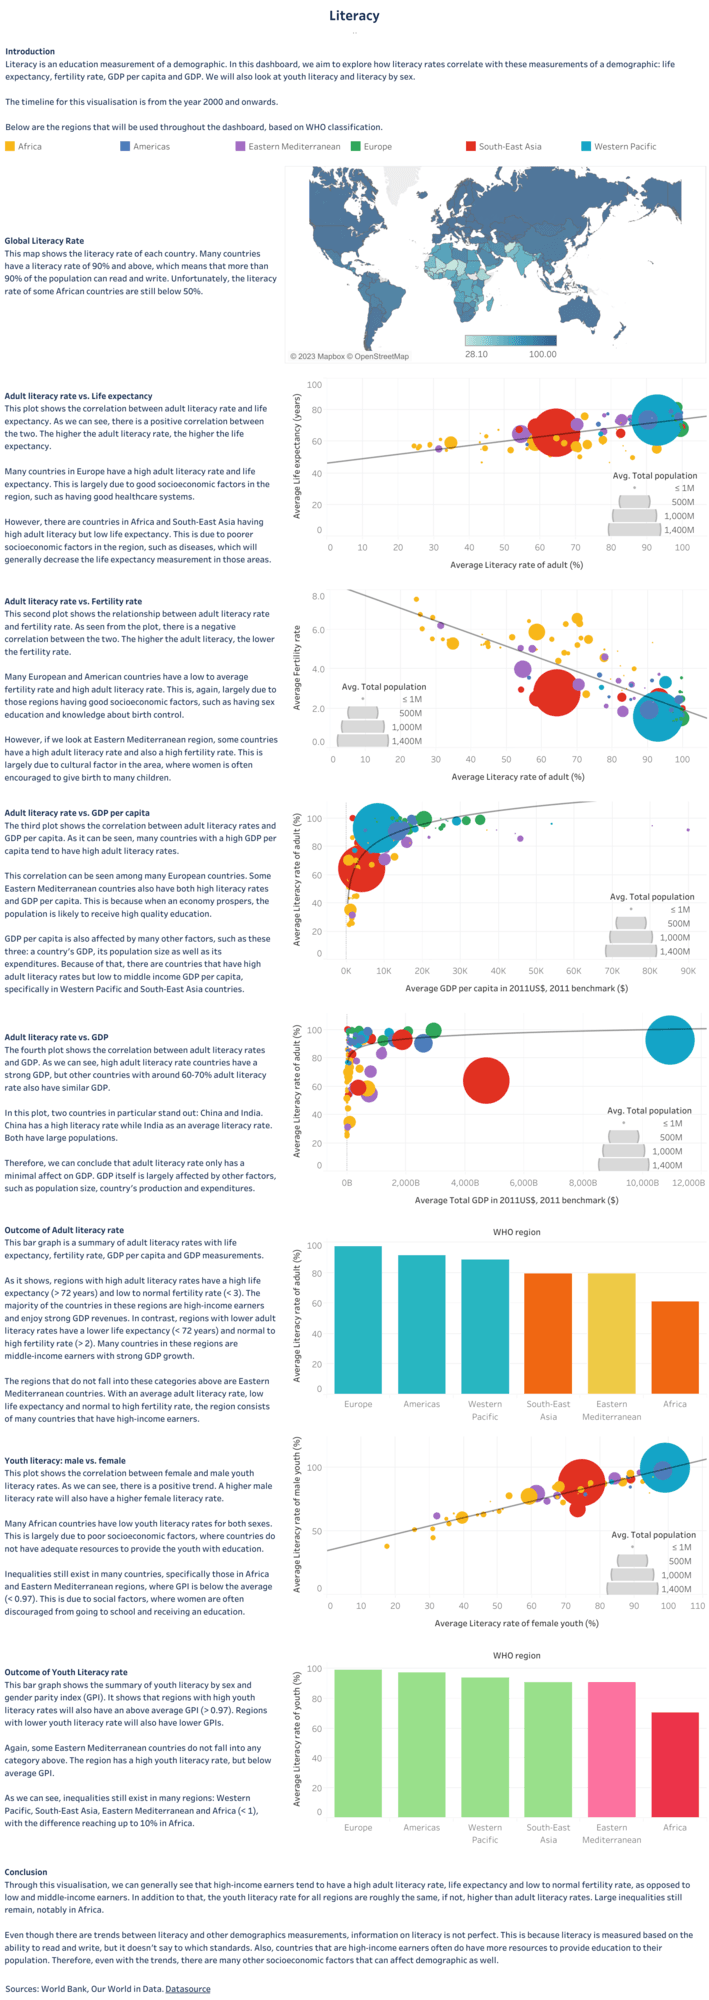
Literacy - #IronVizStudentEdition 2022 by Jenny Van Linh Nguyen
Feedback from judges: “Really enjoyed the depth of the analysis and the great use of Tableau's analytics capabilities such as the trend lines to demonstrate correlation.”
2023 Iron Viz: Student Edition Submission Gallery
We had many amazing viz submissions beyond just the winning 3! Get viz-inspired and learn more about global education by checking out some other of this year’s entries in the gallery below.
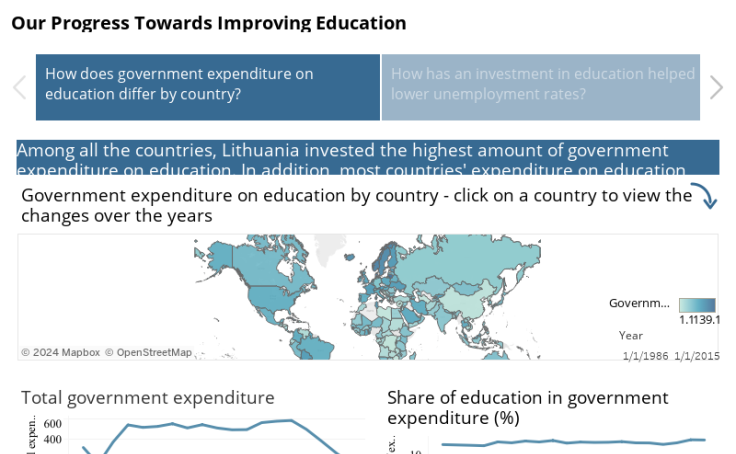
Our Progress Towards Improving Education

Tableau Student IronViz

African Literacy - Is Nigeria the giant?

education_demographics_tableau_complete

education_demographics_tableau_complete


Edu

The Impact of Education | Iron Viz: Student Edition 2022


Unemployment and learning outcomes among countries
Keep in touch for more on Iron Viz: Student Edition
Hear from our 2023 student winners at the Student X Community Tableau User Group webinar on February 22, 2023 at 10:00 AM PST. You’ll get to hear about how they built their viz, the story they told through the data, and advice to future Iron Viz: Student Edition contestants. Register now.
Thank you once again to all participants who submitted vizzes. Be on the lookout this upcoming winter for our 2024 Iron Viz: Student Edition! Until then, continue leveling up your skills by signing up for a free Tableau license through our Tableau for Students program.
Are you an instructor? Request new licenses so that you can jump right into teaching valuable data skills when the upcoming term starts.
Live now: Iron Viz 2023 Qualifiers and Finalists
The Iron Viz Qualifier Contest results are in, where contestants made vizzes about games, from tabletop to digital! You can now take a look at the top 15 vizzes spanning from across the world. 3 of these finalists will advance to the Iron Viz Championship at Tableau Conference 2023.
Historias relacionadas

DataFam Roundup June 2026

DataFam Roundup May 2026

Iron Viz 2026: Read Between the Data
 28 Mayo, 2026