Adding Speech Interaction to Tableau Gestures


At Tableau Conference 2023, the DataFam got a preview of Tableau Gestures, a new way to present data to remote colleagues and customers, one that overlays interactive data visualizations over webcam video. Instead of screen-sharing and hoping that the audience follows along, Tableau Gestures allows presenters to point directly at parts of their vizzes to highlight and annotate them. In case you missed the show-stopper of a demo, be sure to check out the Tableau Conference opening keynote on Salesforce+. You can also watch Iron Viz host and Tableau evangelist Andy Cotgreave demo Tableau Gestures. Since these demos, we’ve taken Tableau Gestures further by adding speech interaction.
When someone uses hand gestures while speaking, these are known as co-speech gestures. These gestures are particularly useful when using a visual aid (like a viz) to direct attention: for example, pointing gives context to words like “this”, “that”, or “those”, which could refer to marks or values in a viz. With Tableau Gestures, we use computer vision to take advantage of this connection between a speaker’s gesture and a viz to highlight, draw reference lines, and annotate marks with helpful labels that draw the audience’s attention.
Highlighting and annotating are not the only things that need to do be done when presenting data. Often the data in a viz needs to be filtered, aggregated, disaggregated, or sorted. Certainly, some of these decisions can be anticipated for a scripted presentation, and the appropriate vizzes can be constructed in advance. However, whether in the flow of an improvised presentation or in response to detail-oriented questions from audience members, presenters cannot rely solely on preconstructed vizzes. Unfortunately, there does not exist an obvious set of hand gestures for filtering, sorting, or otherwise transforming vizzes; even if such a set of gestures existed, they might require more preparation and concentration, they might be distracting to audiences, and they might interfere with gestures used by different cultural groups.
In response, my Tableau Research colleague Arjun Srinivsasan and I considered using the modality of speech to transform a viz while retaining the existing benefits of gestural interaction. We modified the Tableau Gestures application to additionally listen to voice input, and we demonstrated the results in recent video. We also described our approach in a paper that Arjun presented at the MERCADO workshop, a half-day event held at the IEEE VIS 2023 conference in Melbourne, Australia, the preeminent forum for visualization research. The workshop was devoted to the topic of Multimodal Experiences for Remote Communication Around Data Online, making it the perfect venue to demonstrate our idea and solicit feedback from experts from both academia and industry working in this burgeoning area of research.
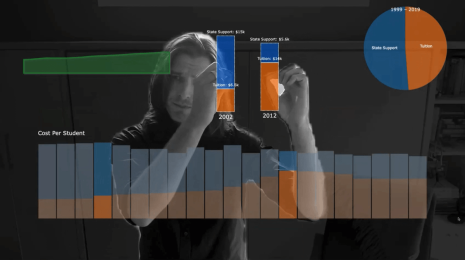
Our three-minute demonstration presentation (illustrated in the annotated photo montage and in the video) illustrates a scenario that combines speech and gesture interaction. This presentation centers around a dataset of about 500 American colleges containing both categorical dimensions (e.g., Region, Type) and quantitative measures (e.g., SAT Average, Average Cost).
To initially orient audiences to the data, the presenter begins by showing a pre-specified unit column chart, where each college appears as one mark and is grouped according to its geographic region. In explaining the distribution of colleges, the presenter points their finger at different columns, highlighting the number of colleges in each region.
Next, the presenter indicates that the Mid-Atlantic and Southeast regions have the most number of colleges, and he presses a button on his remote clicker (or a key on his keyboard) to trigger voice input while continuing his monologue, stating that “we can see that Southeast and Mid Atlantic have a higher number of schools than the other regions, so let’s go ahead and drill down into the Mid Atlantic and Southeast regions to learn more about the schools here.” After uttering this, colleges from regions aside from Mid-Atlantic and Southeast are removed from the viz.
Moving on to focus on the differences between college types, the presenter states “I’m a little curious to see what the distribution of different school types in these densely populated regions is, so to do that, maybe what we can do is color these points based on the school type that they have.” Following this utterance, the initially white marks turn orange or blue depending on if they represent Public or Private colleges, respectively. Highlighting the associated college types by pointing at the color legend, the presenter then draws attention to the fact that there are more Private schools than Public schools in the two regions.
Delving deeper into the two shortlisted regions, the presenter then moves on to focus on the competitiveness of colleges using the Admission Rate attribute as a measure for the same. Narrowing down to schools that have low admissions rates, the presenter says “… let’s go ahead and focus on schools that have an admission rate of less than 25%.” Pointing at the highlighted colleges, the presenter calls out that there are only three public schools with such competitive admission rates, whereas there are sixteen private schools. Discussing if the type of area a college is located in could lead to more insight, the presenter then says “…to see that, let’s update this layout to group schools based on the locale that they belong to.” This results in the view changing to a new unit column chart with colleges being spatially grouped by their locale type (e.g., Large City, Small Suburb).
To summarize, throughout this presentation, the presenter uses gestures to highlight and annotate (groups of) marks in the viz along with speech utterances that transform the viz via filtering, aggregation, re-coloring, and sorting. Important to note is that this presentation only required specifying a single viz in advance; all of the transformations to the viz were performed on the fly.
What’s Next?
We’re continuing to demonstrate Tableau Gestures and collect feedback from customers. We aren’t yet sure if speech interaction will continue to be part of its development; it will undoubtedly require further research, prototyping, and focused feedback from customers. For instance, we don’t want to rely on a keyboard hotkey or remote clicker to trigger speech capture, but we also want to limit unintended transformations to the viz. When (not if) these unintended transformations take place, we need to make sure that they can be easily undone or recovered from without significantly disrupting a presenter’s delivery. We also need to better understand how this speech interaction flows in the context of (or inhibits) natural-sounding speech. It is one matter to utter a terse imperative to a computer when no one is listening, but these utterances might seem unnatural to audiences watching someone give a presentation. Finally, we’re curious as to what else we can achieve with multimodal interaction in the context of augmented reality video presentations, such as whether the combination of speech and gesture could be used to create new vizzes on the fly, provided a data source is available.
Tableau Research is currently recruiting research interns for summer 2024 to work on this topic, as well as for other projects currently being incubated. If you are a current PhD student enrolled at a North American post-secondary institution performing research in this area, please apply on Workday. You can also learn more about our team and the research that we do at research.tableau.com.
About the Author
Matthew Brehmer is a human-computer interaction (HCI) researcher specializing in data visualization. As a lead research staff member of Tableau Research in Seattle, he designs, implements, and evaluates new interactive experiences for communicating and collaborating around data. Before joining Tableau, he was a postdoctoral researcher at Microsoft Research, which followed his PhD at the University of British Columbia. Learn more about his work at tableau.com./research and connect with him online at @mattbrehmer or on LinkedIn at linkedin.com/in/matthewbrehmer.
Historias relacionadas
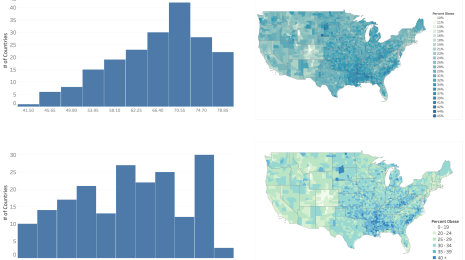
OSCAR: Creating More Meaningful Bin Breaks
 9 Diciembre, 2022
Using Augmented Reality for Touchless Interaction with Visualizations
 12 Octubre, 2022