Best of the Tableau Web: Celebrating 6th year anniversary and TC18
This month’s Best of the Tableau Web marks the 6th anniversary of these round ups. Dive into awesome TC18 roundups and the best of the rest.


Wow. This month’s Best of the Tableau Web marks the 6th anniversary of these round ups. Thank you to everyone who has inspired me with ingenious and inspiring content every month for so many years. In 2019, we’ll be looking to refresh the format, so start thinking about what you want to get out of these monthly round ups.
And what a month October was. I don’t remember a month with so much activity. The month was dominated by two distinct categories: TC18 and best of the rest. There’s lot of great content this month, so grab a coffee, and get clicking.
Meeting the inspiring community at TC18
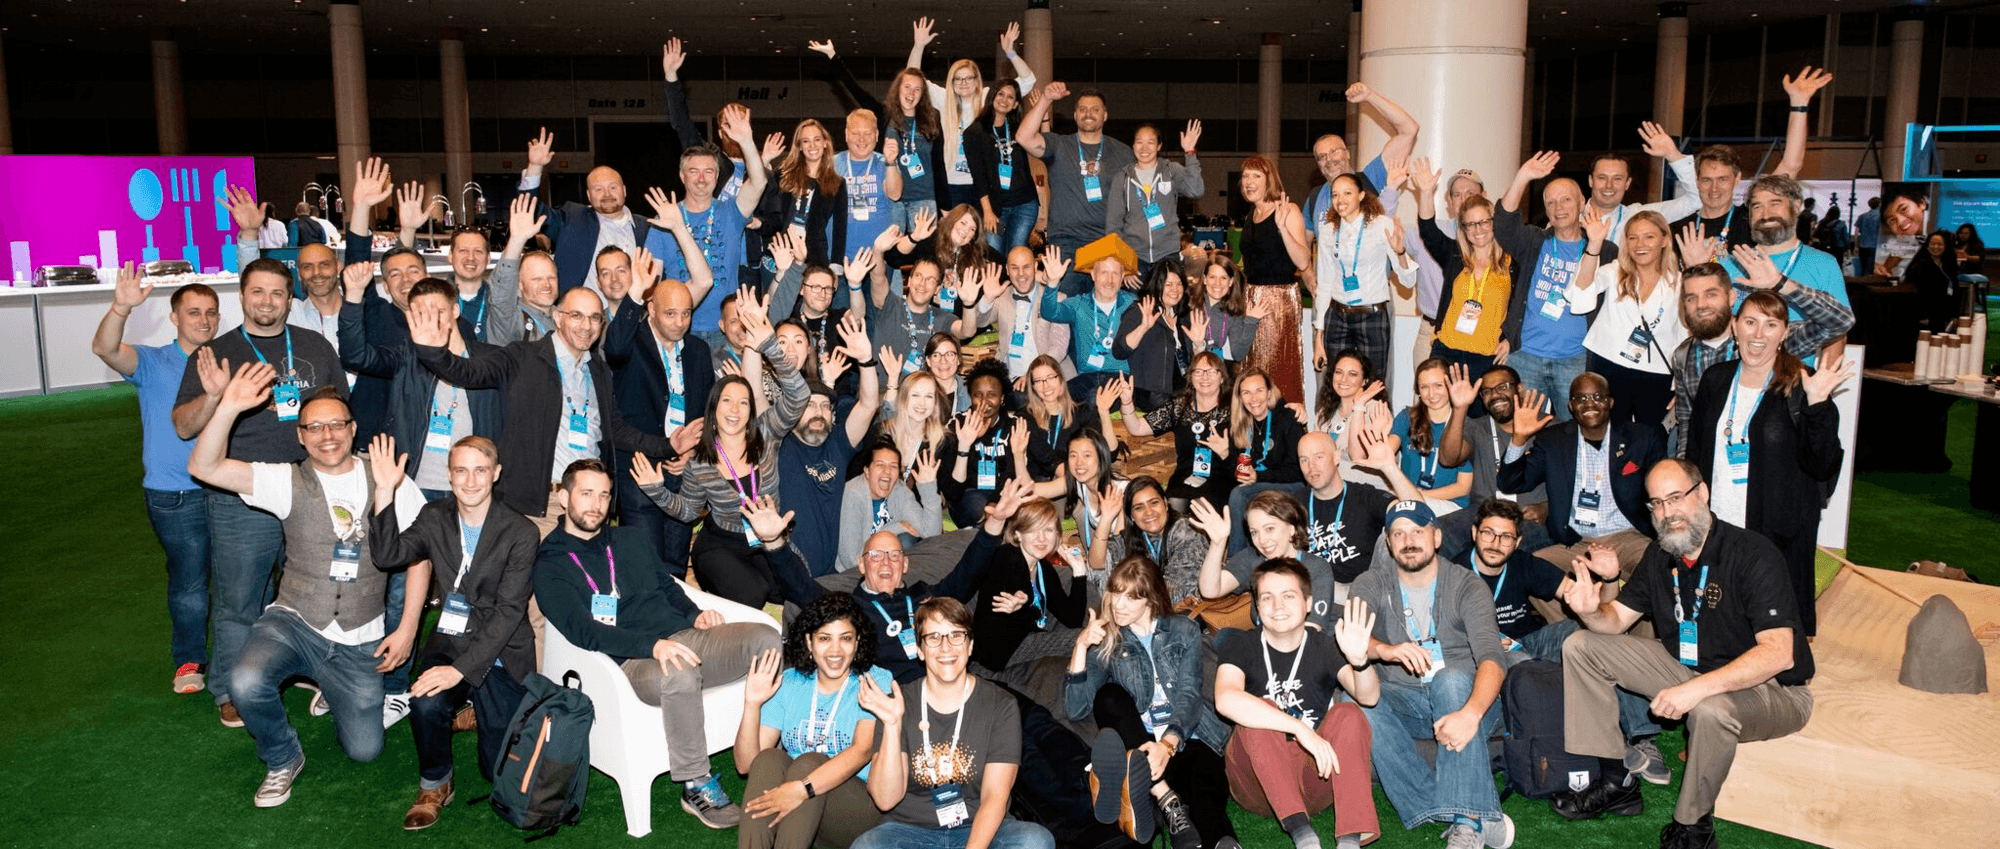
I’ve broken out a special section this month regarding posts inspired by Tableau Conference. To all the people who started a new blog following TC, welcome aboard, and I can’t wait to see what ideas you share with everyone.
These posts capture the inspiration people feel when they meet other data geeks who share their passion. I love seeing that inspiration turned into great content for others to read. Vince Baumel’s post captures all the right reasons I think people should share their thoughts: however big or small, your ideas are of value to others.
I also must call out Lindsay Betzandahl’s poem—as fitting an ode to a creative community as you could imagine.
Quantum Relic You are Not the Failures of Your Past
Lindsey Poulter My Data Viz Journey
MY DATA MUSINGS Tableau Conference recap
Curvediscussion Men(tor|tee)s in the Tableau Community
Viz Zen Data Reflecting on New Charts
Sarah Loves Data Thanks for the inspiration, #TC18
Sons of Hierarchies TC18 ~ Big Easy, Big Inspiration
Pixel Mixer ONLY CONNECT
The Data Duo @TheDataDuo #TC18 Recap
My Data Blog 5 Experiences from the Tableau Conference
Questions in Dataviz What are my follow-up actions from #TC18?
mikevizneros Why Do We Race? (TC18 Director's Cut #3)
Ready, Set, Data! The Beginning
Evolytics How to Learn Tableau
Steve Prokopiou's Blog Tableau Conference – It’s Not Normal
The best of the rest
And of course, people have been busy blogging about all the other regular topics: Tableau Server; Dashboard Extensions; and of course, ideas to build beautiful visualizations. I really like Ann Jackson’s solution for dynamic quantiles in maps, as well Ellen Blackburn’s simple-but-powerful tips on using custom number formatting.
Tips and tricks
Ellen Blackburn Number Formatting: Adding +/- to your values
Canonicalized StreamGraphs in Tableau via R
Ellie Mason Order of Operations // Sorting within a filter
Harry Cooney Tableau: How to Swap Sheets in a Dashboard
Ken Flerlage Quick Tip: Downgrade Your Tableau Workbook
JACKSON TWO Dynamic Quantile Map Coloring in Tableau Desktop
Inspiration
VizChic To Tableau, With Love
La Dataviz Discover, Learn, Compete, and Share - My Tableau Journey
Jedi
RosarioViz Top & Bottom Highlights
Alexandra Hanna Differential Pricing Using Table Calculations
Nick Jastrzebski Creating Control Charts for Non-Statisticians
Ryan Sleeper How to Normalize Current and Prior Dates on the Same Axis in Tableau
VIZJOCKEY Creating Data-Driven Scoring-Models
Nicholas Bowskill Your Year in a Radial Graph
Server
Brandi Beals Tableau Server Administration & Governance
The Data Duo Embed a Gateway Dashboard on Salesforce
Ravi Mistry Introducing Project Griffon
Code
Tableau and Behold! Keeping Web Edit Content Private
Andre De Vries Build your first Tableau Dashboard Extension
Related stories

Apply or Nominate to Become a Tableau Visionary
 18 December, 2025

Explore the 2026 Iron Viz Entries
 15 December, 2025