Tableau Next:問答校正
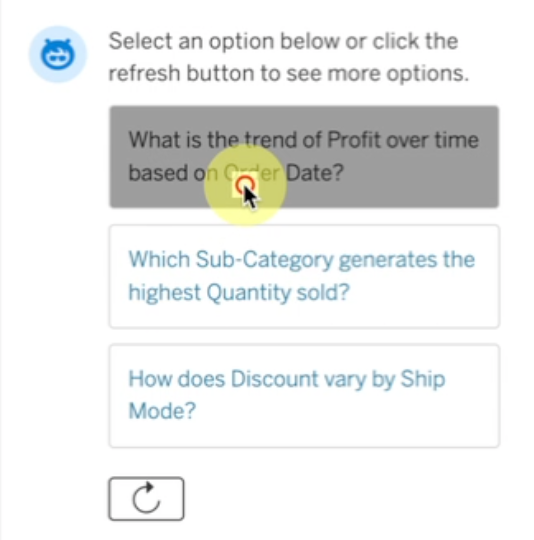
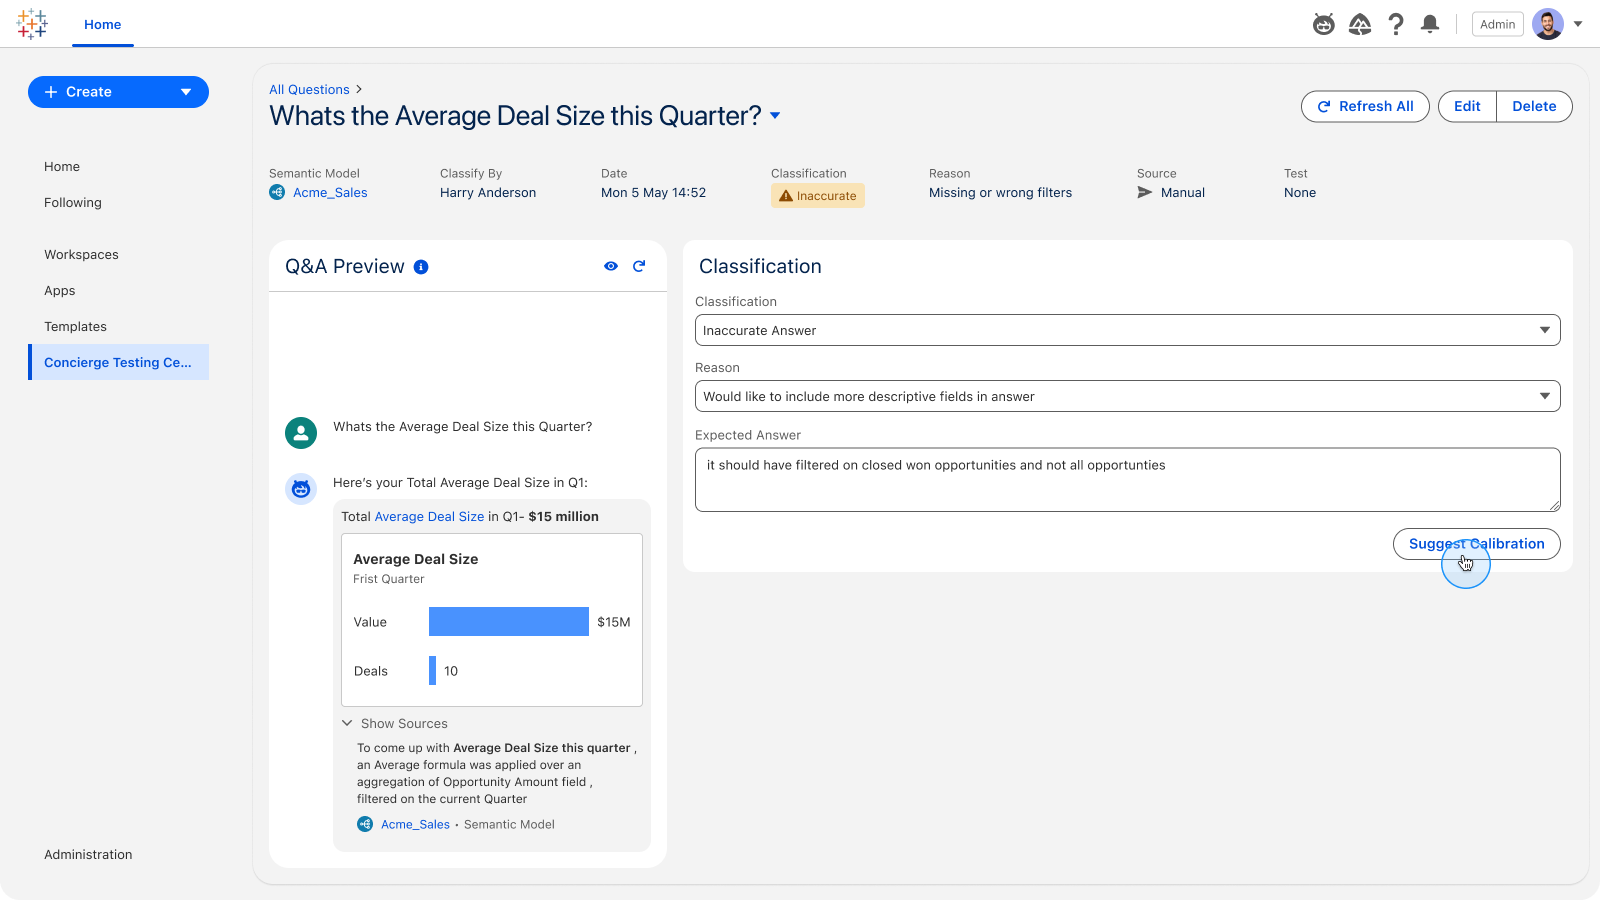
使用問答校正,提升代理對分析問題的準確度。測驗回應,評估其準確度,並應用引導式建議答案,藉此提高代理的回應準確度。目前提供測試版。
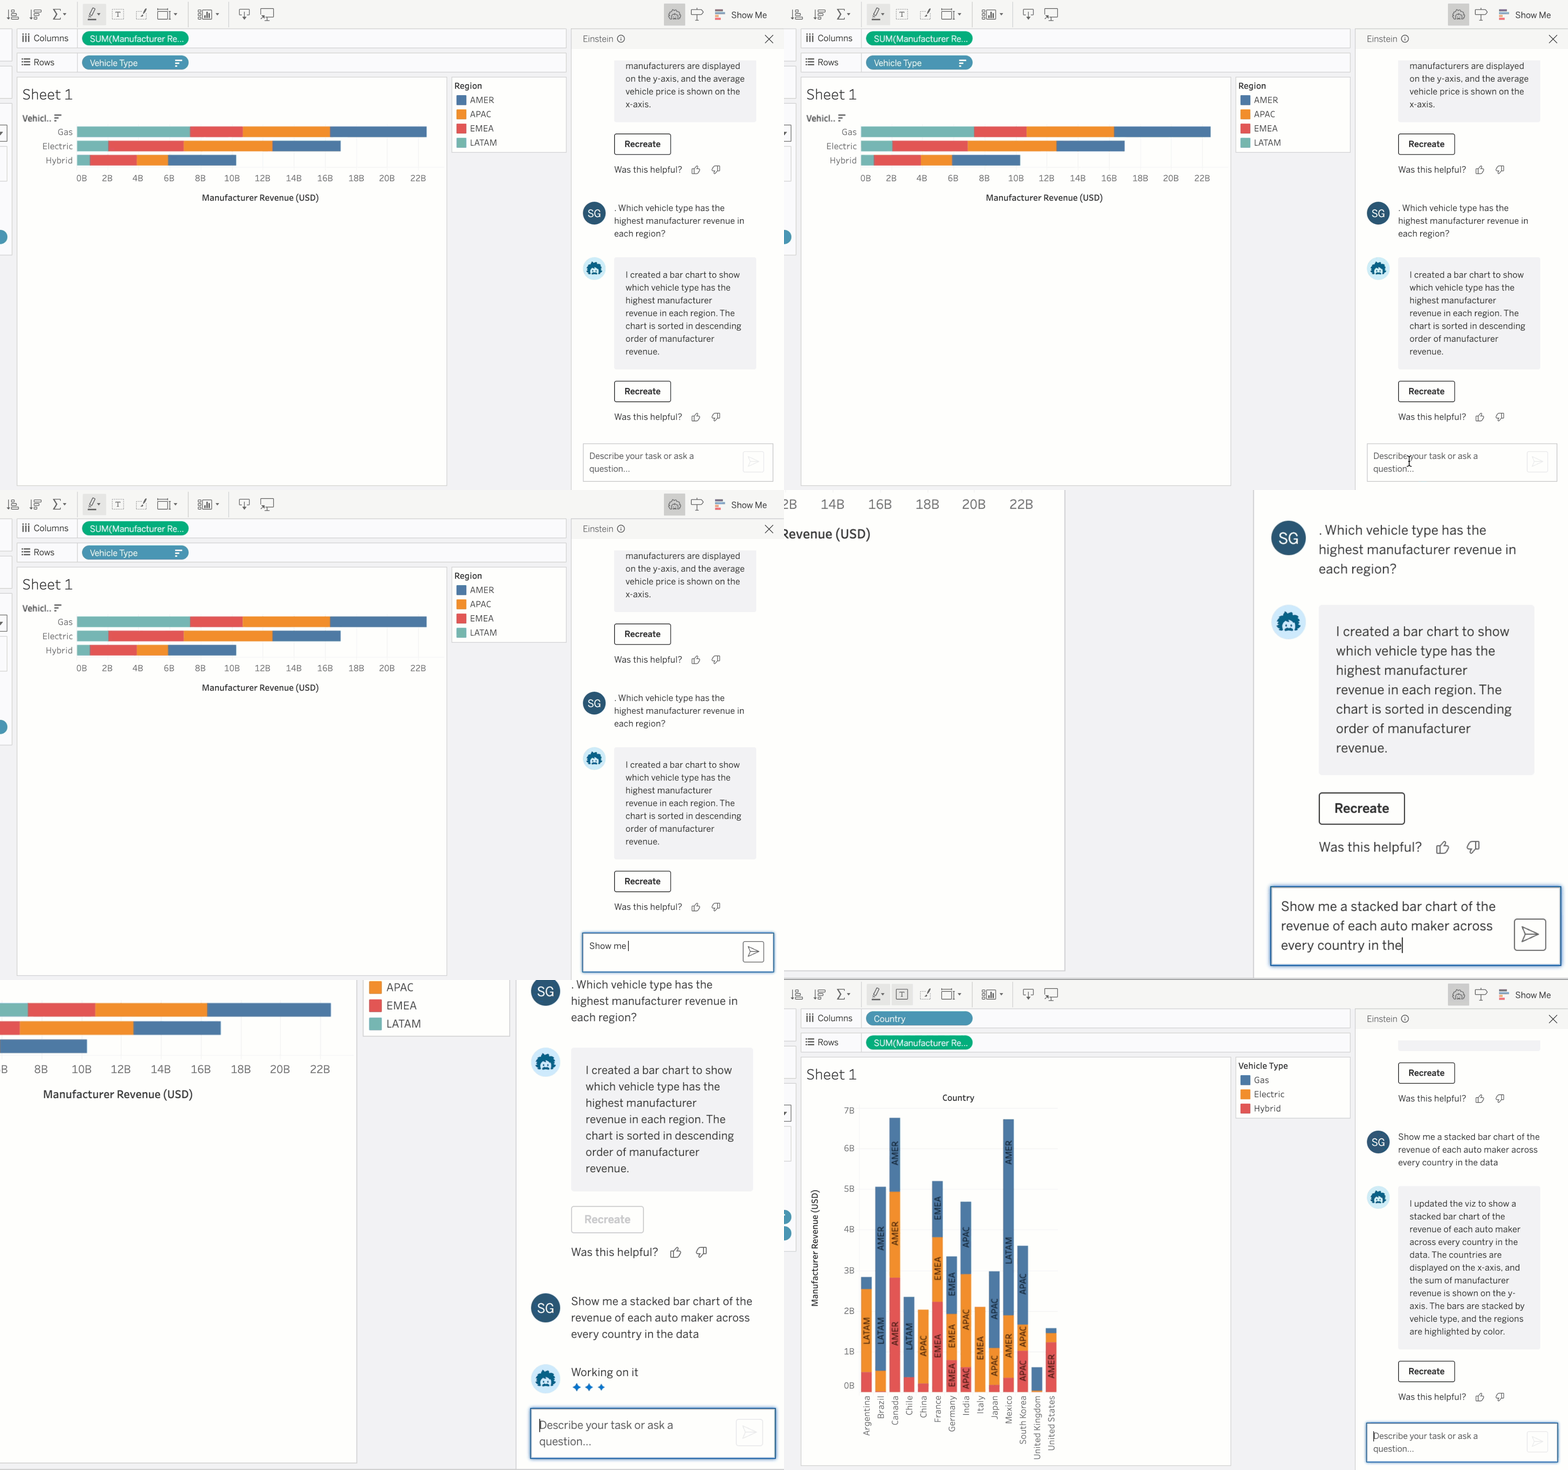
Tableau Server 中的 Tableau Agent
使用 Tableau Agent(您的 AI 助理)協作,在 Tableau Server 上更快取得見解。使用自然語言獲得分析各個階段的支援 — 從資料準備到探索和視覺化。Tableau Server 中的 Tableau Agent 支援 Tableau Prep 和 Web 製作功能。若要使用此功能,只需要在 Web Authoring 或 Desktop 中啟動 Tableau Agent 之前,使用 API 金鑰連接您自己的 OpenAI 模型(2025.3 僅支援 OpenAI)。一般在 Tableau Server 版本中提供。
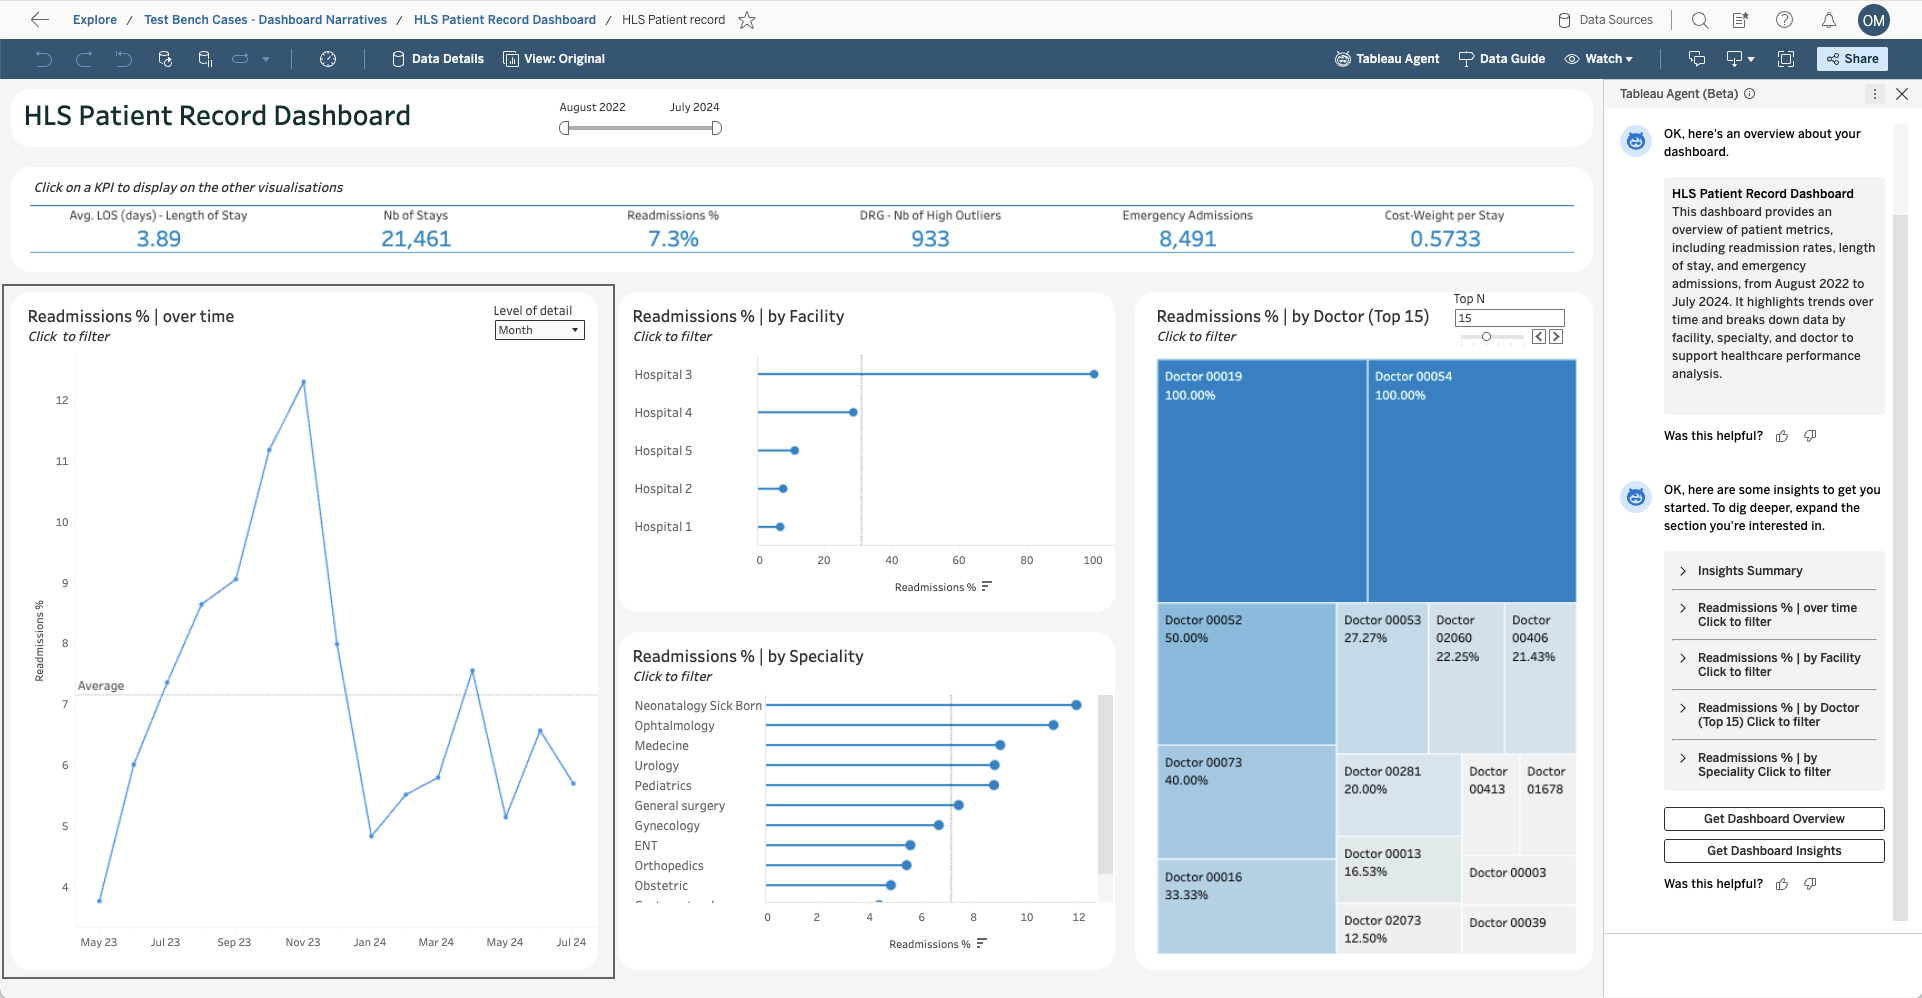
Tableau Agent:儀表板敘述
藉由 AI 驅動的直覺式解釋,輕鬆進行資料探索。Tableau Agent 提供儀表板敘述,提供簡潔的概述,協助您評估與問題的相關性。隨著您深入探索儀表板,Tableau Agent 會為每個視覺效果產生情境見解,藉以突顯有意義的趨勢。Tableau Cloud 和 Desktop 即將推出 Beta 版。
平台資料 API
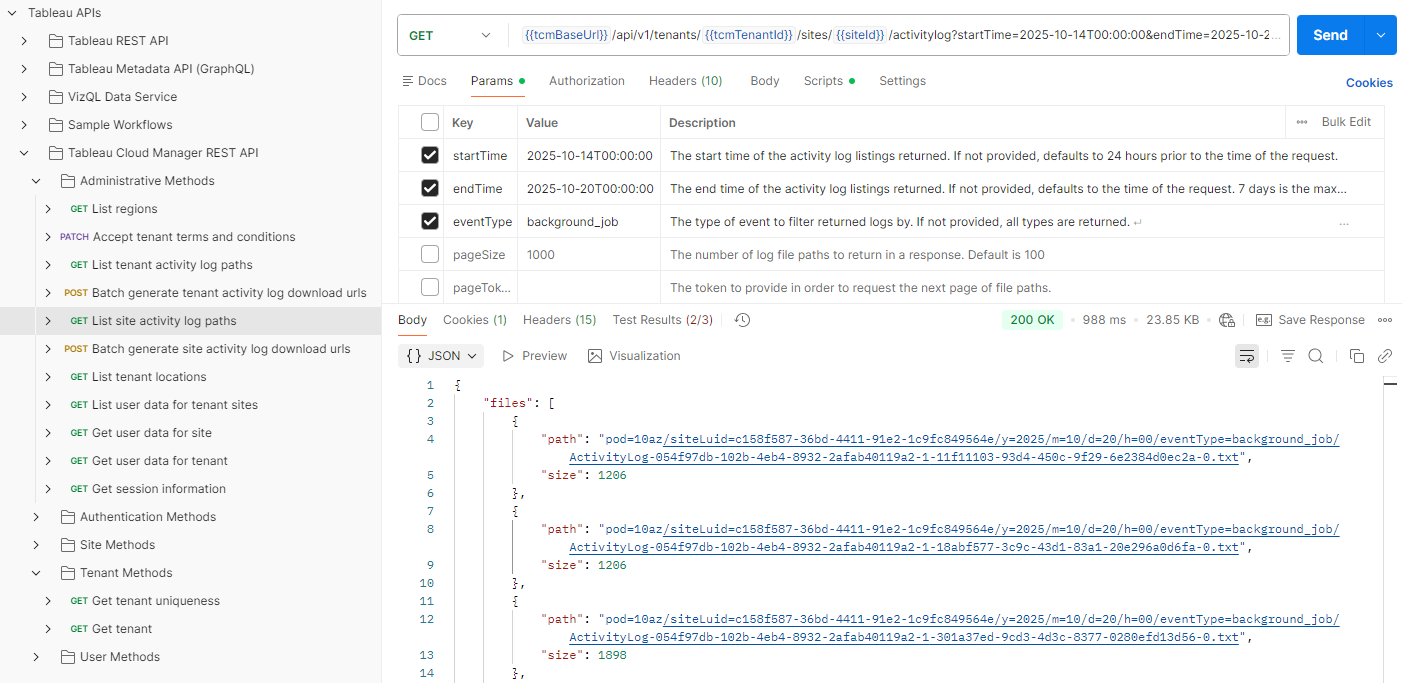
不需要整合 AWS S3,即可透過程式設計方式存取 Tableau Cloud 活動和事件資料。使用新的 API 擷取統一的事件日誌,以便在您自己的資料倉儲中進行自訂監控、SIEM 資料擷取或分析。Tableau Cloud 現已正式推出。
附註:近乎即時的日誌記錄和 S3 整合功能僅在 Tableau Enterprise 或 Tableau+ 套組中提供。

讓內部專家為您介紹 Tableau 版本
加入 DataFam Discovery 使用者群組,讓 Tableau 產品經理為您介紹我們發佈的新功能。
立即加入
所有功能
2025.3
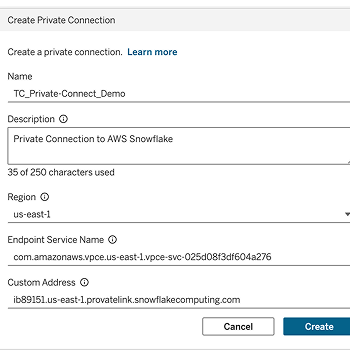
私人連線:更多連接器
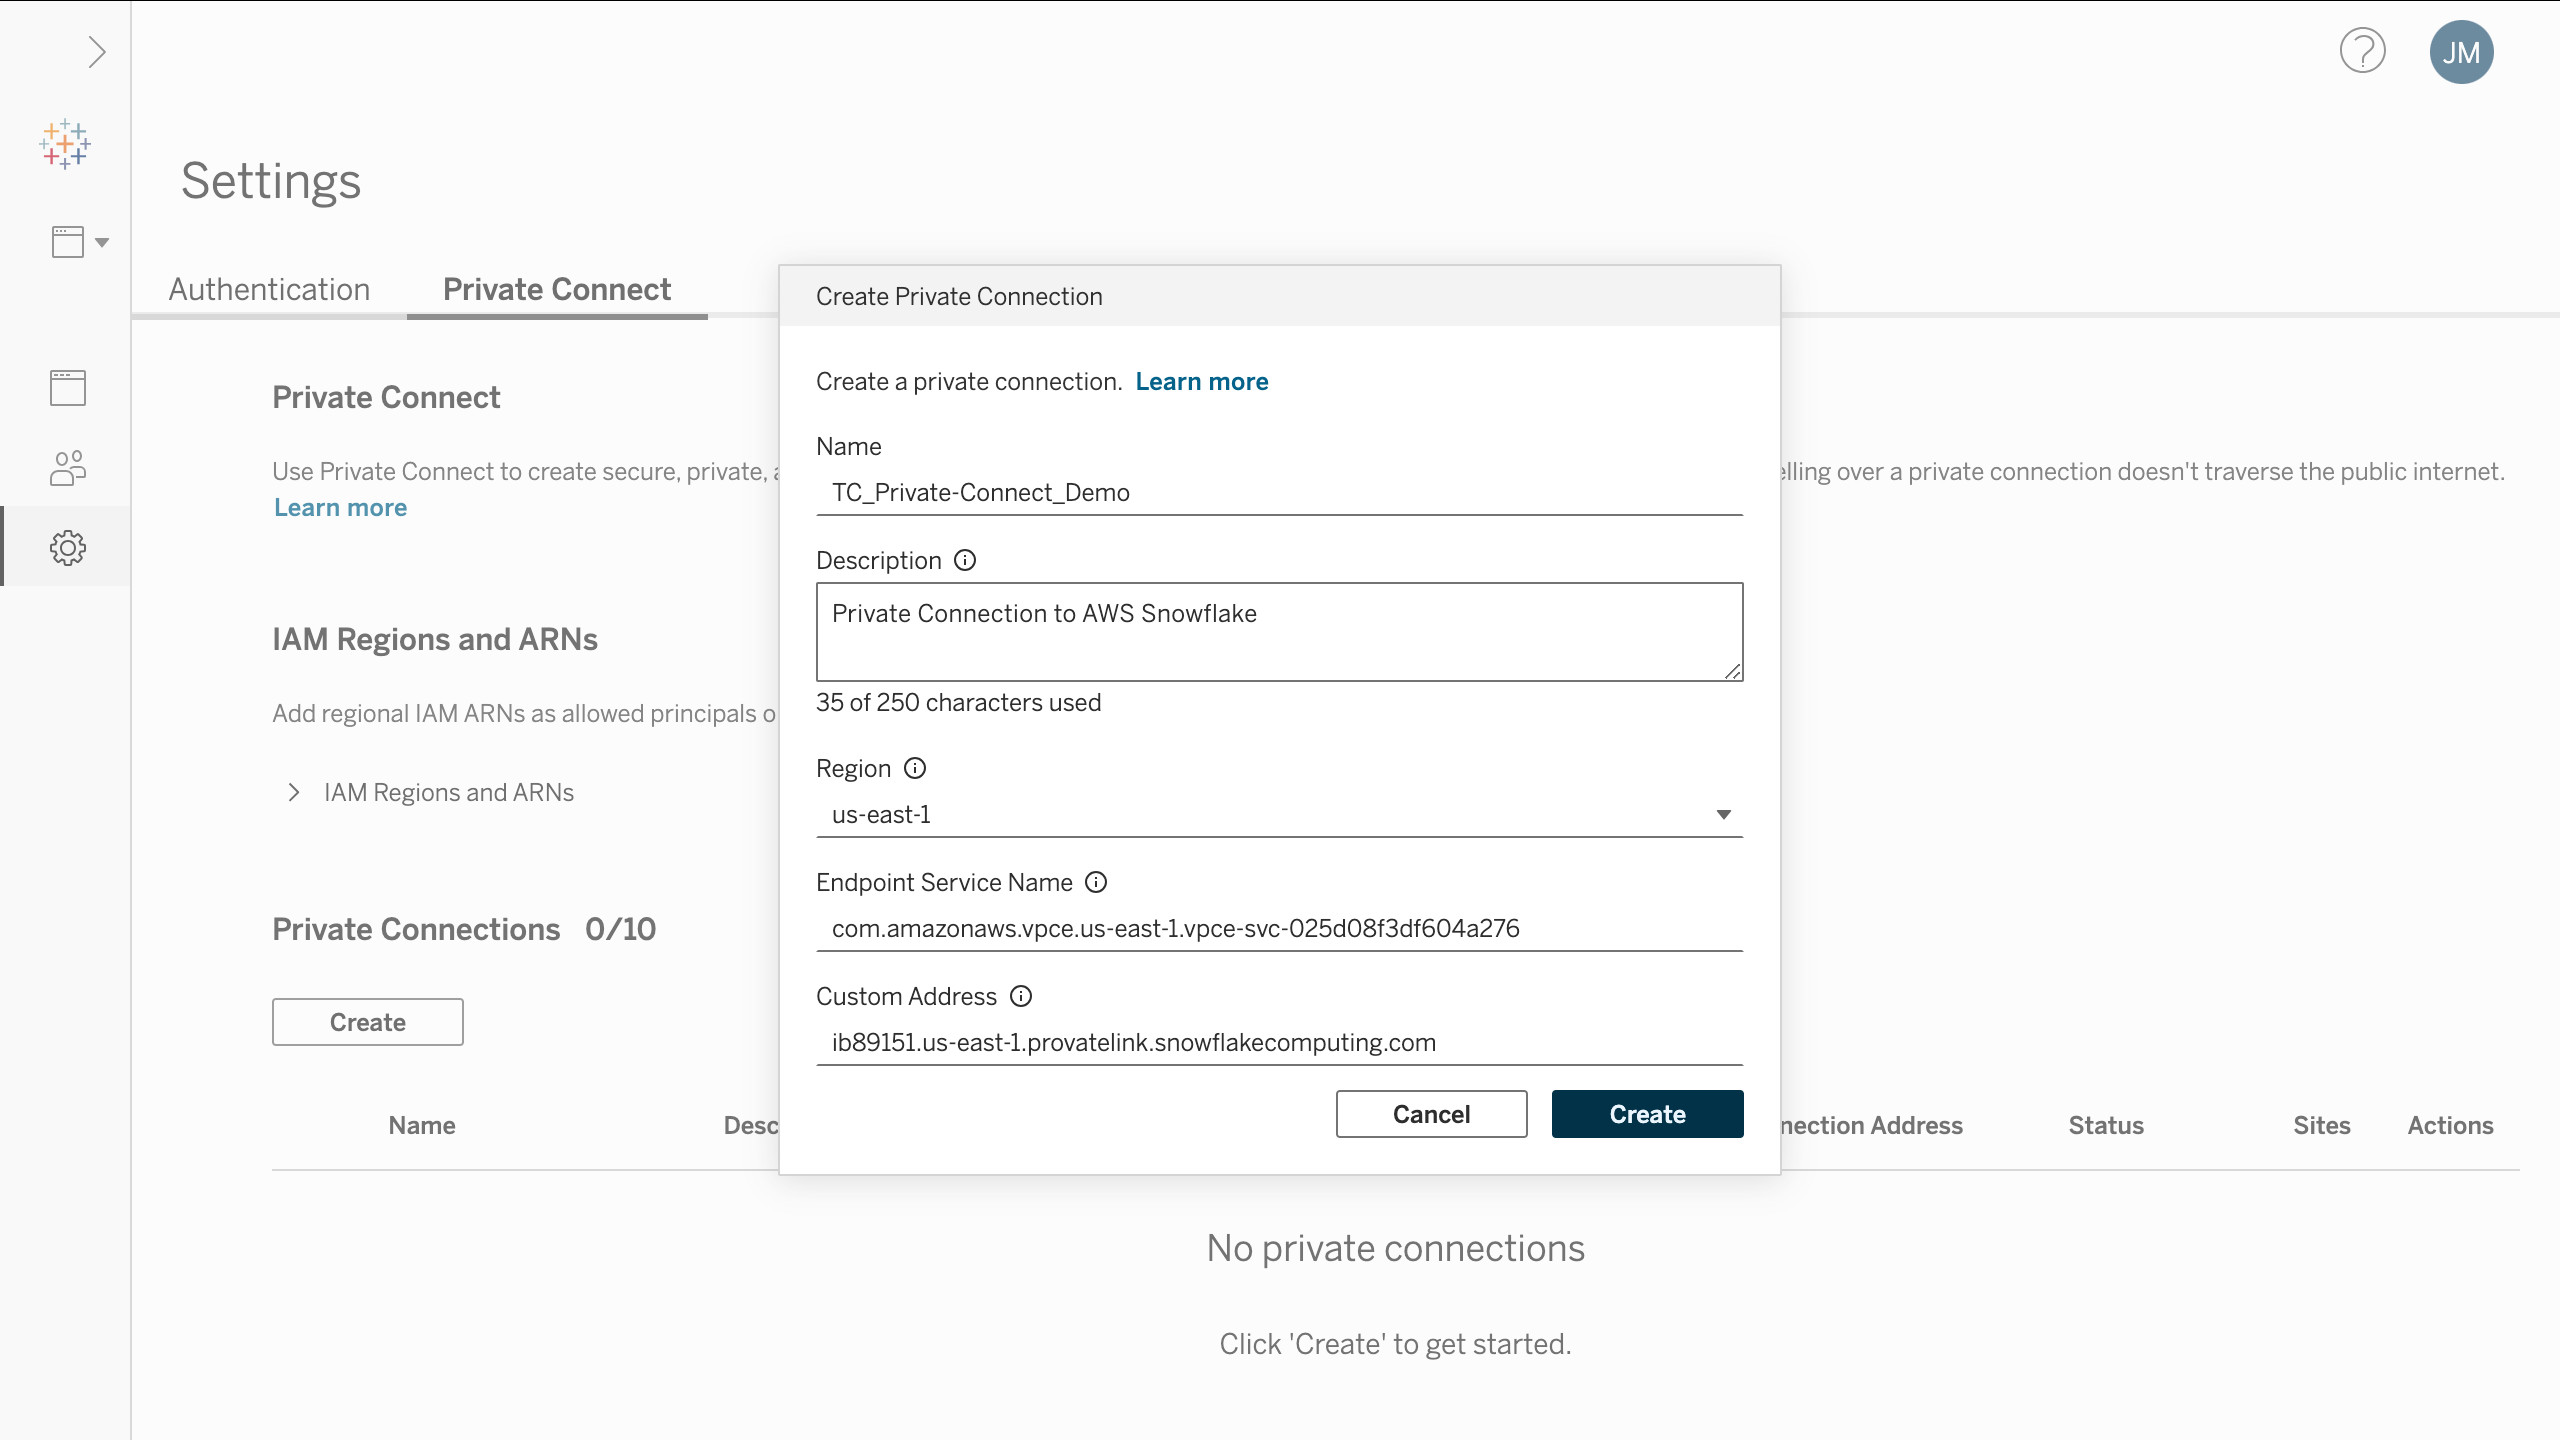
不使用公開網際網路,透過私人連線連至資料,安全更有保障。Tableau Cloud 客戶現在可使用 AWS Private Link,將託管在 AWS 的資料庫(例如 PGSQL、MySQL、MSSQL、OracleDB 及 Aurora)連至 Tableau Cloud。AWS Private Link 提供專屬的安全私人連線,避免資料在公開網際網路上曝光。
此外,私人連線功能也可跨區域連接 Redshift、PGSQL、MySQL、MSSQL、OracleDB 及 Aurora。支援虛擬連線。
自訂網域
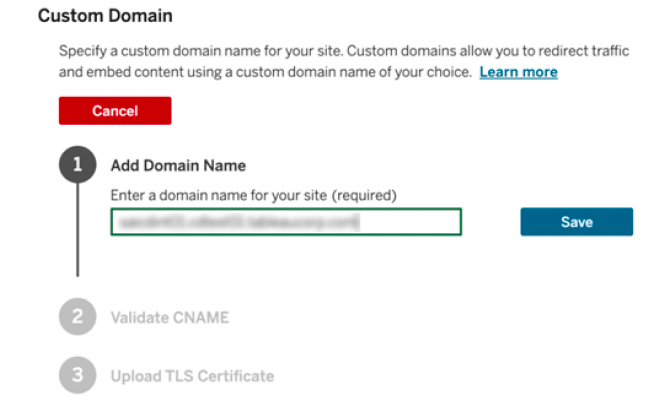
透過為您的 Tableau Cloud 站台建立自訂網域名稱,為您的使用者提供品牌化且無縫的體驗。在嵌入式情境中消除對第三方 Cookie 的需求,並為使用者提供簡單易記的 URL 存取其分析資料。
平台資料 API
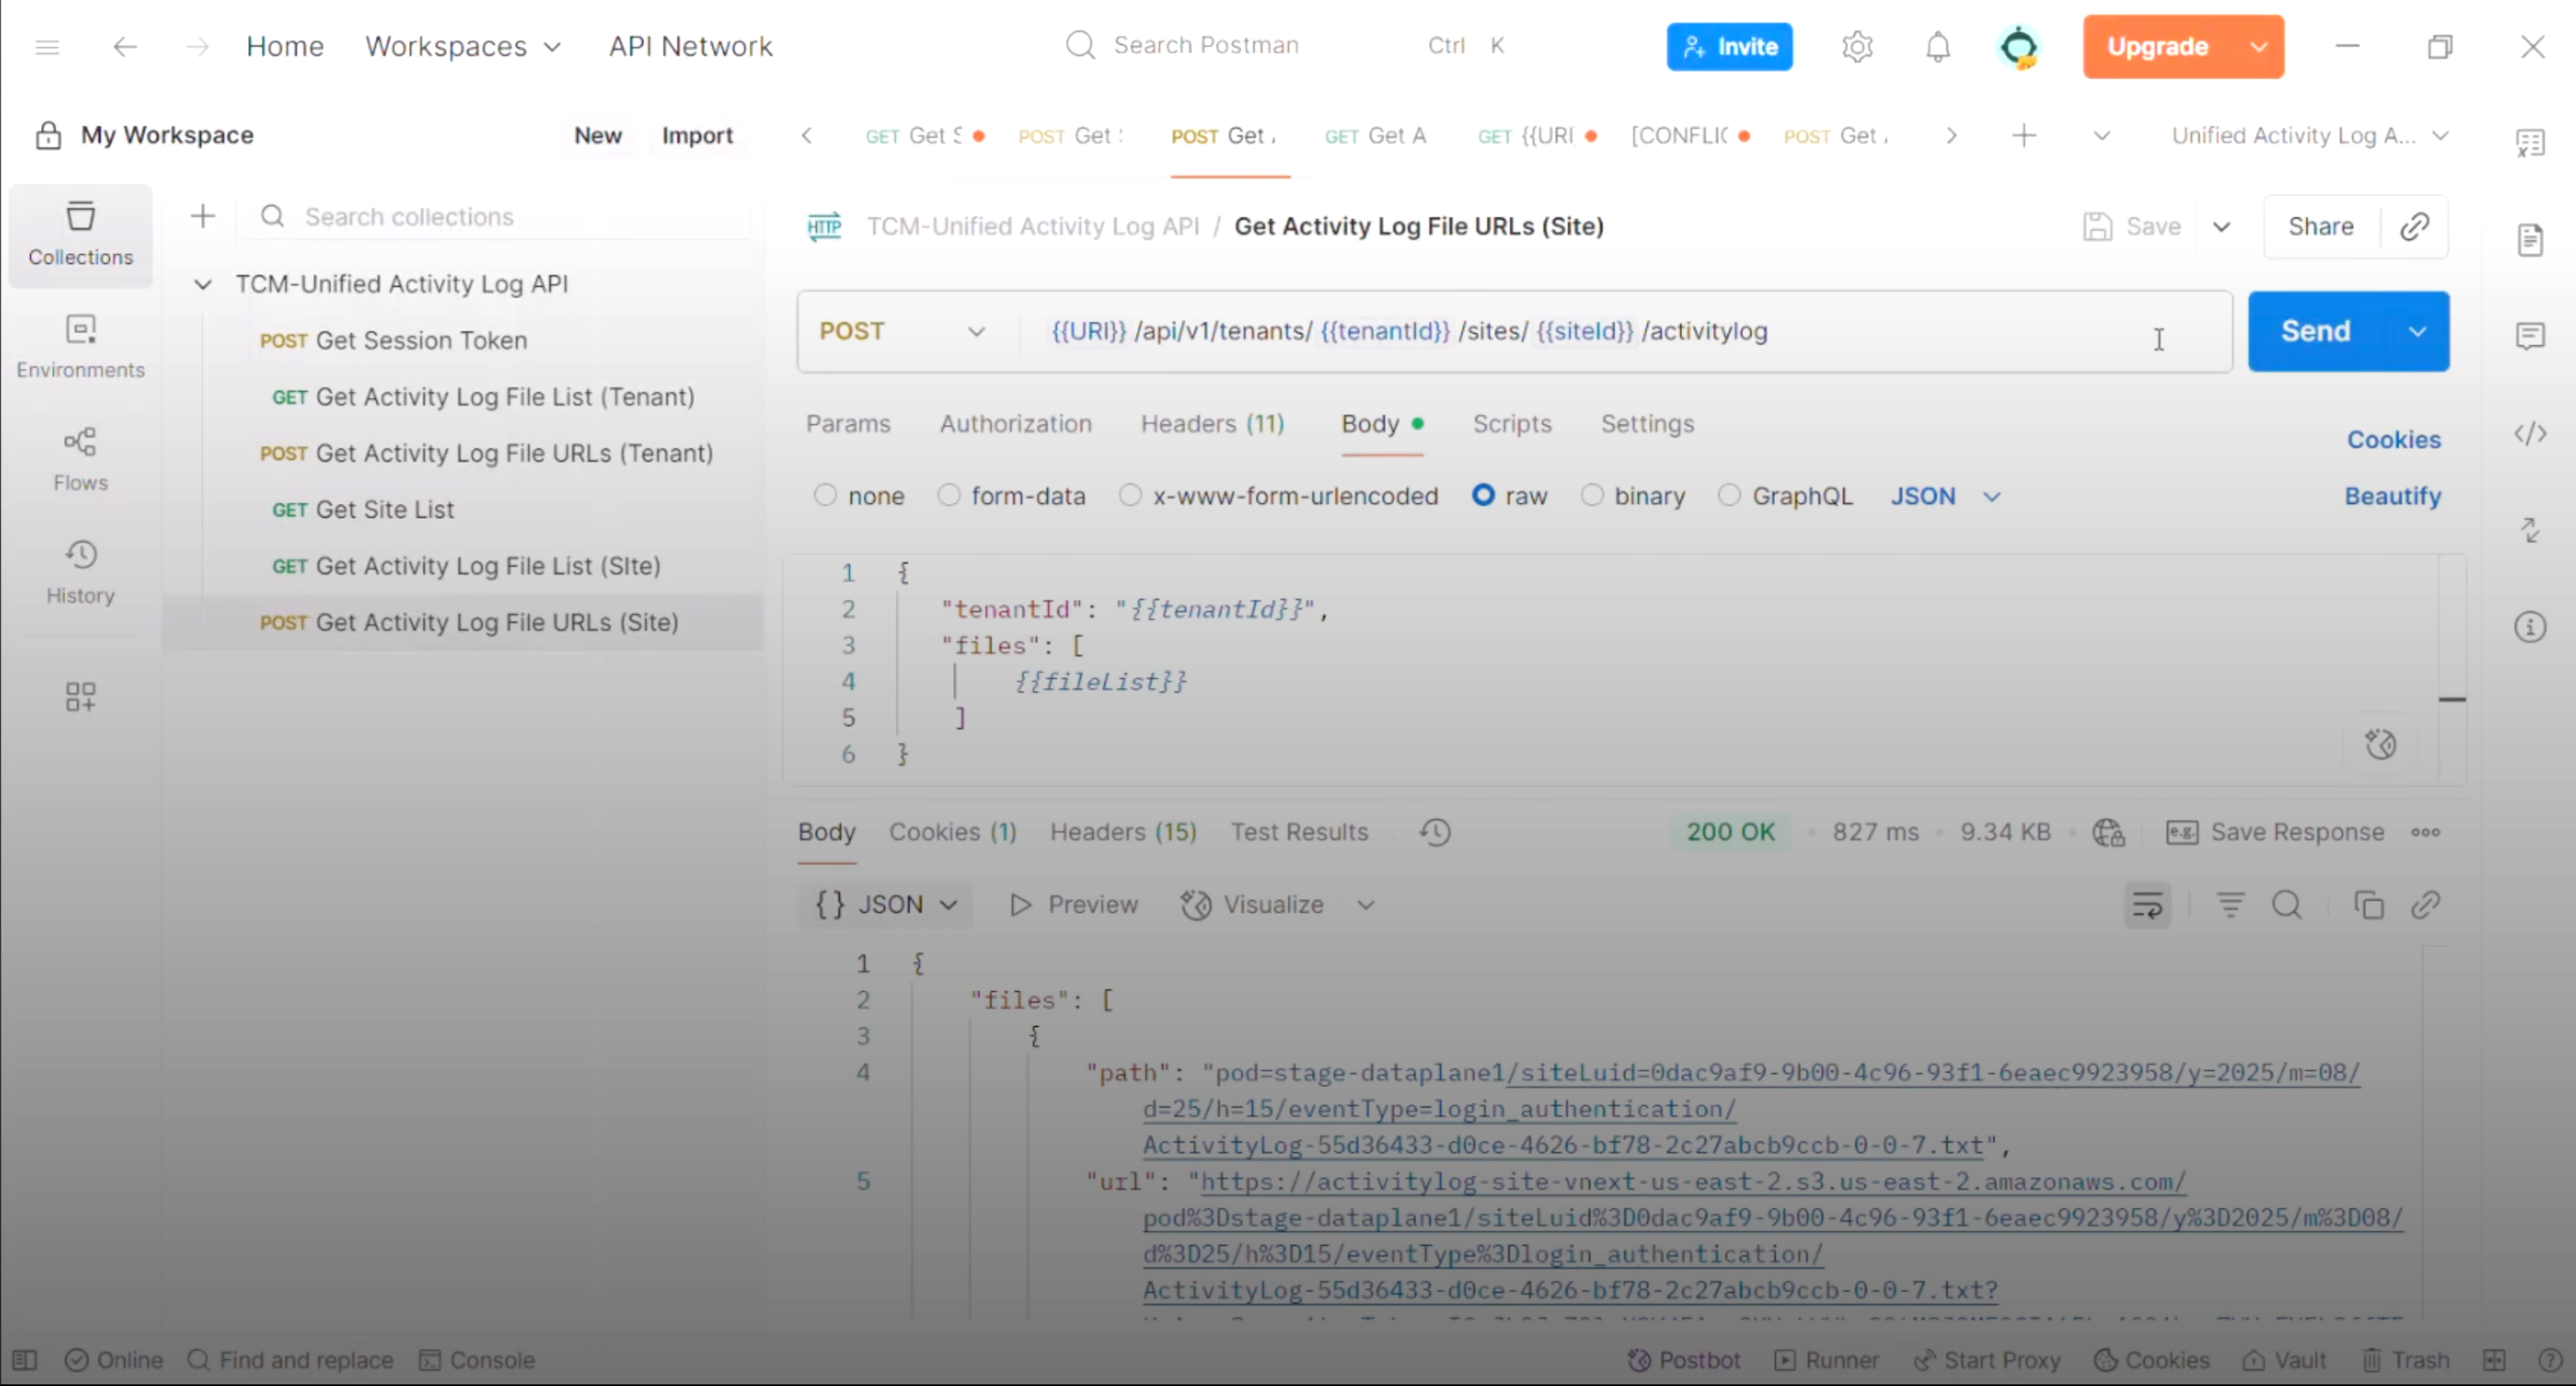
不需要整合 AWS S3,即可透過程式設計方式存取 Tableau Cloud 活動和事件資料。使用新的 API 擷取統一的事件日誌,以便在您自己的資料倉儲中進行自訂監控、SIEM 資料擷取或分析。
注意:近乎即時的日誌記錄和 S3 整合功能僅在 Tableau Enterprise 或 Tableau+ 套組中提供。
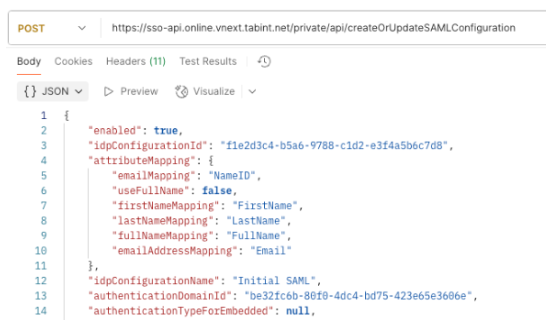
透過 REST API 設定 SAML
透過新的 SAML 設定 REST API,在管理多個站台的安全性時可達到更高的效率和規模。在 Tableau Cloud Manager 或 Tableau Cloud 站台中以程式設計方式設定 SAML,並建立指令碼以自動輪替身分提供者 (IdP) 憑證。
SAML 和 OIDC 的使用者屬性函數
透過直接從身分提供者傳遞的使用者屬性增強列級安全性。透過使用者屬性函數 (UAF) 使用 SAML 或 OIDC 驗證權杖從身分提供者 (IdP) 動態傳遞屬性,藉此使用基於屬性的存取控制 (ABAC) 保護資料。如此即可確保使用者只能看到他們被授權查看的資料。
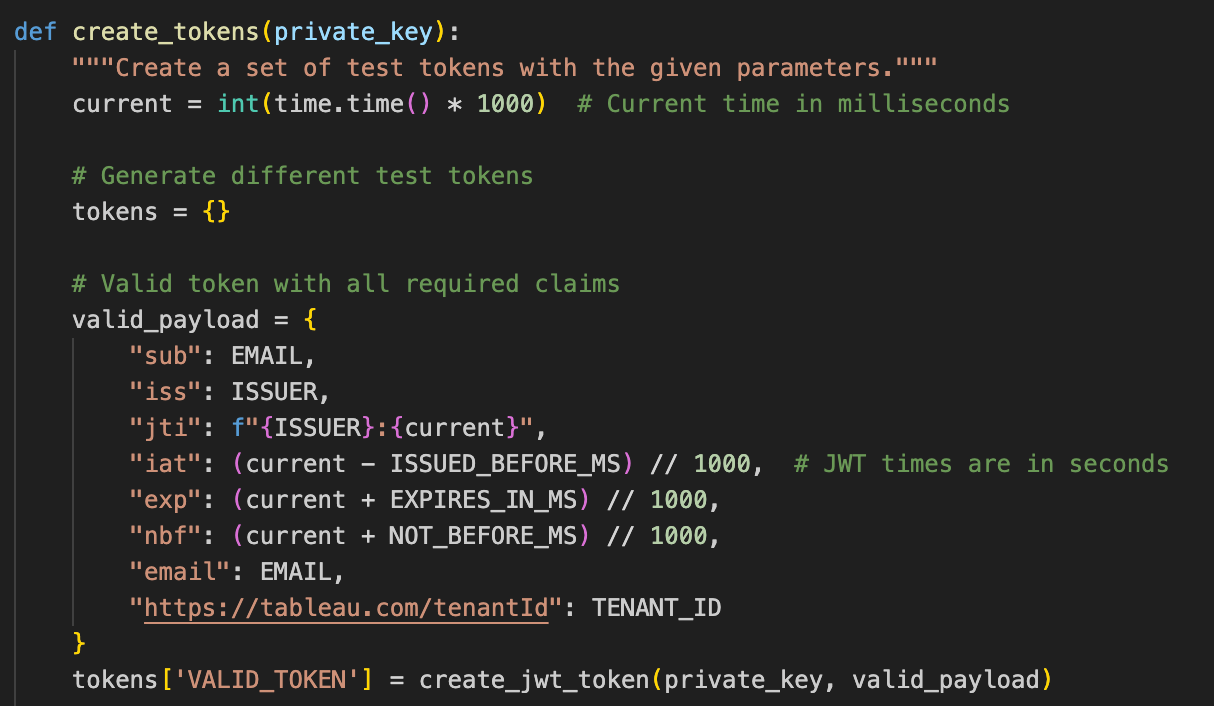
Tableau Cloud 統一存取權杖
運用統一的 JWT 驗證解決方案,簡化多站台管理並實現強大的自動化。這種現代、安全的方法取代難以管理的個人存取權杖,讓您能夠集中管理整個 Tableau Cloud 環境中的 API 存取。
Prep:寫入 Databricks
透過將備妥的資料直接輸出到 Databricks,簡化您的資料管道。使用 Tableau Prep 和 Databricks 的使用者現在可以將流程輸出直接寫入 Databricks 資料庫,藉此節省時間與精力。
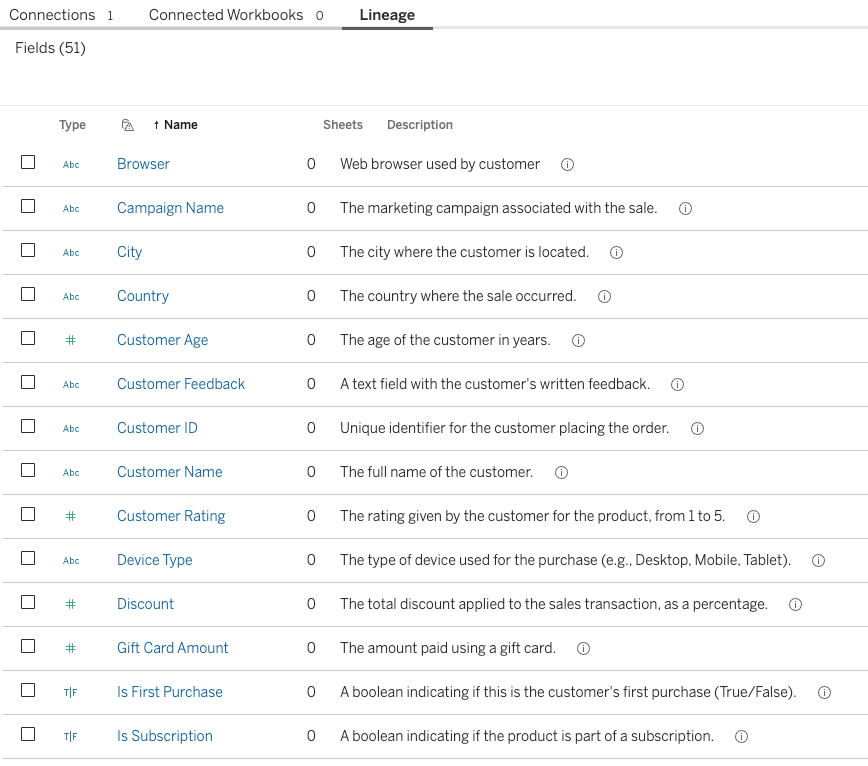
Tableau Agent:提取欄位描述
透過賦予 Tableau Agent 更深層的業務背景,提高 AI 產生的見解的品質和相關性。現在,代理程式可以運用資料目錄中的欄位描述,超越基本中繼資料,提供更準確、更有意義的回應。
代理程式:Prep 中的新語言支援
透過對荷蘭文、瑞典文、泰文以及繁體和簡體中文的多語言支援,將採用 AI 技術的資料準備功能擴展到更多使用者。
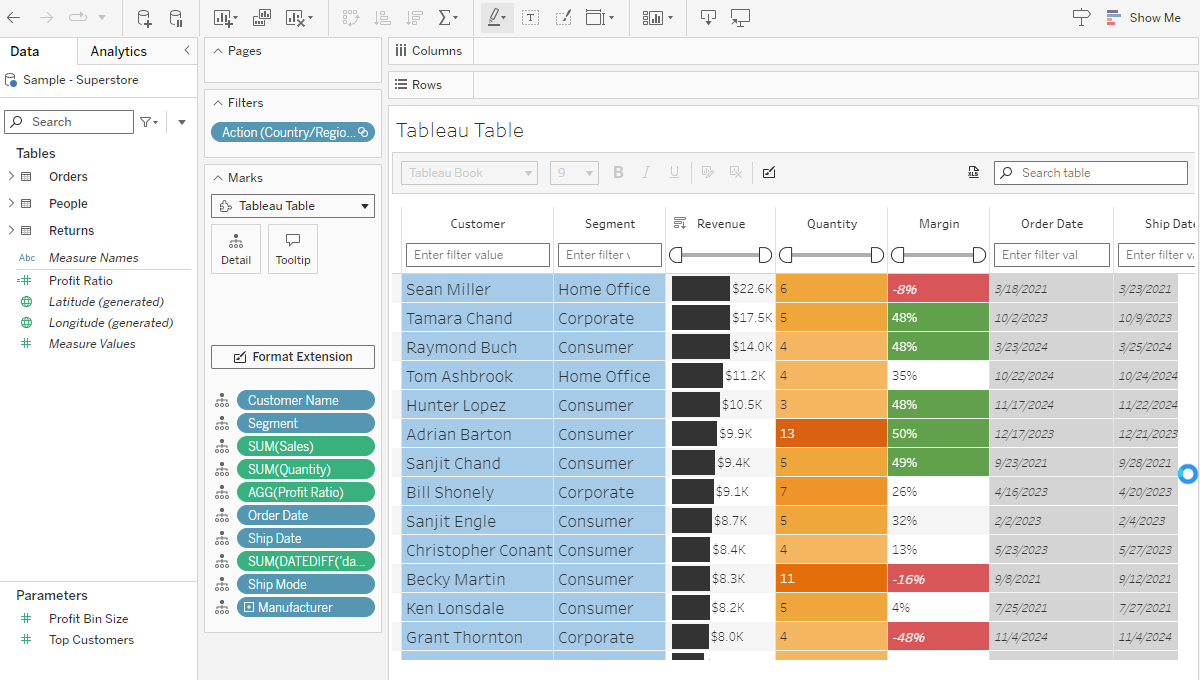
視覺效果擴充功能改進
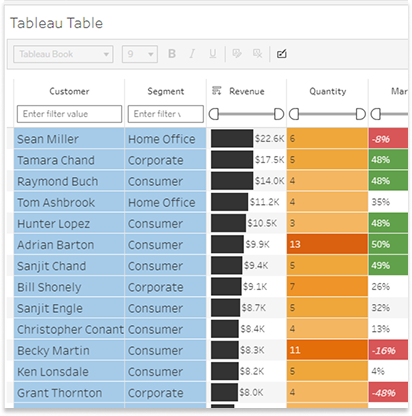
使用更新的桑基圖和資料表視覺化擴充功能,在創作時可獲得更大的彈性和控制。每項功能都新增多項生活品質改進,包括更豐富的桑基標籤和色彩對應控制;資料表方面,改進列篩選體驗,並且可一次自訂資料表中空值的顯示。這些改進將在 Tableau Desktop、Cloud、Server 和 Public 版本中提供。
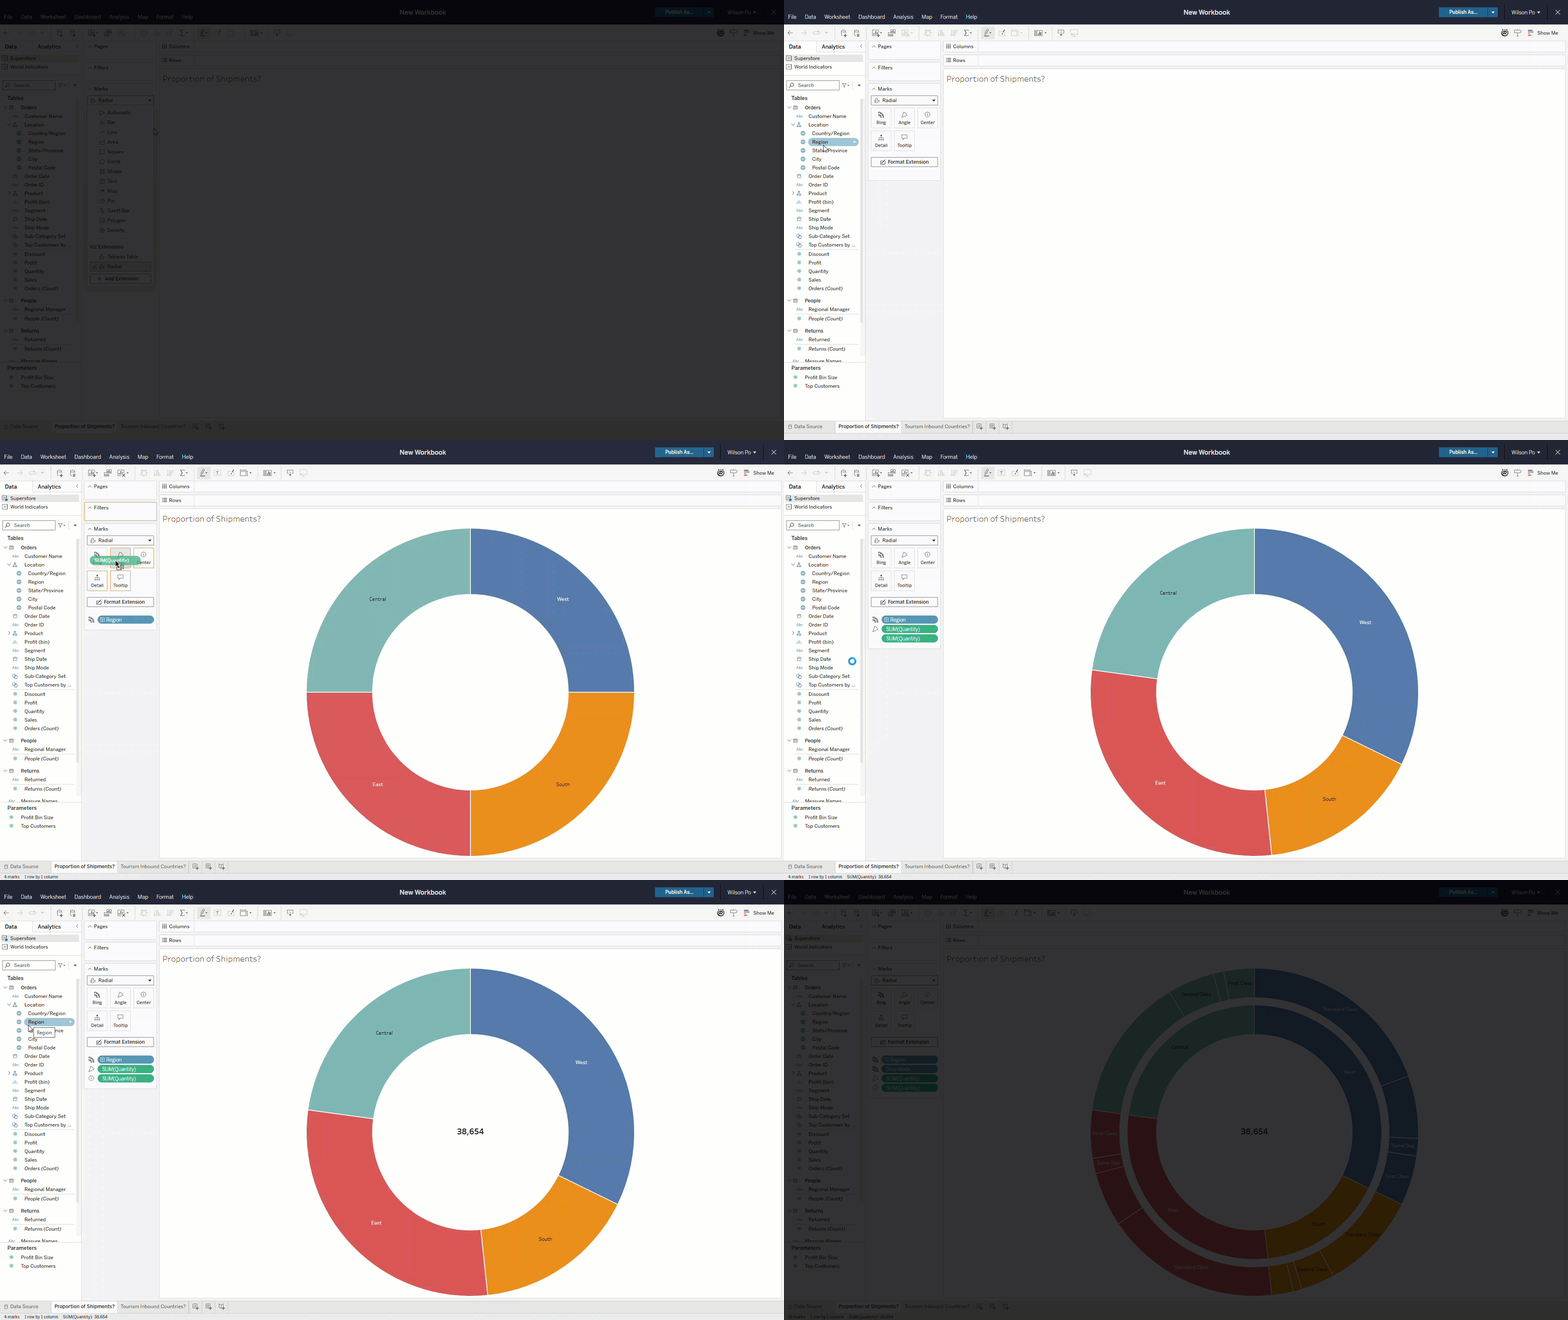
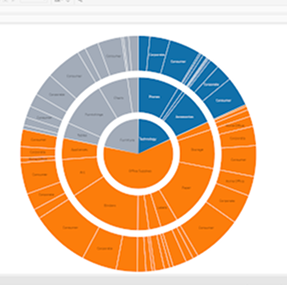
徑向圖視覺效果擴充功能
輕鬆建立吸睛的甜甜圈圖和旭日圖,以視覺化方式呈現部分資料與整體資料之間的關係。可以直接在標記卡片下拉式選單中或透過「顯示」將這個新的視覺化擴充功能新增到工作簿中。透過拖放操作,即可將資料視覺化為徑向圖,這種廣受利害關係人青睞的格式,能協助他們在 Tableau Desktop、Cloud、Server 與 Public 平台上瞭解階層關係。
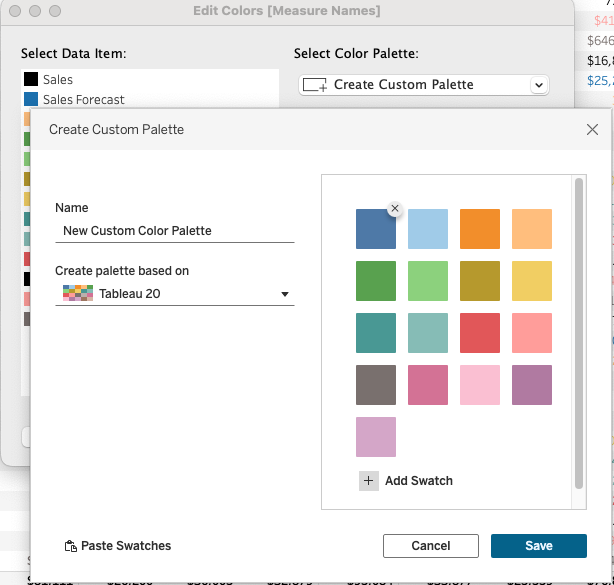
自訂色彩調色盤
透過在 Tableau Desktop 中直接建立和儲存自訂色彩調色盤,確保品牌一致性並完美地設計您的視覺化效果。這種新體驗允許創作者建立和修改調色盤,這些調色盤可以在工作簿或多個工作簿中重複使用。自訂色彩調色盤會儲存到首選項檔案中,並在以後的 Tableau Desktop 工作階段中持續保留。

「顯示」中的即時視覺效果
先前已在 Tableau Cloud 上發佈的 Tableau Server 使用者現在可以透過更新的「顯示」功能簡化資料分析。開啟「顯示」後,按幾下即可查看資料視覺效果。預設提供全部視覺化類型,您可以選擇所需的欄位,或讓 Tableau 協助您開始使用。

工作簿色彩調色盤指派
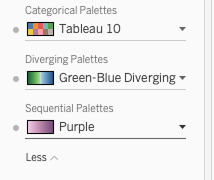
使用新的調色盤設定,確保整個工作簿的色彩一致性。創作者現在可以一次設定預設的分類、發散和順序色彩調色盤,以便在全部視覺效果和儀表板中應用一致的樣式,藉此節省時間與精力。可在 Tableau Desktop、Tableau Cloud 和 Tableau Server Web Authoring 中使用。

新增關聯資料表
建立達到更高效率和準確性的資料模型。在資料模型中自動新增關聯資料表並定義這些資料表之間的關係,運用資料庫中定義的外部索引鍵限制,簡化在 Tableau Desktop、Server 和 Cloud 中的設定。

Tableau Semantics 連接器更新
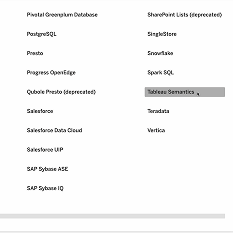
在 Tableau Server 中無縫運用 Tableau Semantics 模型中的其他語意定義。此外,Tableau Desktop、Server 和 Cloud 使用者也可以使用連接器的最新更新。現在,在最佳化和擴充 Tableau 資料來源時,您可以在使用者和工作簿上重複使用精選的 Tableau Semantics 資料來源。將語意模型中定義的群組和資料桶新增到視覺化,讓使用者能夠運用精心設計的業務邏輯。運用多事實語意模型建立視覺化,以實現跨區域分析。不需要配置即可在視覺化中顯示影像。
Tableau MCP:OAuth 支援
使用 Tableau MCP 時,請確保符合企業級治理和安全標準。藉由 HTTP 傳輸和 OAuth 的支援,您可以集中託管和管理遠端 Tableau MCP 伺服器,該伺服器接受來自不同使用者的請求,並遵守 Tableau Server 上的列層級安全性策略。
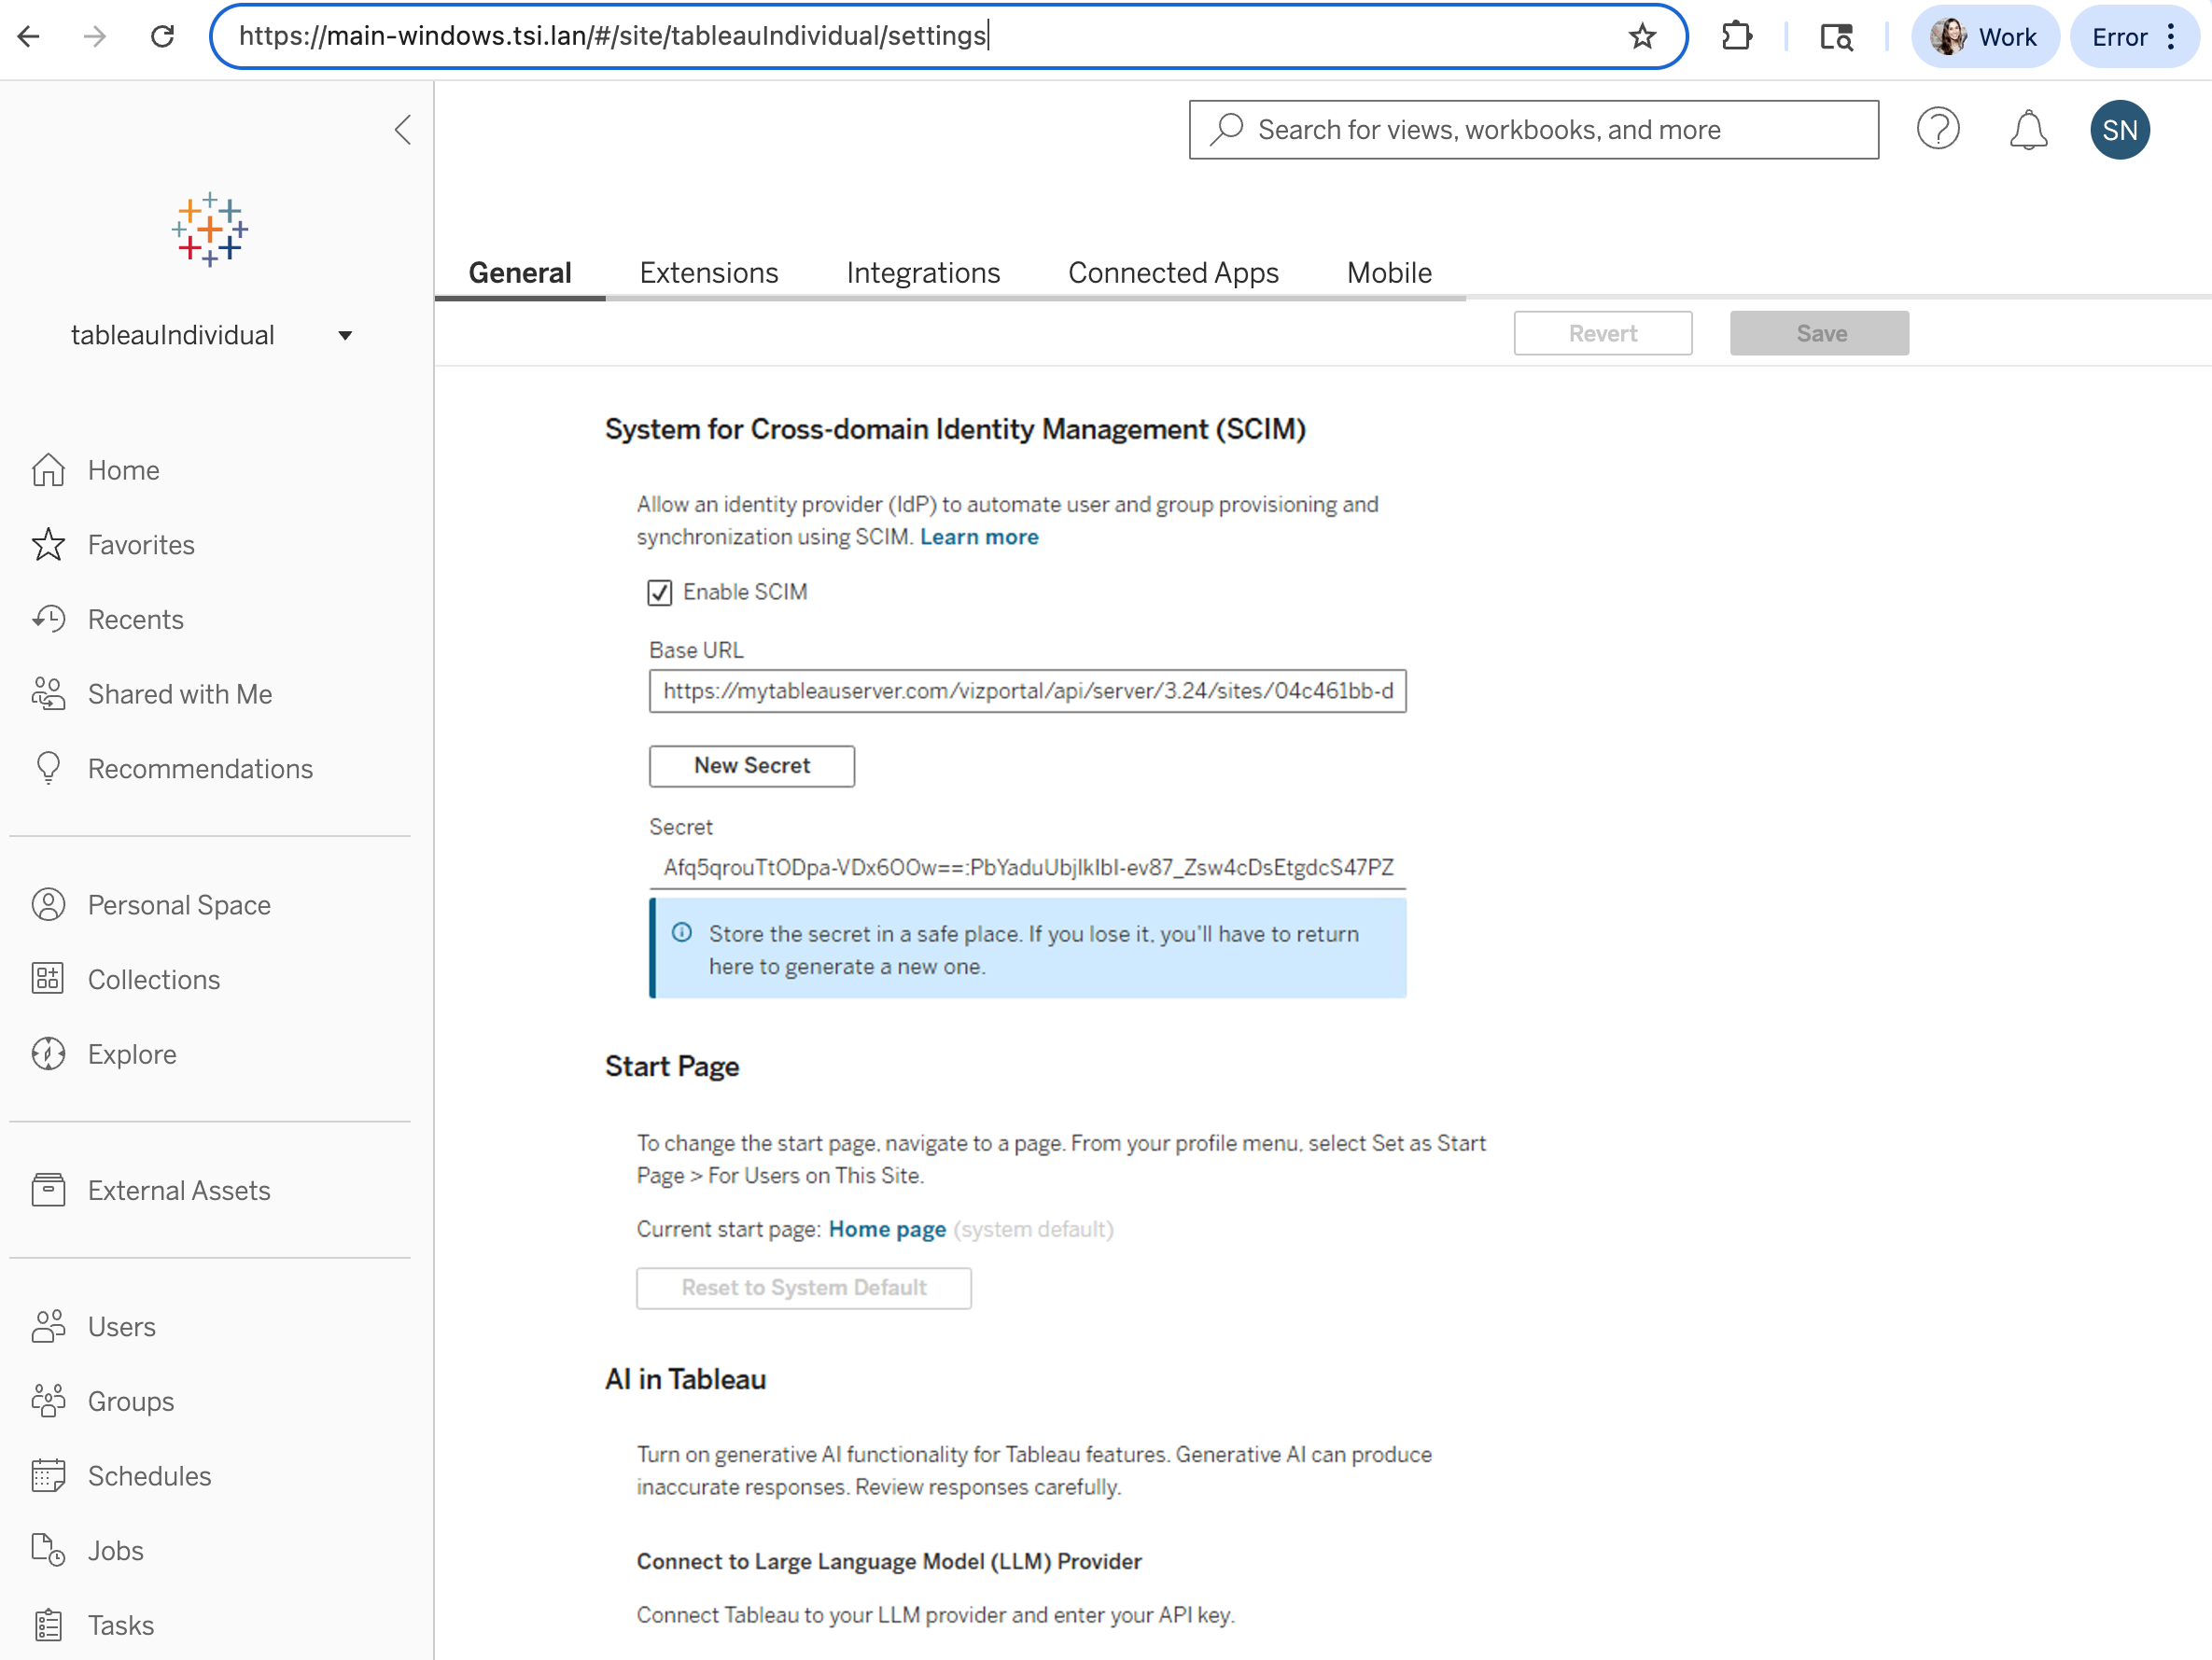
Tableau Server 上的 SCIM 支援
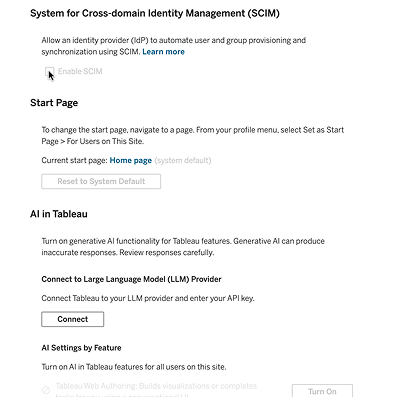
先前已在 Tableau Cloud 上發佈,現在您可以使用身分識別提供者 (IdP) 做為資料來源,將使用者和群組佈建到 Tableau Server。透過使用 SCIM,您可以避免手動管理多個應用程式的使用者和群組,藉此提高效率並保持符合標準。
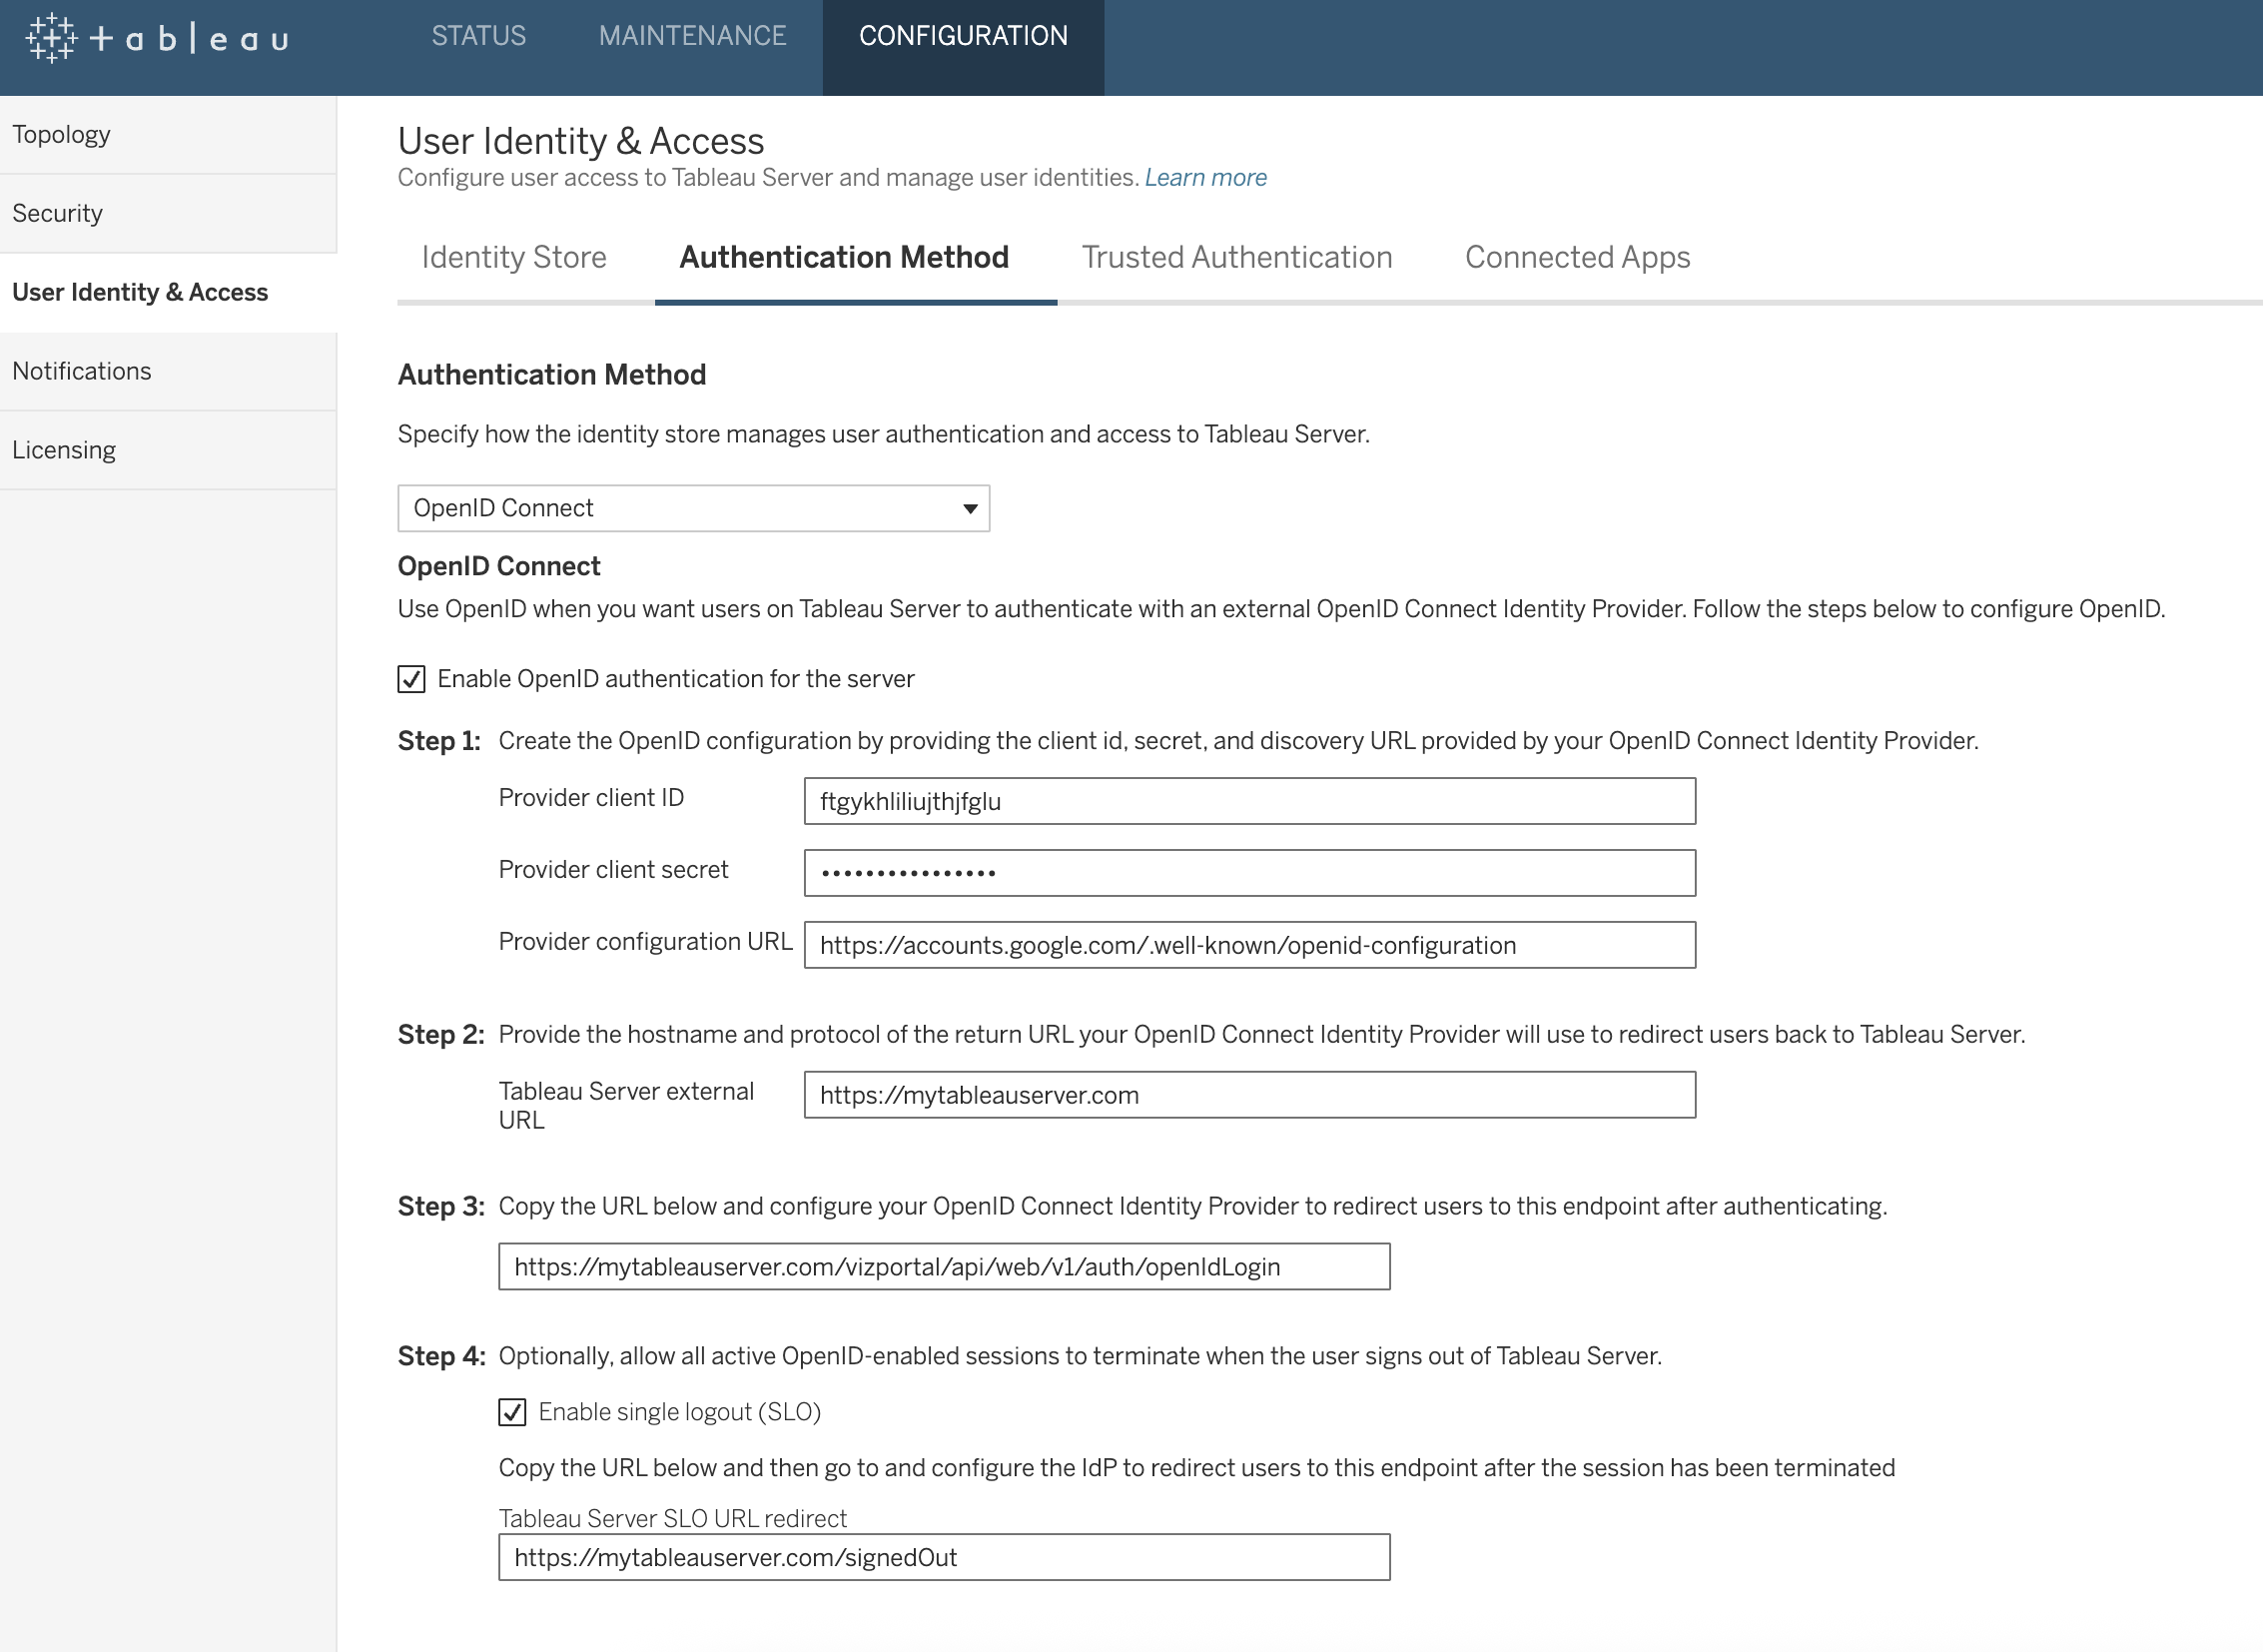
OpenID Connect RP 啟動的單一登出
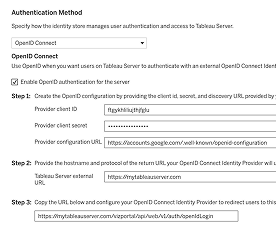
設定 OpenID Connect 時,Tableau Server 管理員現在可以啟用單一登出 (SLO),藉此提供更優質的商務使用者體驗並提高整個組織的安全性。啟用此功能後,從 Tableau Server 登出的使用者也會從其身分提供者 (IdP) 和相關應用程式中登出,藉此消除孤立工作階段和工作階段劫持的風險。
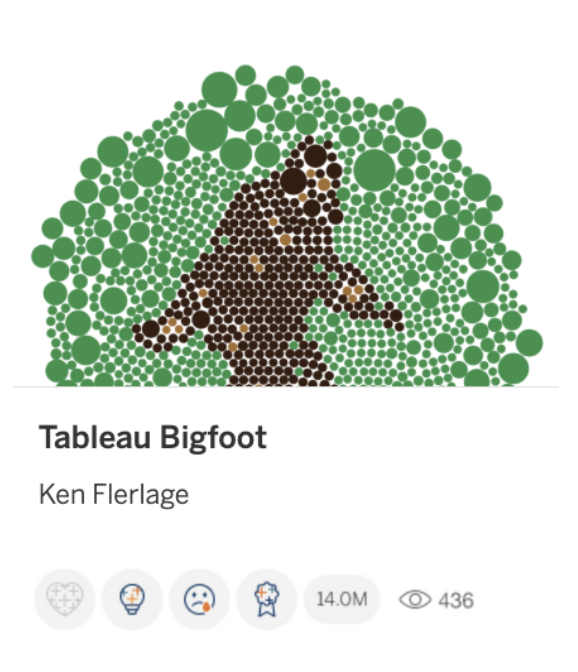
在 Tableau Public 上檢視回應
使用全新的表情符號回應,在 Tableau Public 上與視覺化內容和作者互動。此功能為觀眾提供一種有趣的回應方式,可以直接向作者提供意見回饋。

在 Tableau Public 上尋找作者
在 Tableau Public 的首頁上尋找 Tableau 社群的創作者。尋找並關注才華洋溢的作者,獲得新鮮有趣的內容,藉以激發靈感。
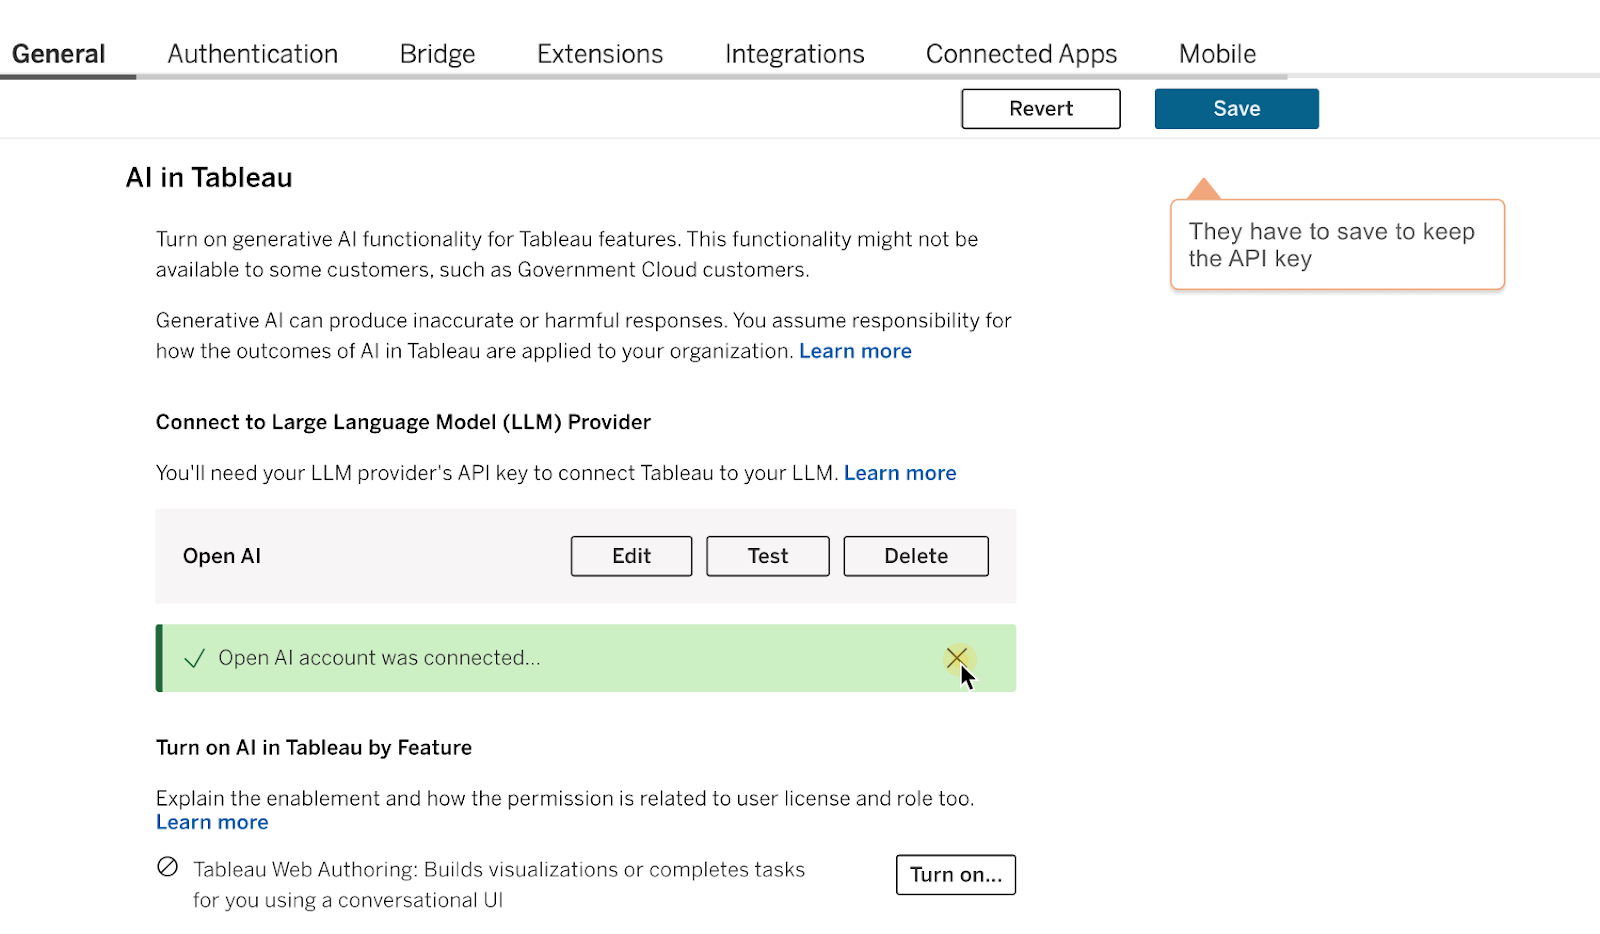
Tableau Server 中的 Tableau Agent
使用 Tableau Agent(您的 AI 助理)協作,在 Tableau Server 上更快取得見解。使用自然語言獲得分析各個階段的支援 — 從資料準備到探索和視覺化。Tableau Server 中的 Tableau Agent 將支援 Tableau Prep 和 Web 製作功能。若要獲得開箱即用的體驗,在 Web 製作或 Desktop 中啟動 Tableau Agent 之前,您需要使用您的 API 金鑰連線到 OpenAI。
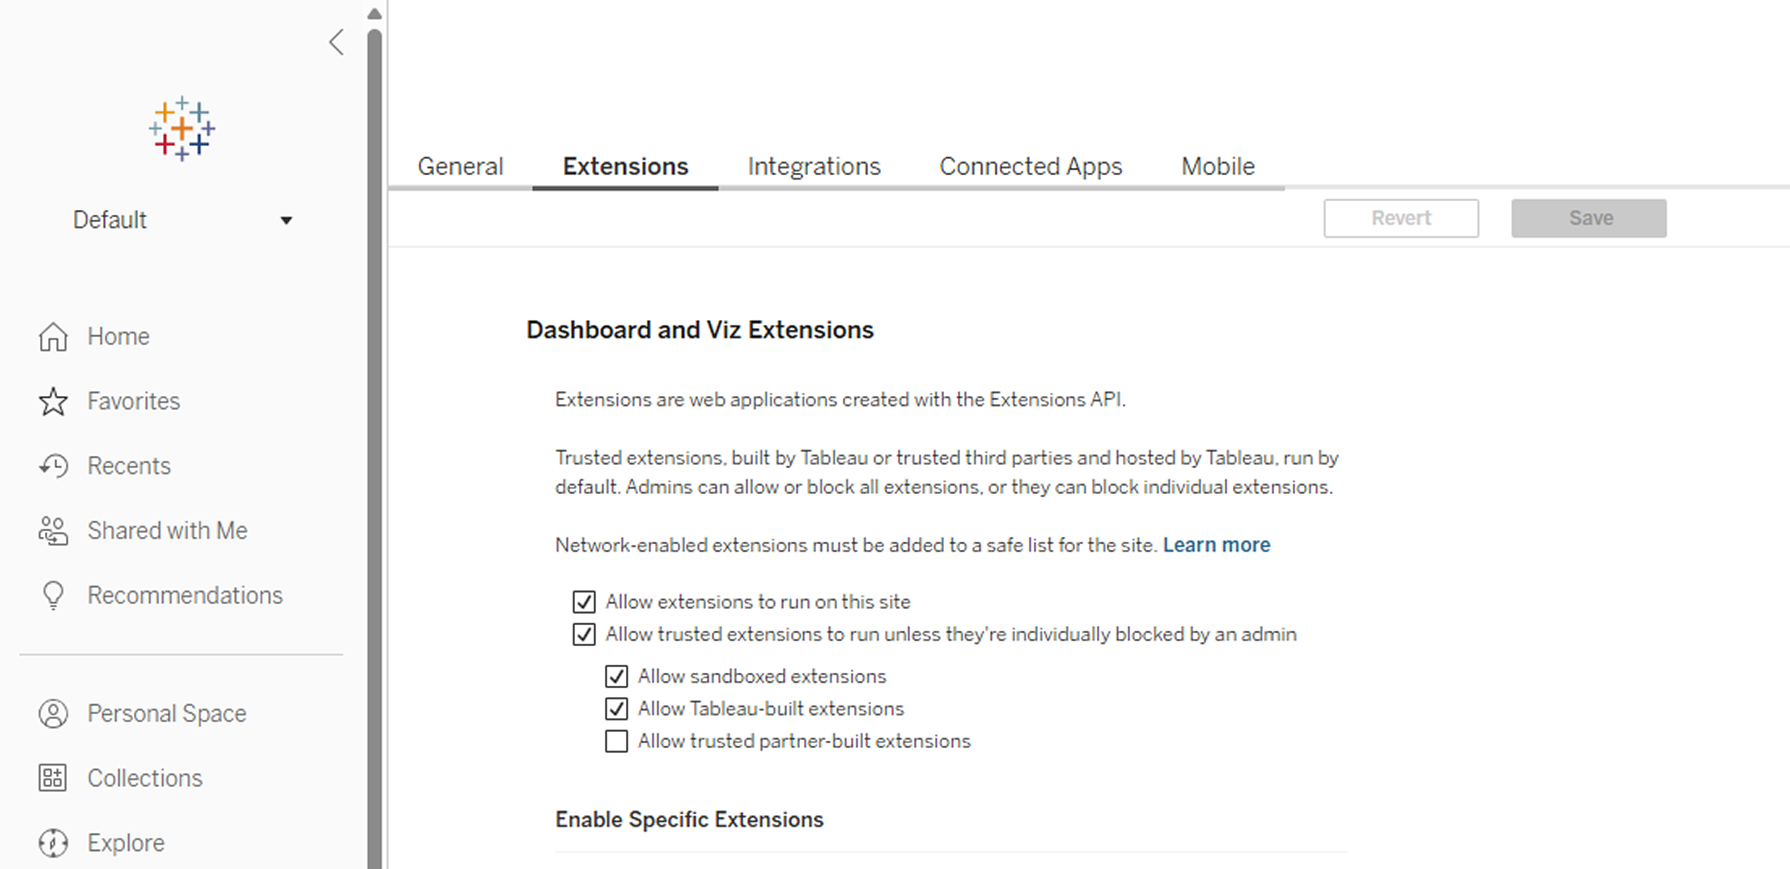
受信任的擴展功能
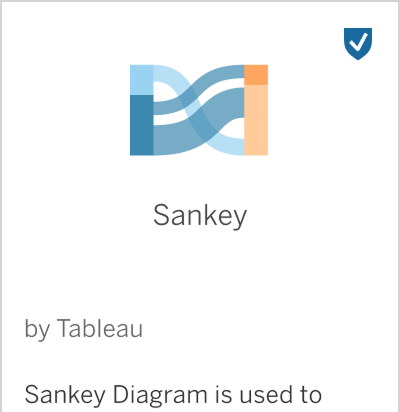
管理員和分析師可以透過快速識別受信任的擴充功能,自信地採用 Tableau Exchange 中提供的擴充功能。標示全新藍色勾號徽章的擴充功能由 Tableau 部署和協調:這些已通過 Tableau 程式碼審查、網路測試,並由 Tableau 託管以管理可用性和安全性。
管理員現在有新的設定,可以允許或阻止擴充功能運作,藉此更確實符合 Tableau 支援的標準。全部受信任的擴充功能也會自動啟用,以便在 Tableau Public 中完全使用。
受信任的擴充功能可在 Tableau Desktop、Cloud、Server 和 Public 中使用。

Tableau Agent:儀表板敘述
藉由 AI 產生的直覺式解釋,輕鬆進行資料探索。Tableau Agent 提供儀表板敘述,簡潔概述儀表板內容,並提供每個視覺效果的見解,藉以突顯重要趨勢。
Tableau Cloud 和 Desktop 即將推出 Beta 版。
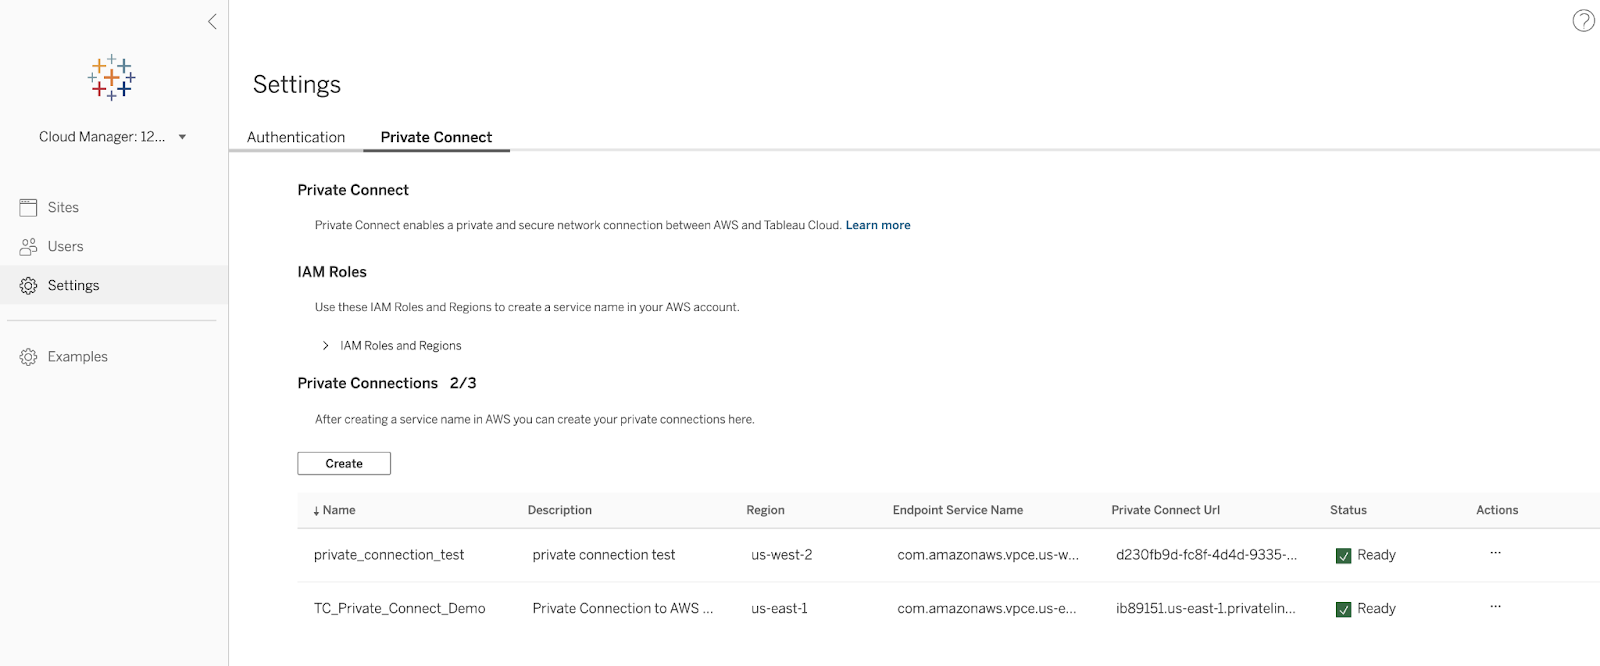
New Connectors for Private Connect
Securely connect more of your AWS data to Tableau Cloud without exposure to the public internet. Private Connect now supports AWS hosted MariaDB, Dermio Server, Teradata Server, Heroku, and Teradata Vantage Cloud, allowing you to use a dedicated and private connection to more of your data sources.
This feature addresses or partially addresses the following request on the Salesforce IdeaExchange: Implement AWS PrivateLink in Tableau Cloud.
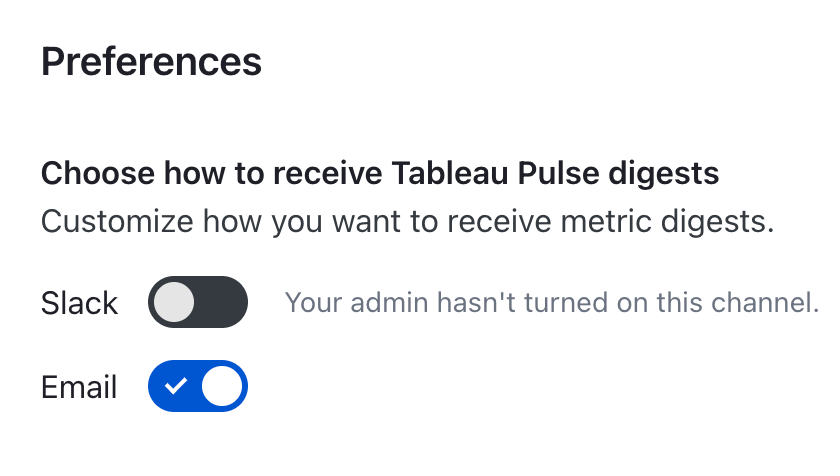
Tableau Pulse:停用警示和摘要
透過在站台層級停用摘要和警示管理 Pulse 使用者體驗。如此即可授予管理員控制權,並且有助於管理分階段實施。

Tableau Pulse:自訂摘要頻率
自訂您的摘要推送。設定每週或每月摘要的固定日期,以確保您的見解在最有用的時候適時送達。
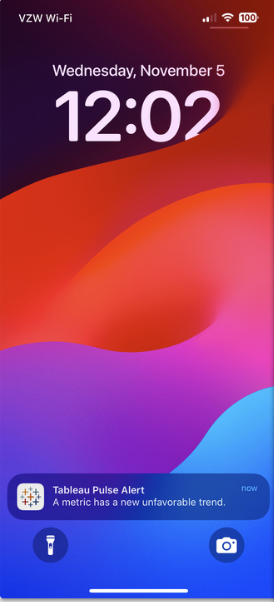
Tableau Pulse: Mobile Push Notifications
Get important Tableau Pulse alerts on the go without running the Tableau mobile app in the background. With mobile push notifications from Tableau Pulse, business users can better track important updates in real time, wherever they are.
Available on both Android and iOS.

Tableau Pulse: Pacing and Historical Context on Metric Card
Quickly evaluate a Tableau Pulse metric based on pacing and historical context. Now business users can see both the metric's progress to a set goal and its performance relative to the prior period directly on the metric card. Instead of having to click into the metric details, users can obtain a fuller sense of the metric's performance directly from the Tableau Pulse home page.
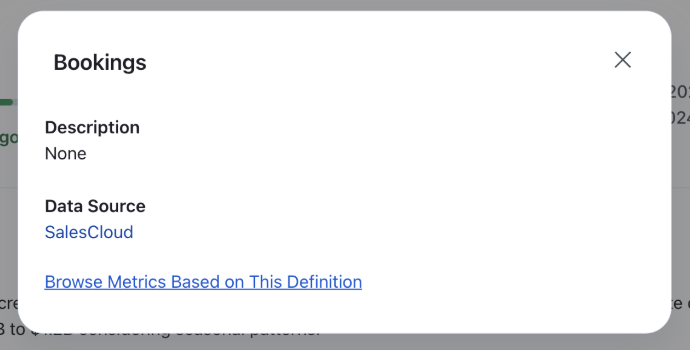
Tableau Pulse: Link to Metric Datasource
Easily explore the data behind a Tableau Pulse metric for deeper insights. Instead of only getting the datasource name in Tableau Pulse and having to search for the actual data, business users can now click into the datasource directly from the metric in Tableau Pulse.
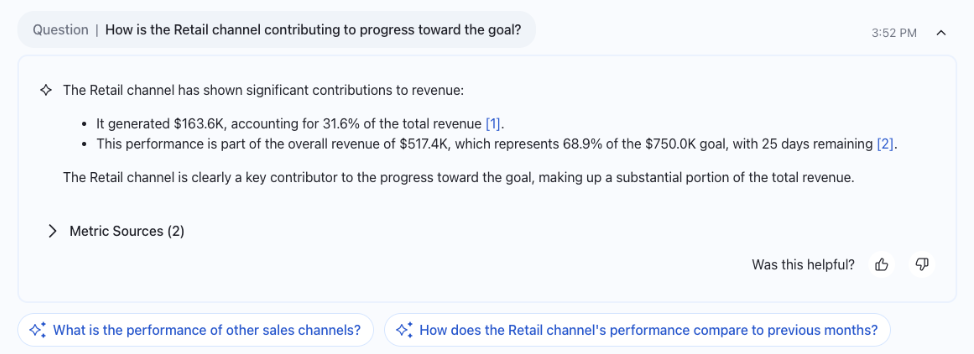
Tableau Pulse: Q&A for Goals and Thresholds
Get intuitive answers around set goals and thresholds from Tableau Pulse. Tableau Pulse uses frontier LLMs to detect patterns, highlight risks, and now, explain changes across multiple metrics relative to their set goals and thresholds. In addition to getting pacing context from the individual metric, business users can now ask questions and get responses, enriched with these insights.
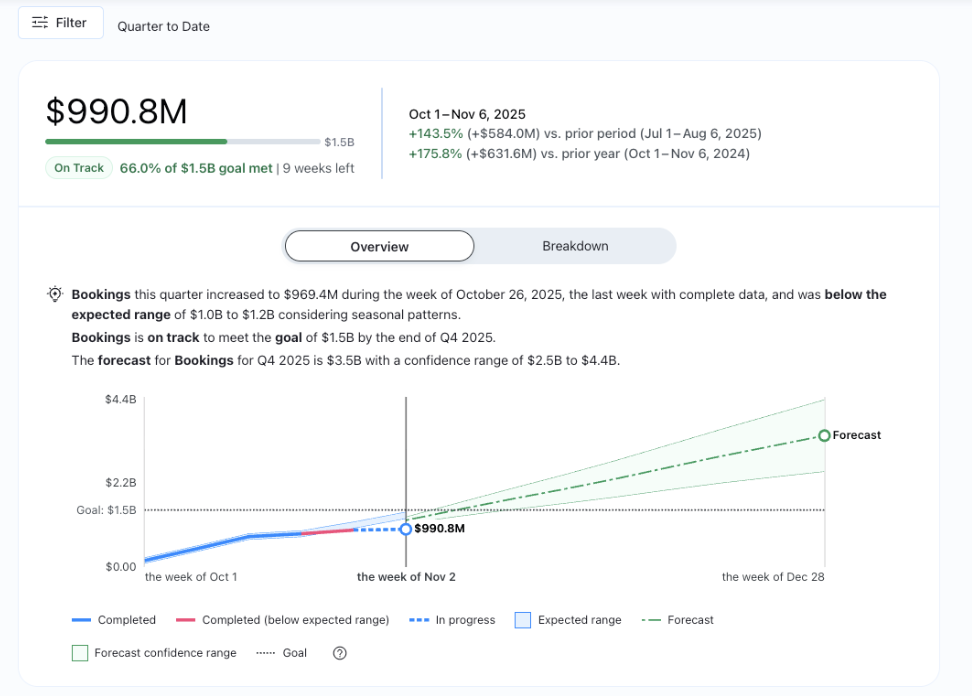
Tableau Pulse: Pace to Goal Insight
Instantly determine whether a Tableau Pulse metric is on pace to meet a set goal by the end of the period. When users click into the metric details, they will see the metric labeled as either 'On Track' (in green) or 'Off Track' (in red). At the chart level, users get a written progress summary and the explanatory chart, color coded to indicate pacing status. With this additional insight, business users can better prioritize their time and make smarter decisions, faster.
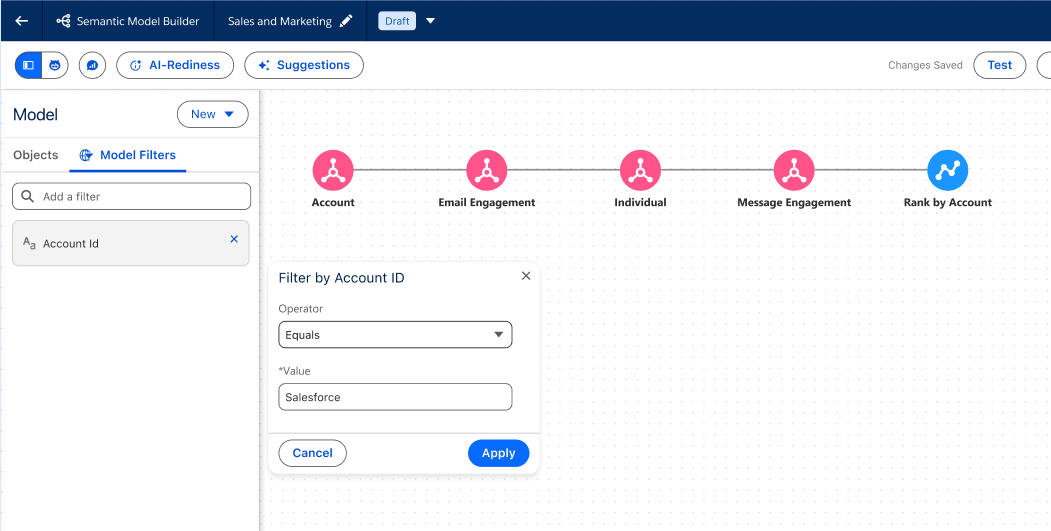
Tableau Next: Semantic Model Global Filter
Apply a wide, consistent filter directly to your entire semantic model, limiting the scope of all returned data for universal consistency. This reduces repetitive setup of the same filter logic across different definitions and ensures users only see relevant, authorized data.
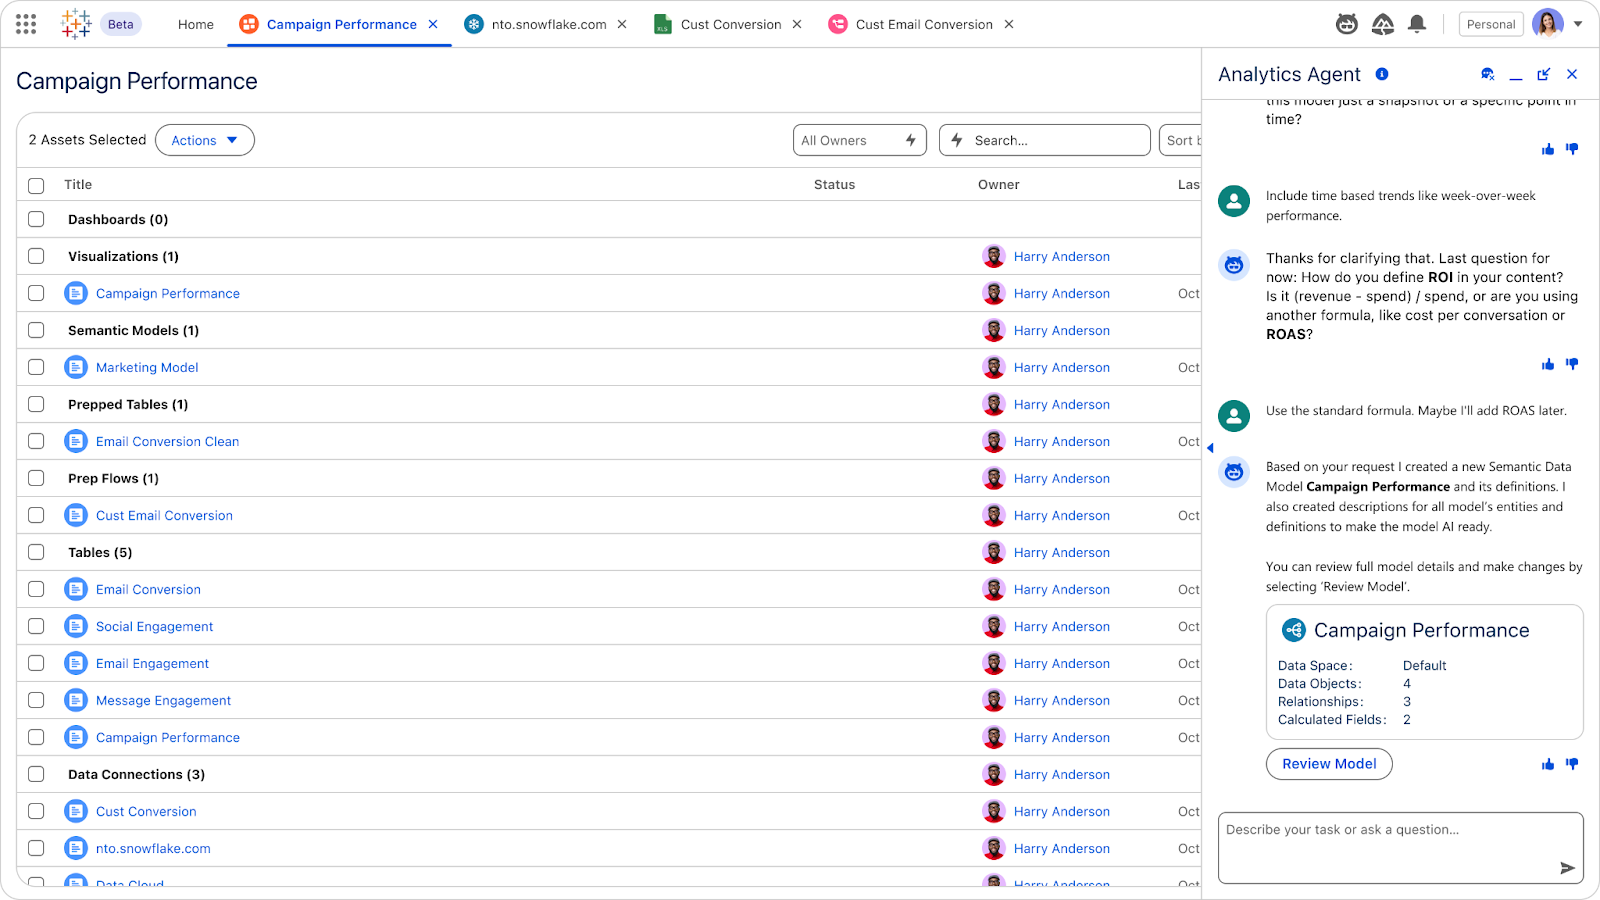
Tableau Next: Create Semantic Data Model
Automatically generate a tailored semantic model based on a business goal, complete with relevant objects, relationships, and calculated fields. This accelerates semantic model creation and prepares your models to be AI-ready.
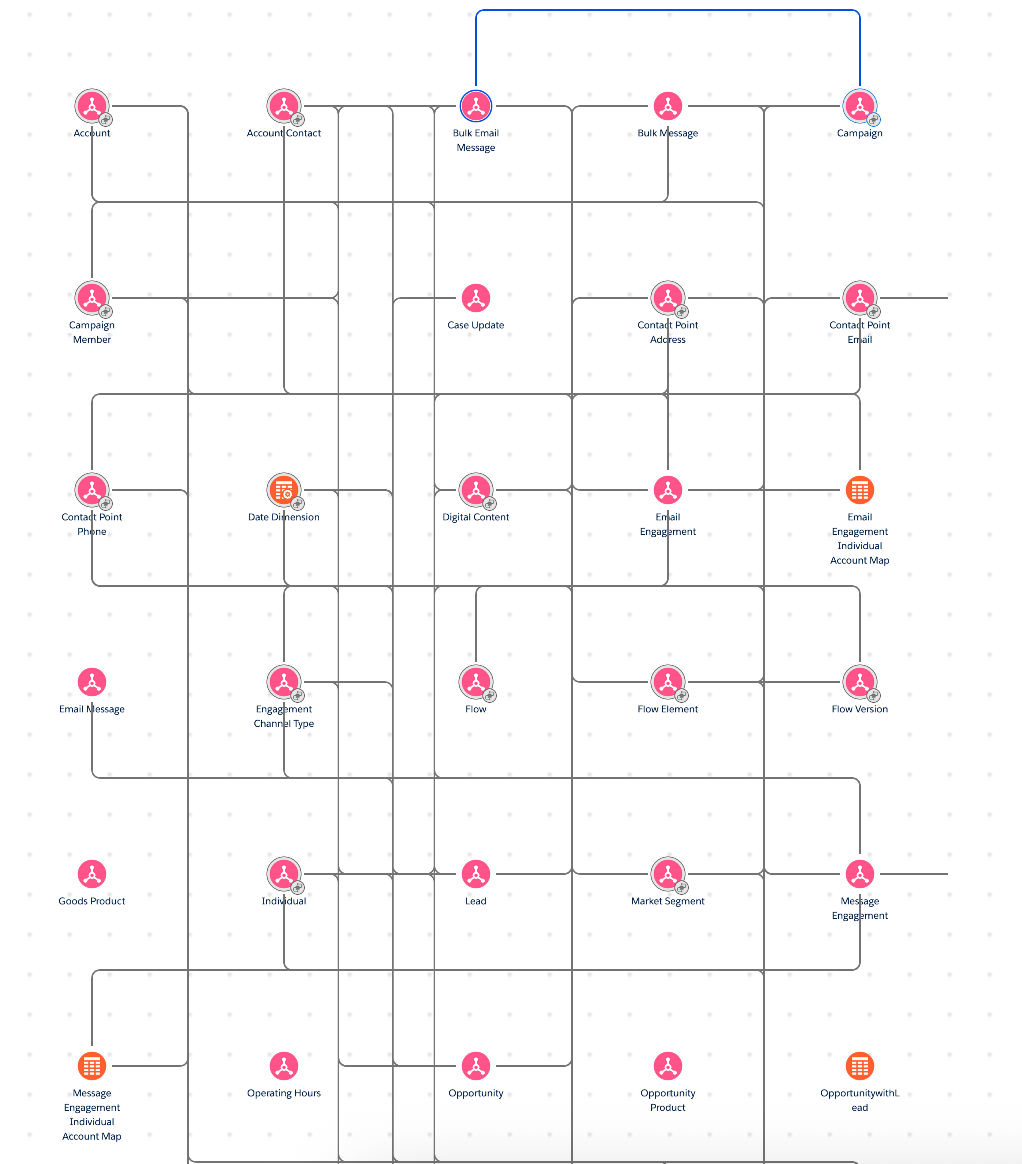
Tableau Next: C360 Semantic Model Support
Empower customers with trusted, cross-cloud insights. Ask natural language questions about data in the C360 semantic data model to gain trusted, cross-cloud insights.
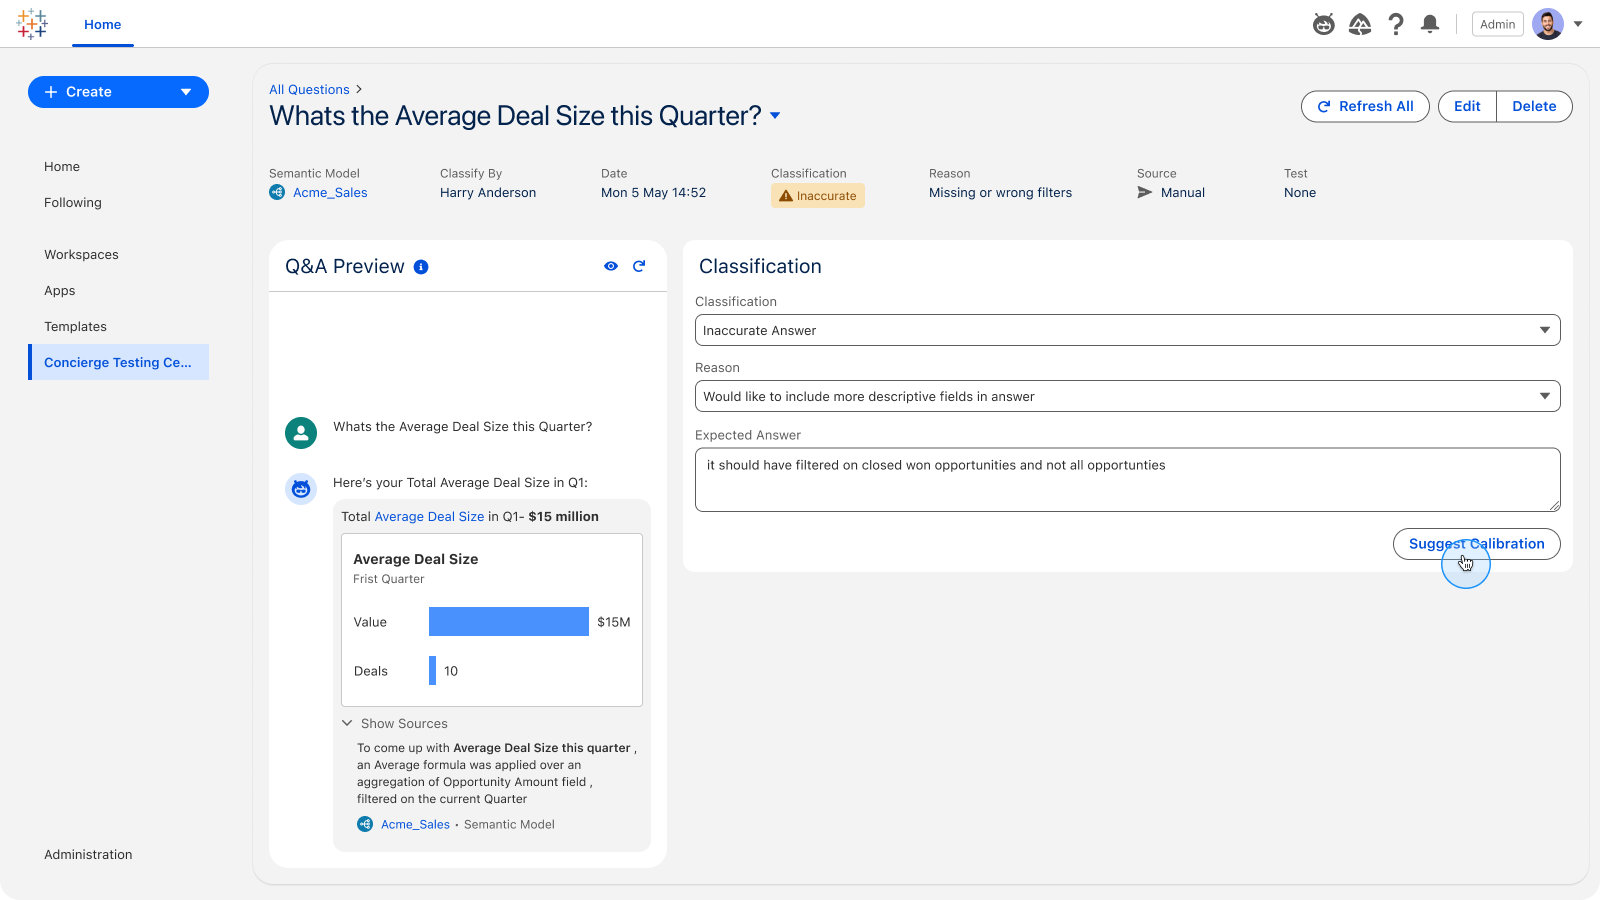
Tableau Next: Q&A Calibration
Improve your agent's accuracy on analytics questions with Q&A Calibration. Test responses against a set of questions, classify them as accurate or inaccurate, and apply guided suggestions to calibrate and verify answers.
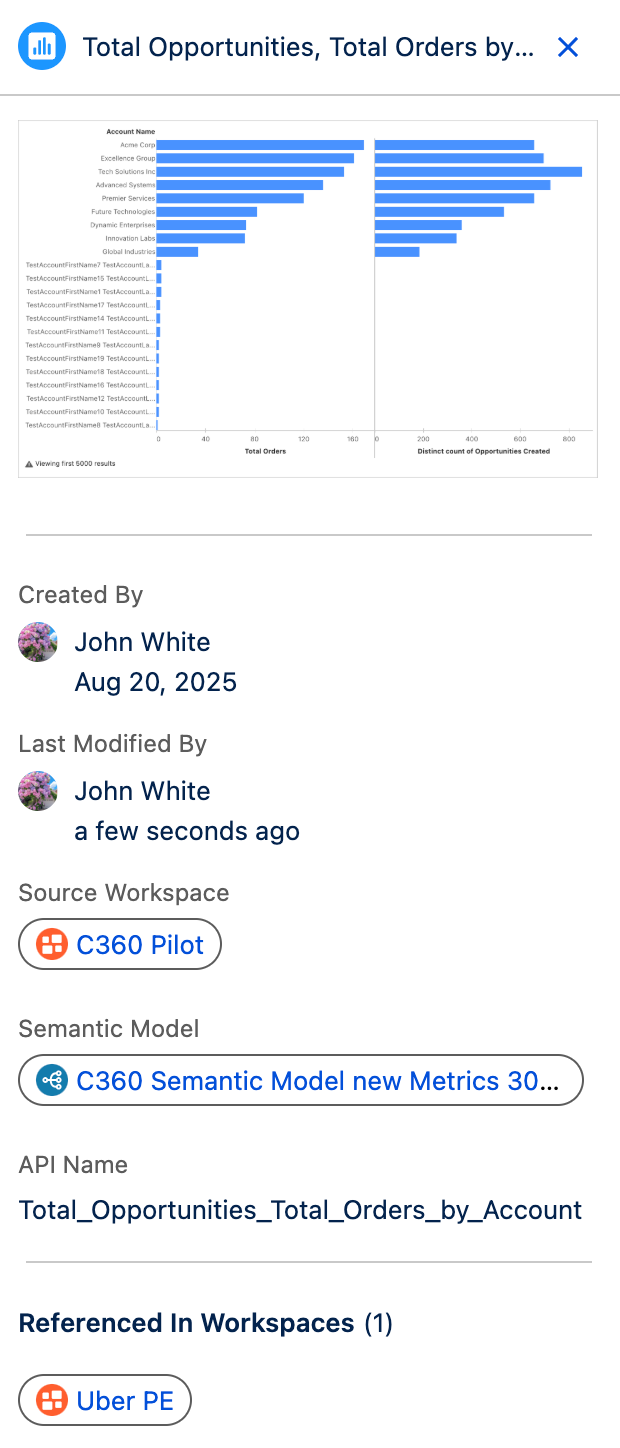
Tableau Next: Asset Details
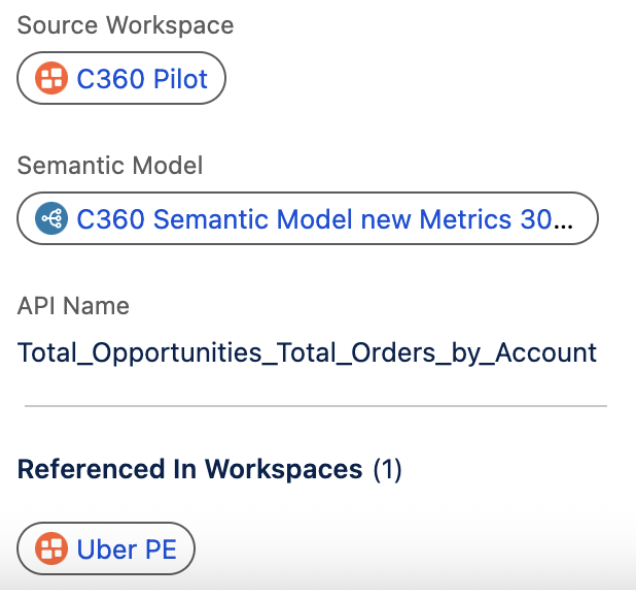
Assess asset usage and context within your organization's ecosystem without needing to open it. View assets such as thumbnails, workspaces, and semantic models directly in the Detail Panel. This brings clarity into how assets are being used and leveraged in the flow of work.
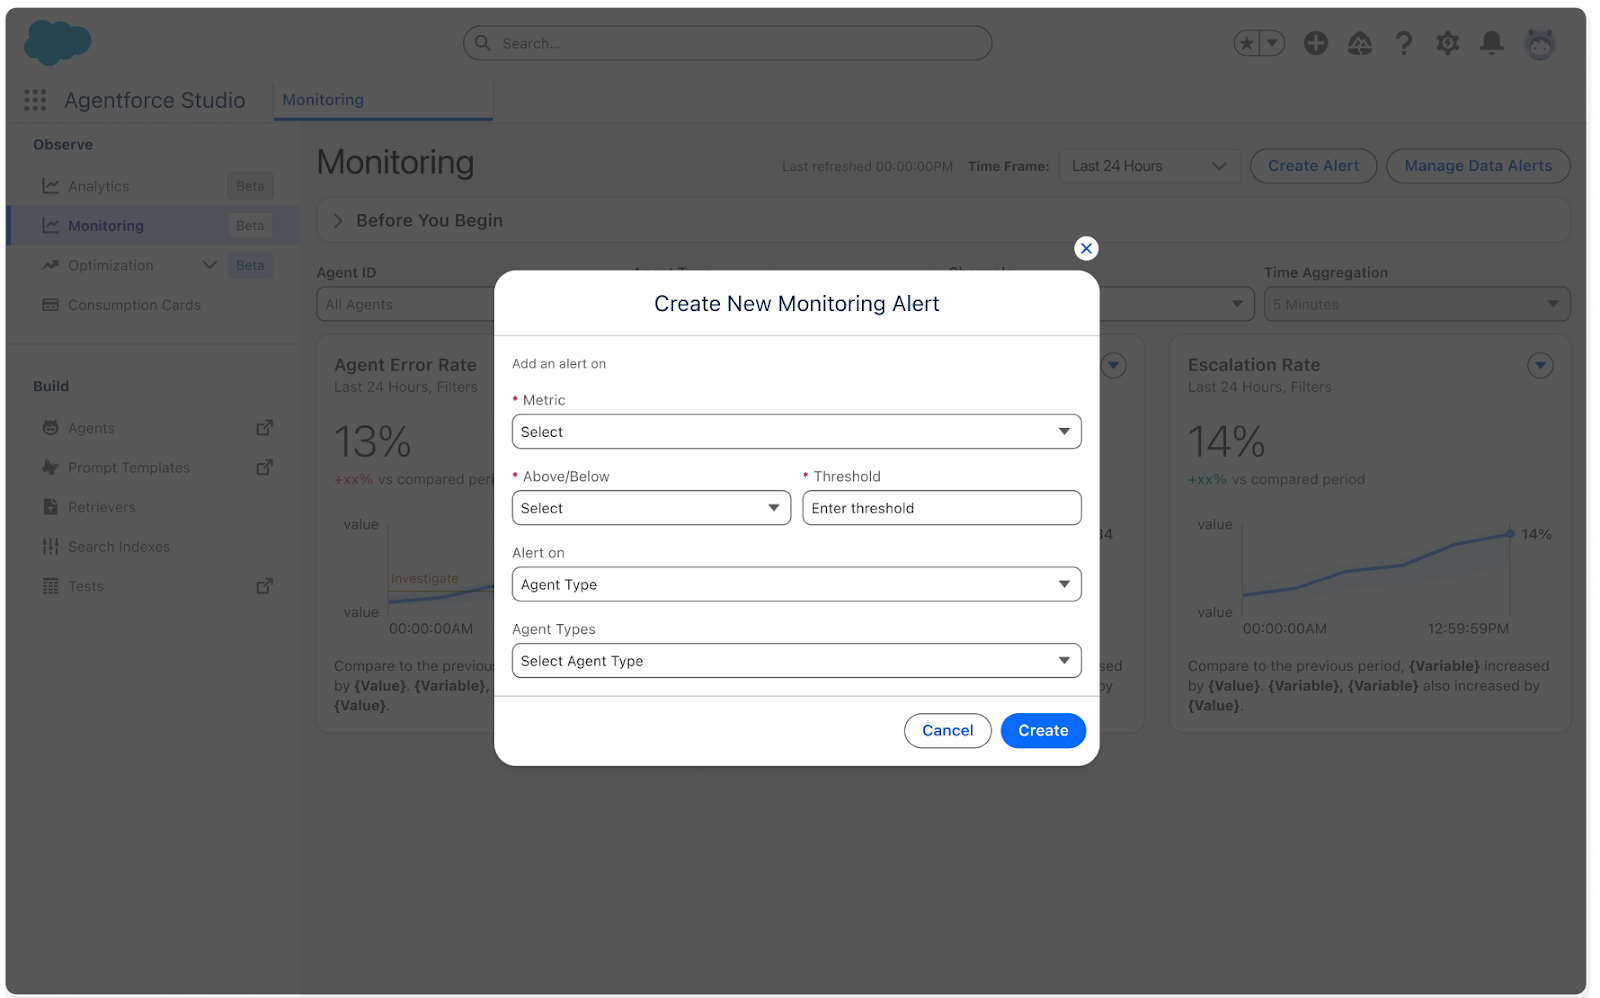
Tableau Next: Agent Performance Alerts
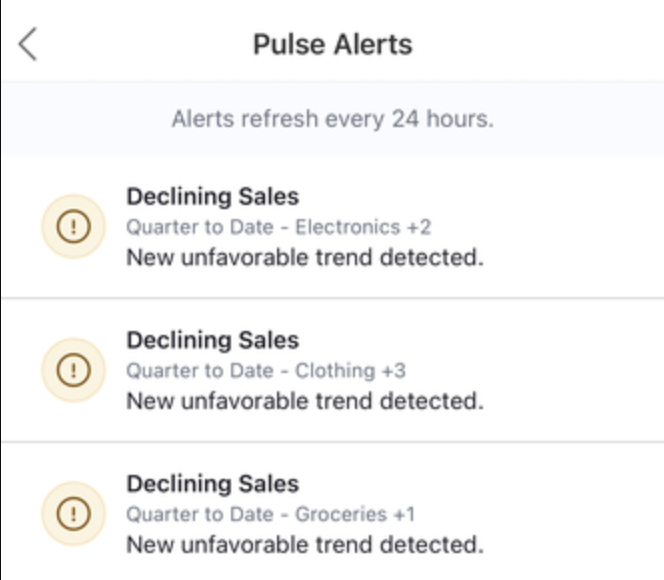
Gain near real-time visibility and trust signals on your deployed AI agents through proactive data alerts on agent performance. Set alerts and receive notifications to get ahead of potential agent issues.

Tableau Next: Heat Map
Find relationships and hotspots in your data. Heat Map visualiations make it easier to spot complex patterns and gain a deeper understanding of your data.
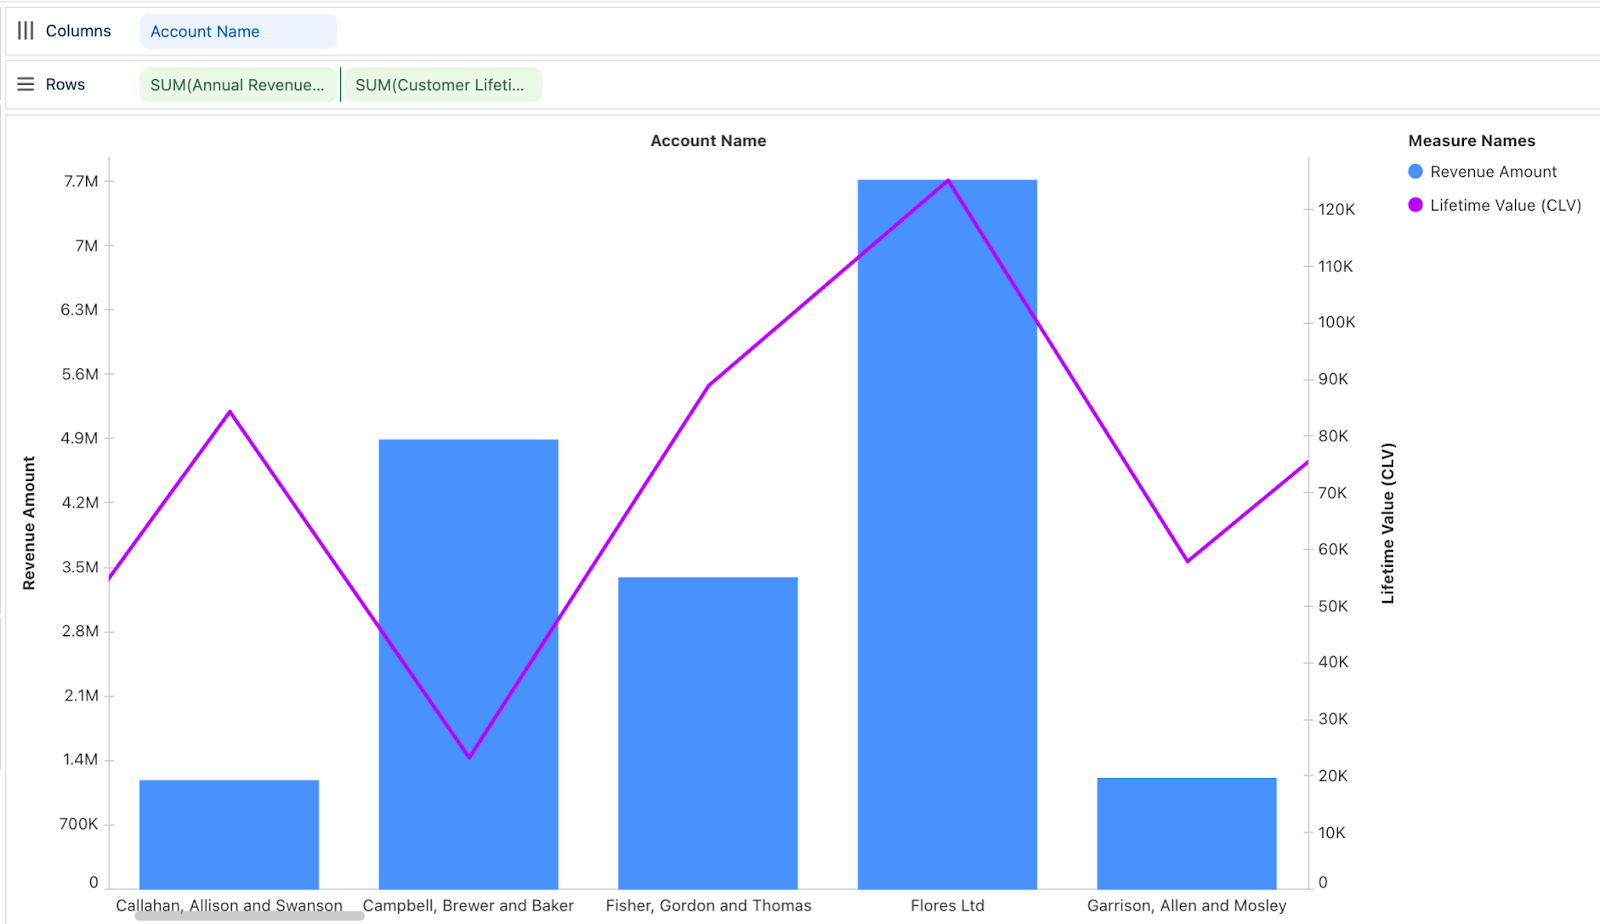
Tableau Next: Dual and Sync Axis
Compare two different measures on the same chart using different Mark Types. Visually analyze the correlation between metrics in a single view for better understanding.
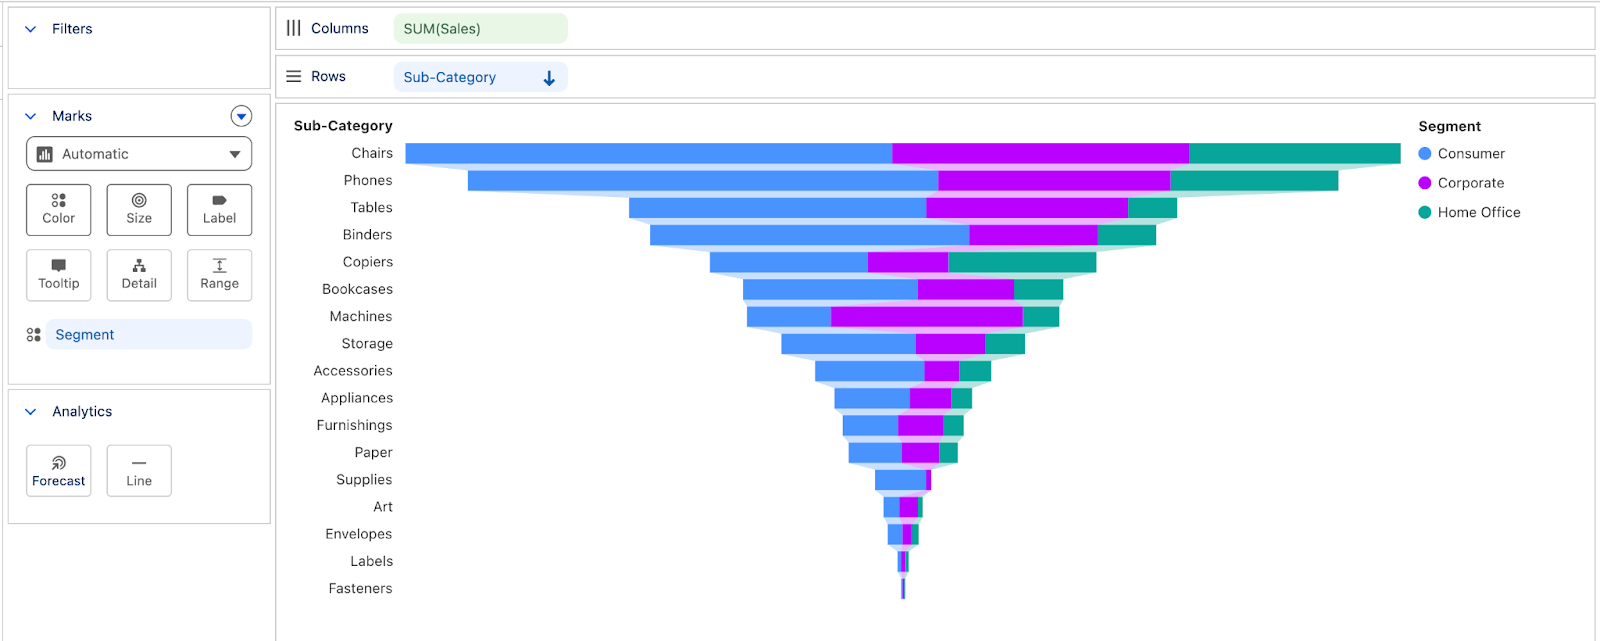
Tableau Next: Funnel Chart
Clearly track conversion rates to easily identify and address customer drop-off points. This enhanced visualization enables users to optimize specific business processes and address key challenges.
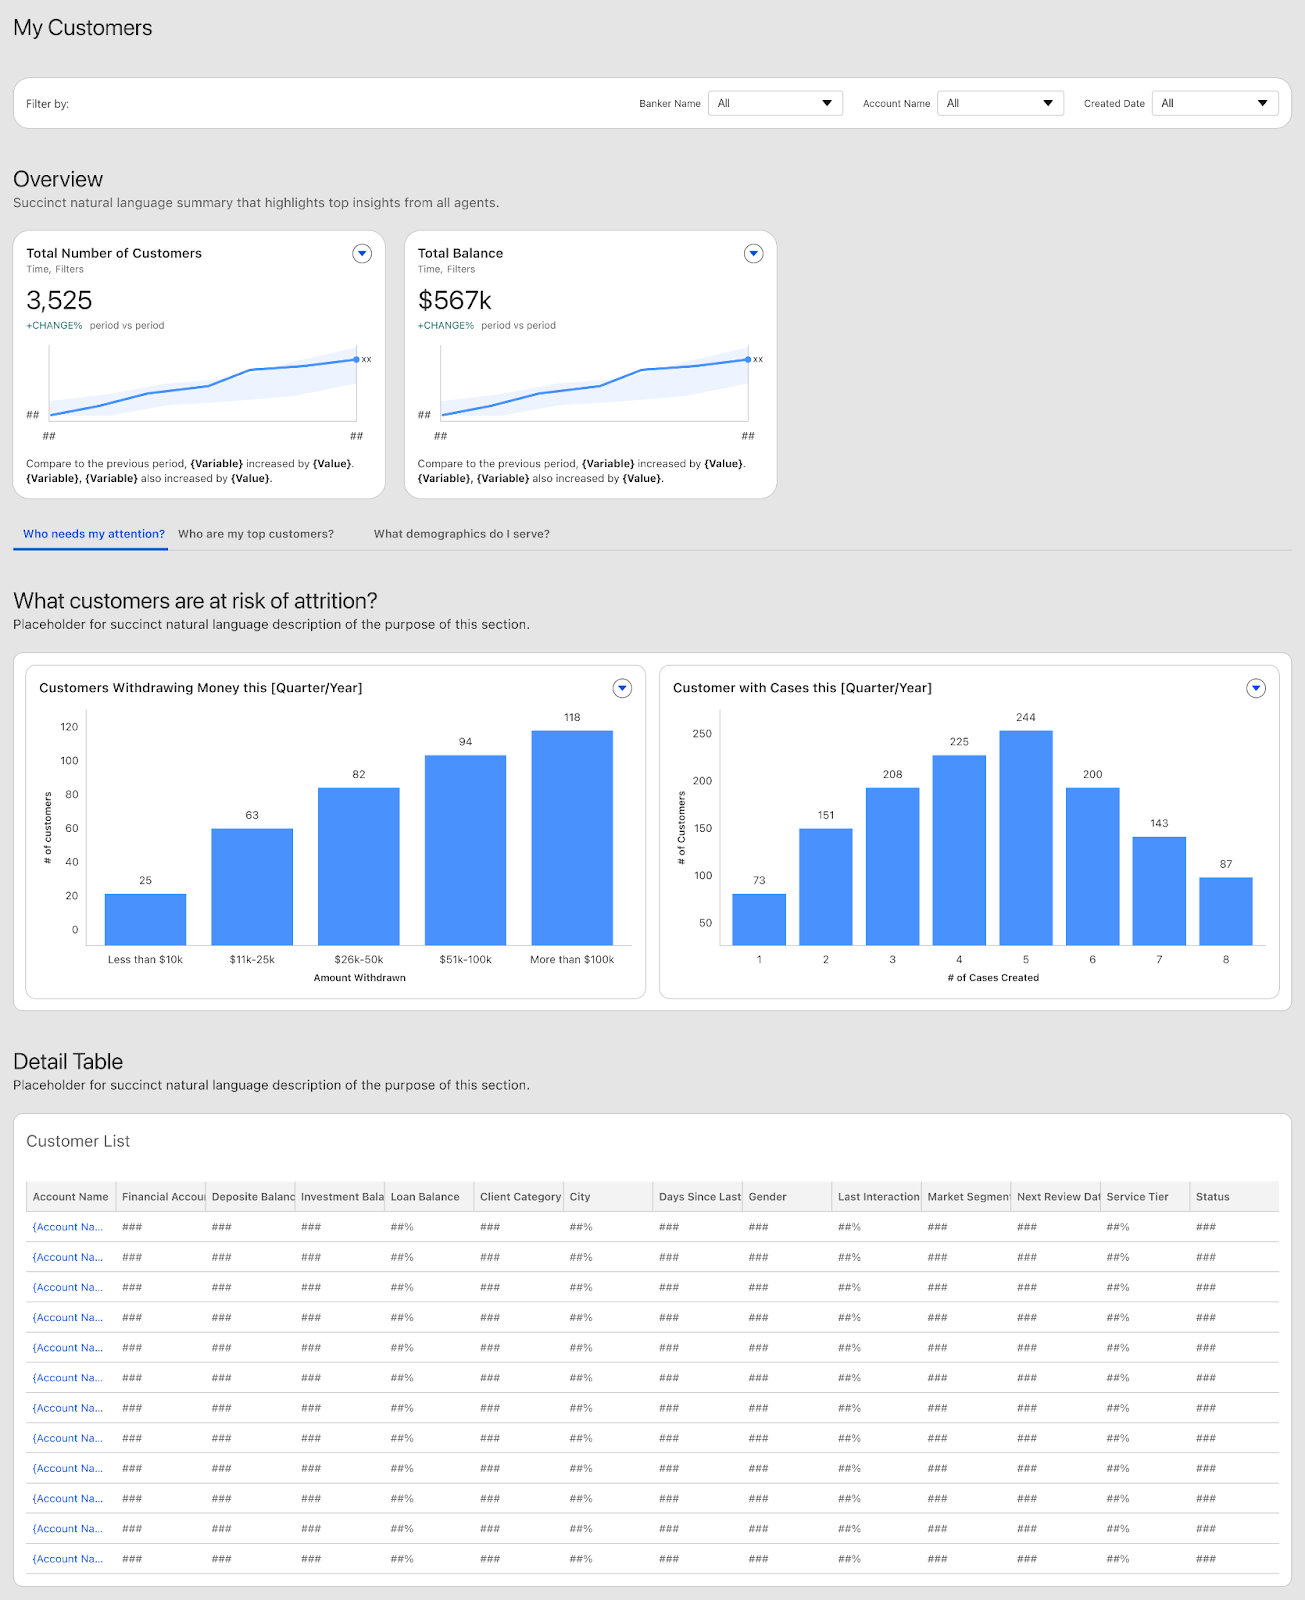
Tableau Next: Financial Services Insights App
Leverage this pre-built app for Salesforce to empower your branch managers and retail bankers with insights to build the banking business. Increase referral conversions, accelerate loan applications, and build customer retention.
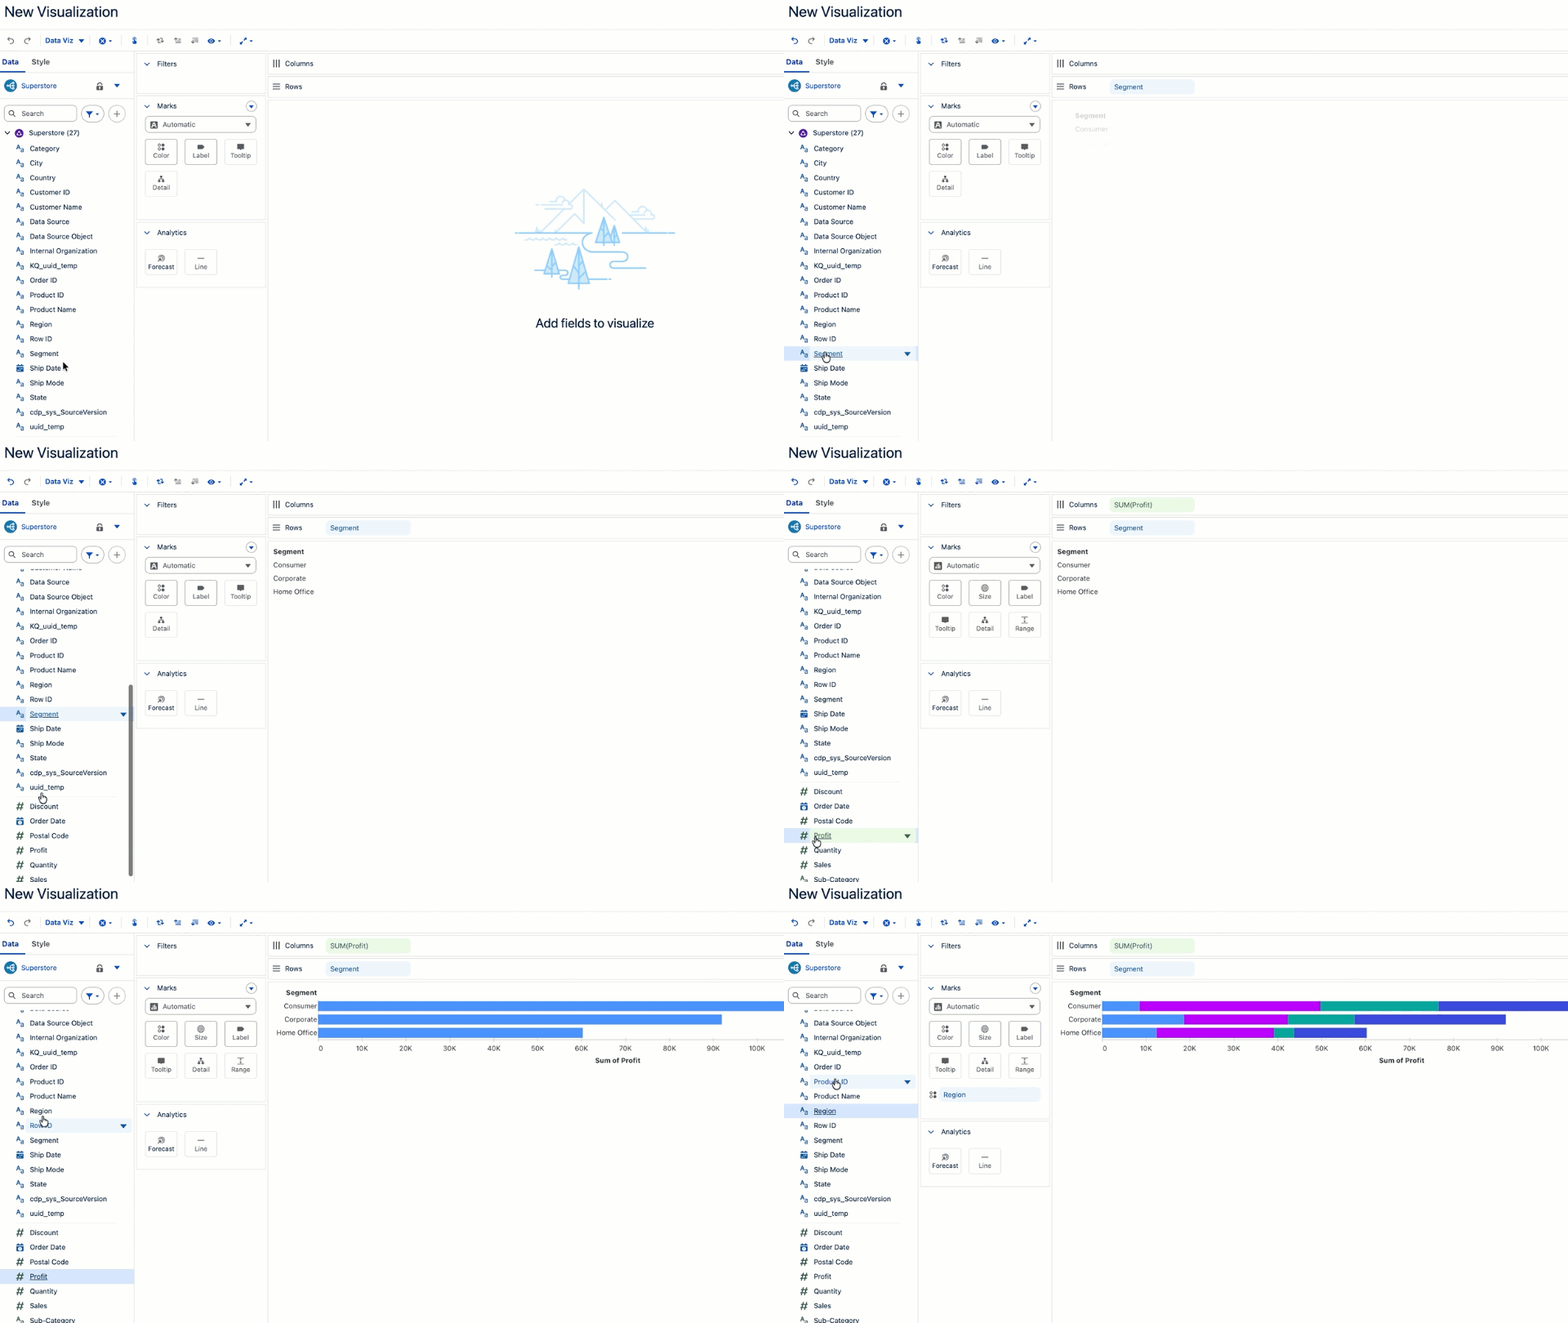
Tableau Next: Productivity Shortcuts
Increase your authoring efficiency with new productivity shortcuts. Double-click data fields to quickly add them to your visualization and hide or show labels from the Toolbar. These shortcuts enables you to quickly create new vizzes and explore your data more efficiently.
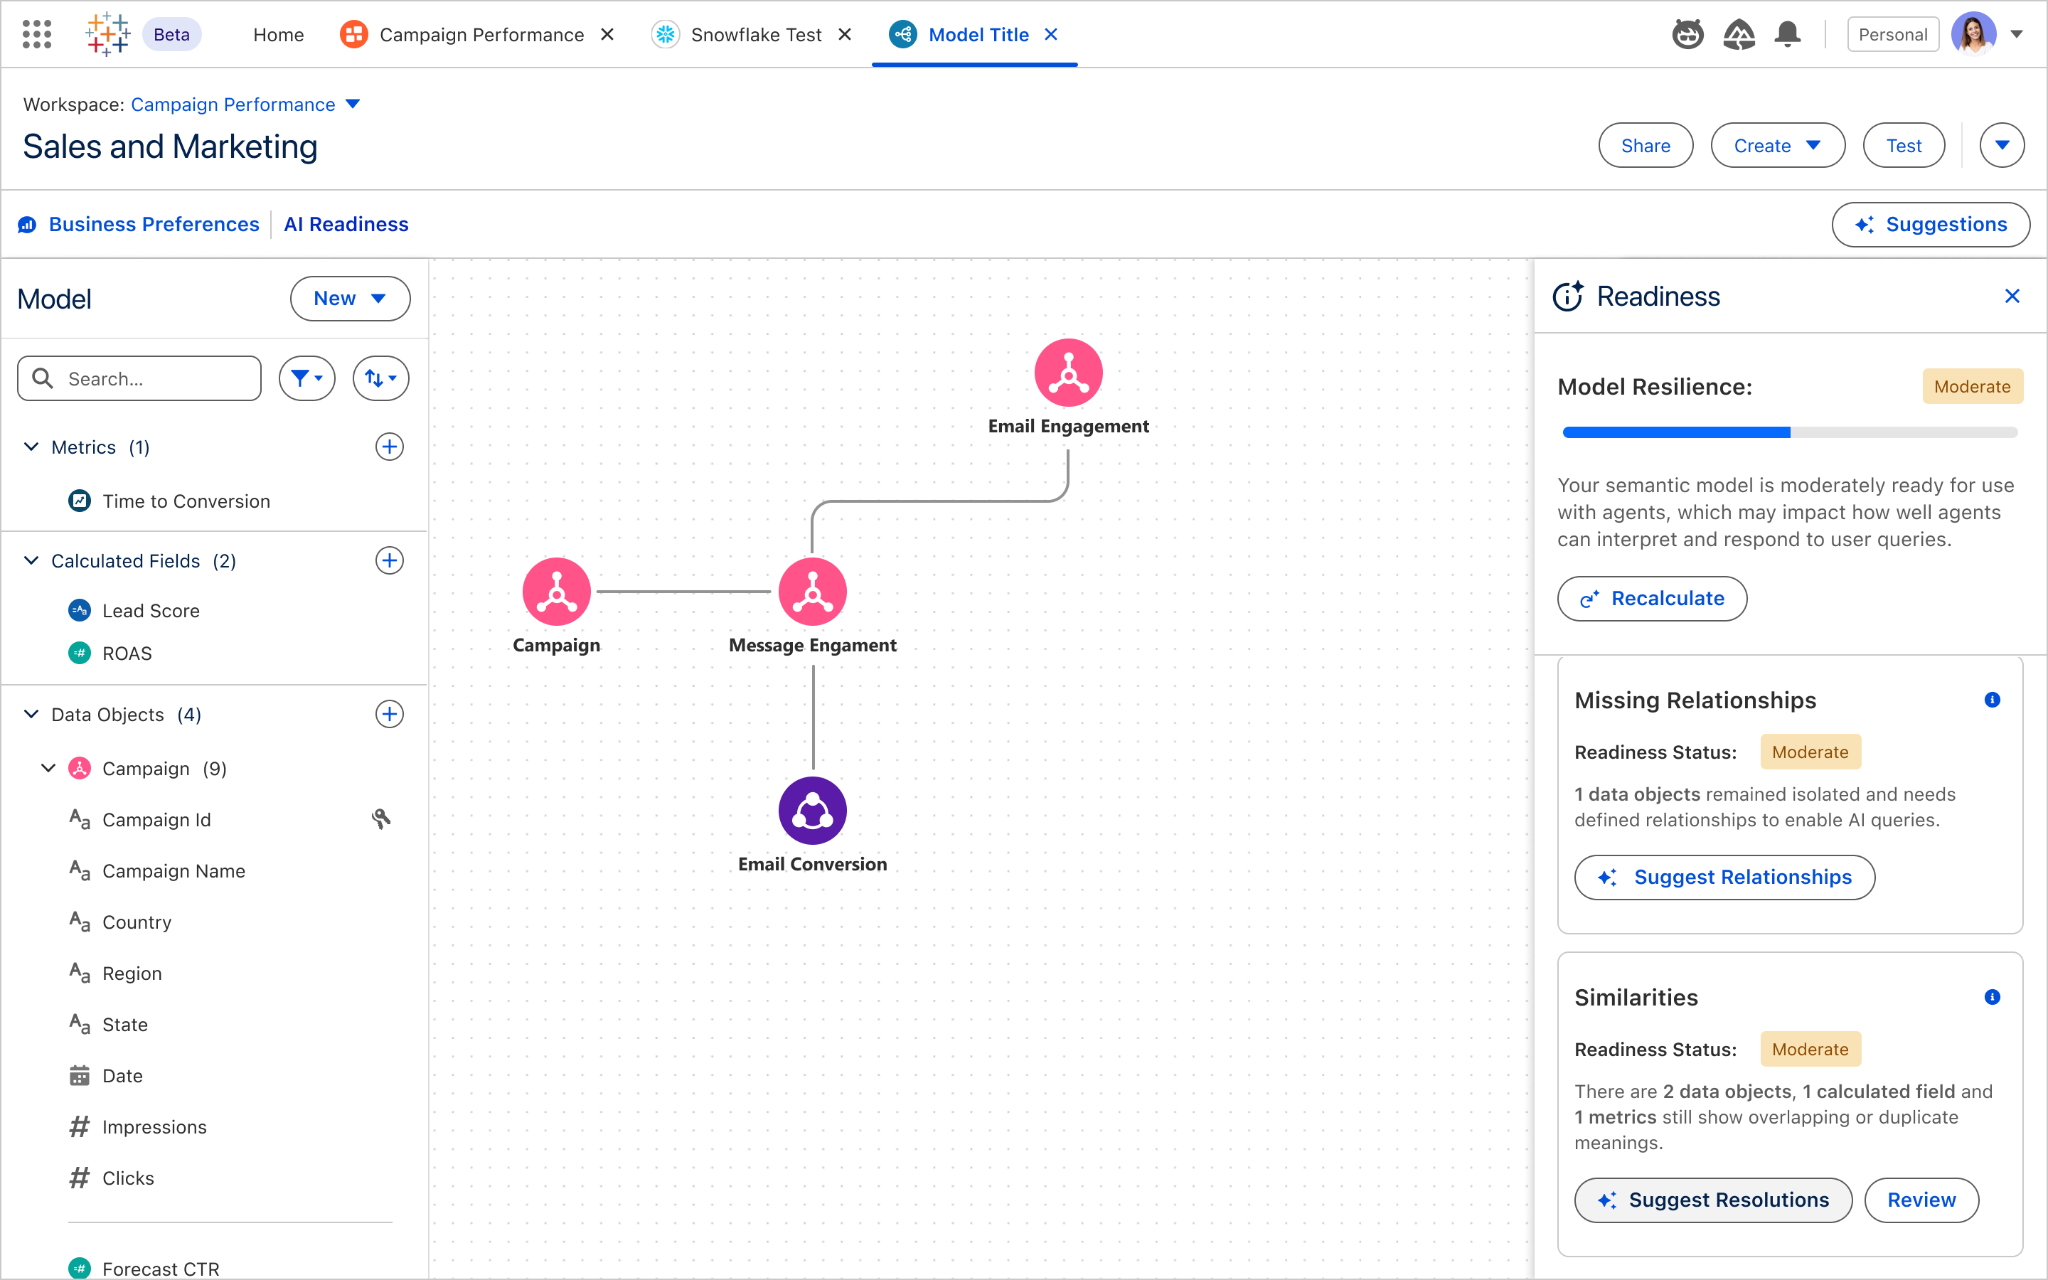
Tableau Next: Semantic Model AI Optimization
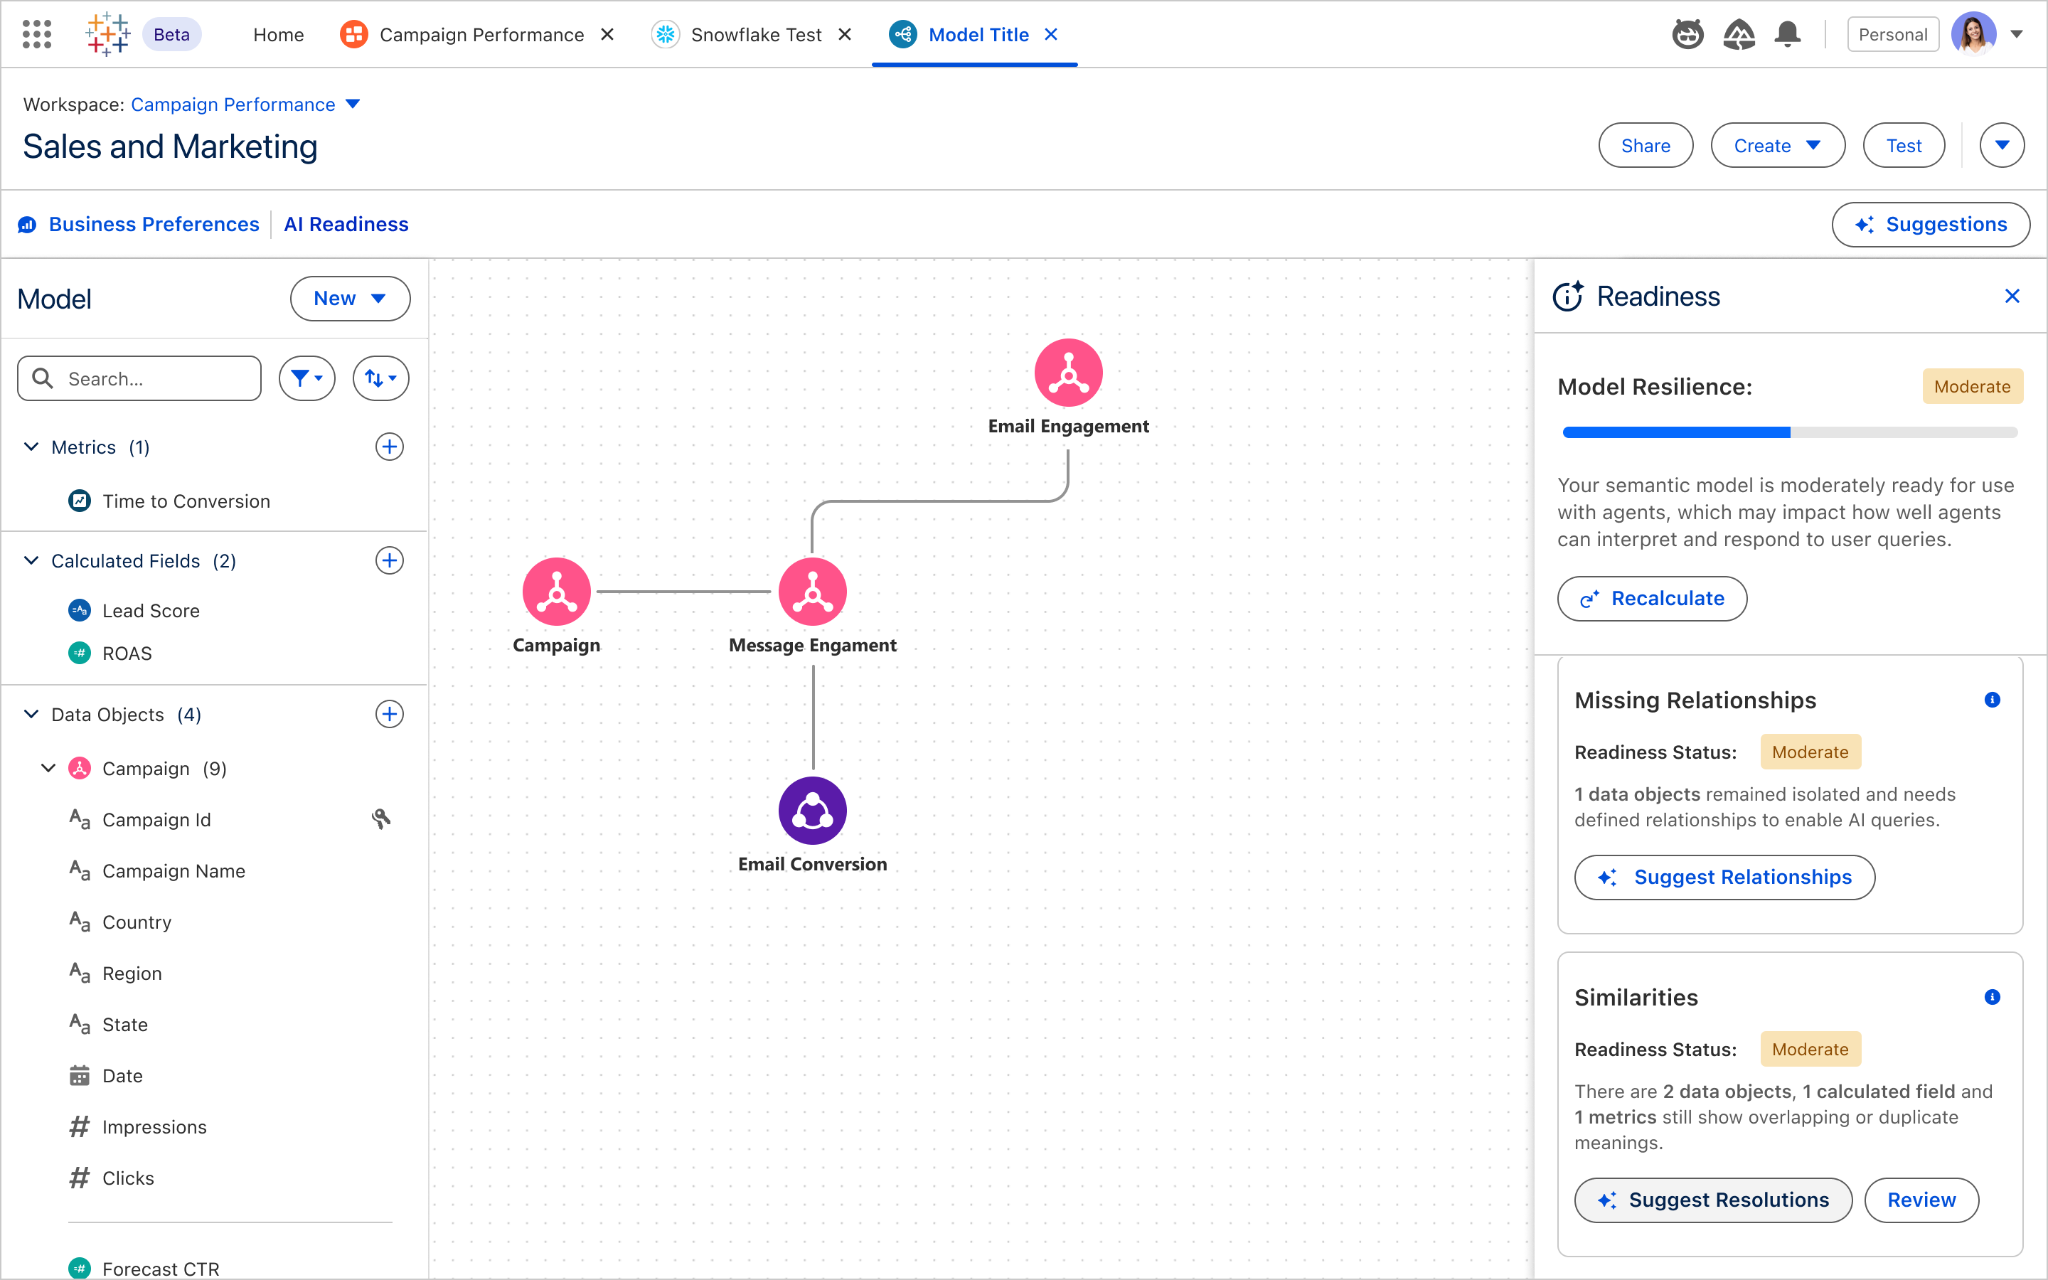
Optimize your semantic model for better agent performance with Semantic Model AI Optimization in Tableau Semantics. Get a health score along with AI-powered suggestions, ensuring agents interpret and respond to your queries more accurately.
Now available in Beta.
