With a global economy, multi-location businesses, and countless e-commerce companies making it possible to sell and purchase goods from any connected device, there’s an abundance of location data in the world. Also, the proliferation of mobile and wearable devices means more people are growing curious about the “where” and “why” of their data. All these factors considered, demand for interactive maps is growing, particularly those related to location data—and it's crucial that businesses start to incorporate maps into their business intelligence activities. Since many decisions are driven by geographic data, there is more opportunity to see how location intelligence enhances analytics for businesses, governments, utilities, and other organizations or audiences. This overview covers what location data is, how it’s used, and some challenges to consider when using it as part of your overall data set.
What is location data?
Also known as geographic information or geospatial data, location data refers to information related to objects or elements present in a geographic space or horizon. There are two basic types of location data: vector data and raster data.
- Vector: This form uses points, lines, and polygons to represent features such as cities, roads, mountains, and bodies of water that are mapped and stored in geographic information systems (GIS).
- Raster: This form uses cells to represent spatial features. An example would be remote satellite data.
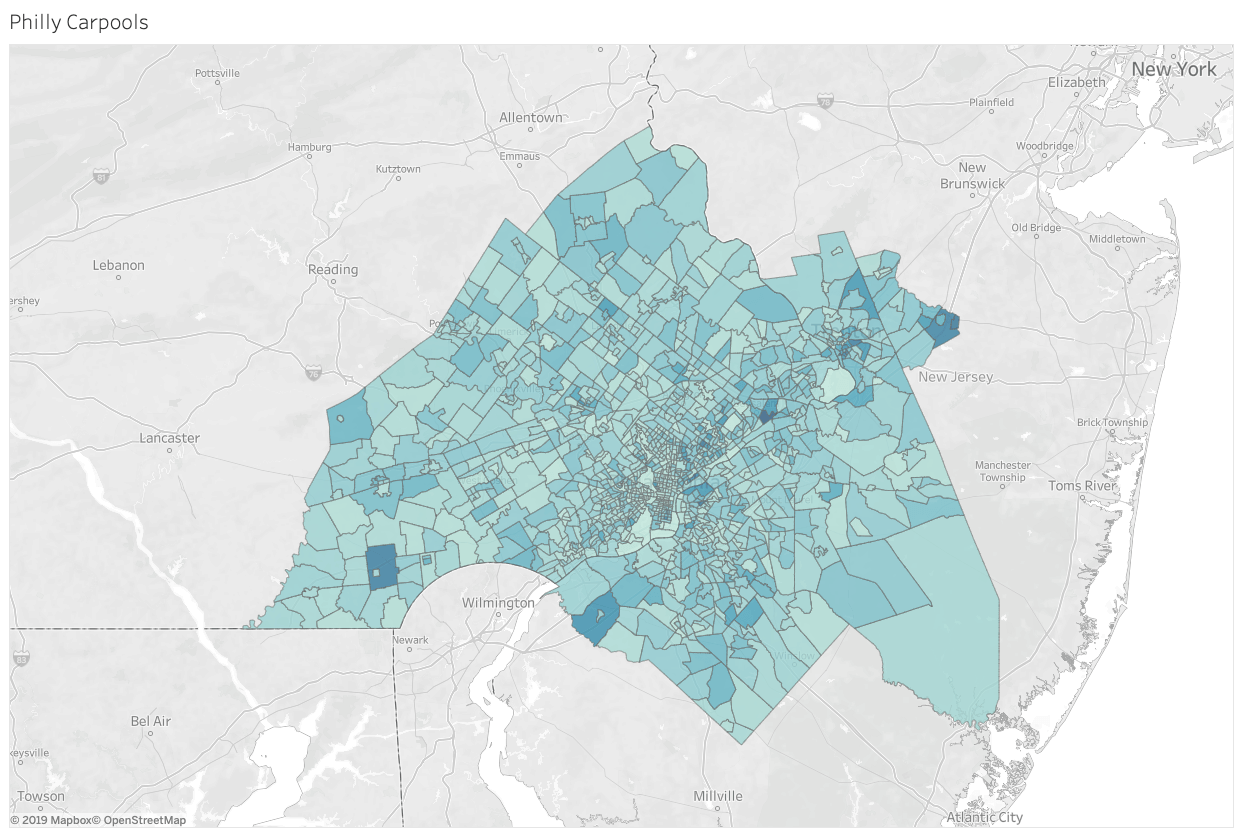 Map using location data to show concentrations of carpools in Philadelphia. Visualization by Kent Marten. Have you ever looked at a map of crime in the city where you live to see what areas have the highest rates? Or for business, perhaps you need to understand what products perform better in certain regions or if there are inventory level differences in one part of the country. When looking at maps, people inherently start turning the map into information by drilling into the contents—uncovering patterns, reviewing trends, or making decisions based on what they see. This is called “spatial analysis” and it’s what our eyes and minds do naturally when we look at maps.
Examples of data visualizations that use location data
Technology advances are improving our ability to capture more location data every day. While previously only plotted on a physical map, the list of map types grew as this type of data and different technology (i.e. mobile devices, location-based services, etc.) evolved. Here are some common data visualization types that use location data:
Create beautiful visualizations with your data.

How location data enhances a data set and your analysis
Bringing location data into a dataset provides context to your analysis in ways that aren’t always detectable on a spreadsheet, linear graph, or pie chart. This context also leads to better prioritization, planning, and execution of objectives. For example:
- Connect data points to real-world boundaries: Let's say you work with communities to analyze waterfowl sightings in watershed basin areas. You want to know how many birds were spotted in each individual watershed. You have polygon data outlining locations of watershed basins and point data that records waterfowl sightings, but with spatial joins (a function available in some analytics solutions), you can combine location data from bird observations with watershed boundaries to find your answer and analyze further.
 This visualization created by Kent Marten combines shape files of city blocks with individual records of wells using spatial joins.
- Combine chart types for fast understanding: A map combined with pie charts can also reflect percentage analysis across regions. If you’re in sales, this can be useful as you evaluate relative volume of sales in certain geographies and how that influences strong or weak business profitability.
- Create a story with dashboards: Combining maps with time trends and other charts within dashboards helps uncover patterns, supports stronger predictive analytics and forecasting, and helps people more easily identify outliers. For example, the visualization below by Timothy Vermeiren shows how weather affects different cities depending on their proximity to the equator along with the position of the earth and its orbit around the sun. The combination of charts and maps helps the audience relate the information to their experience.
 Dashboard showing how position on earth relates to weather. Visualization by Timothy Vermeiren. To learn more ways to apply location data in mapping for stronger exploration of the details and to see how it’s possible in a solution like Tableau, read this page on mapping solutions.
Challenges to consider when using location data
While there are plenty of benefits to leveraging this type of data in your overall set, there are some challenges to bear in mind, too. For example:
- Big Data and the Internet of Things = technology restrictions. As digital data grows, it’s easier to collect location data. But you may have resource constraints when it comes to storing and analyzing all of this data.
- Abundant sources means more data & more formats. Ingesting location data, verifying its accuracy, and avoiding generalizations can be tricky. It is essential to find the right technologies that prioritize data governance, allow you to narrow large sets of information, and uncover key details.
- Data privacy. Privacy is critical when working with geographic information where individual identifiers are present (or possibly present in data sets). It’s important to have governance and data ethics measures to prioritize and manage privacy policies.
- Intellectual property rights and licensing. There are intellectual property rights to consider, and when using certain data, a license might be required. You need to employ skilled experts that understand issues like data conflicts, rights, and licensing, know how to solve them, and can extract meaning and value from the data.
Location data is an incredibly useful resource when properly analyzed. The first step is to choose an interactive platform that offers maximum governance with the flexibility to use multiple sources, custom filters, and the ability to perform a diverse set of analyses. If you do your homework and lay out must-haves before choosing the platform to best suit your needs, you’ll know the potential opportunities and challenges that lie ahead. And in the end, you’ll uncover powerful insights and important stories combining location data with all your other important information.