Viz Roundup: Endangered Animals, Baby Names, & Austin's Startups


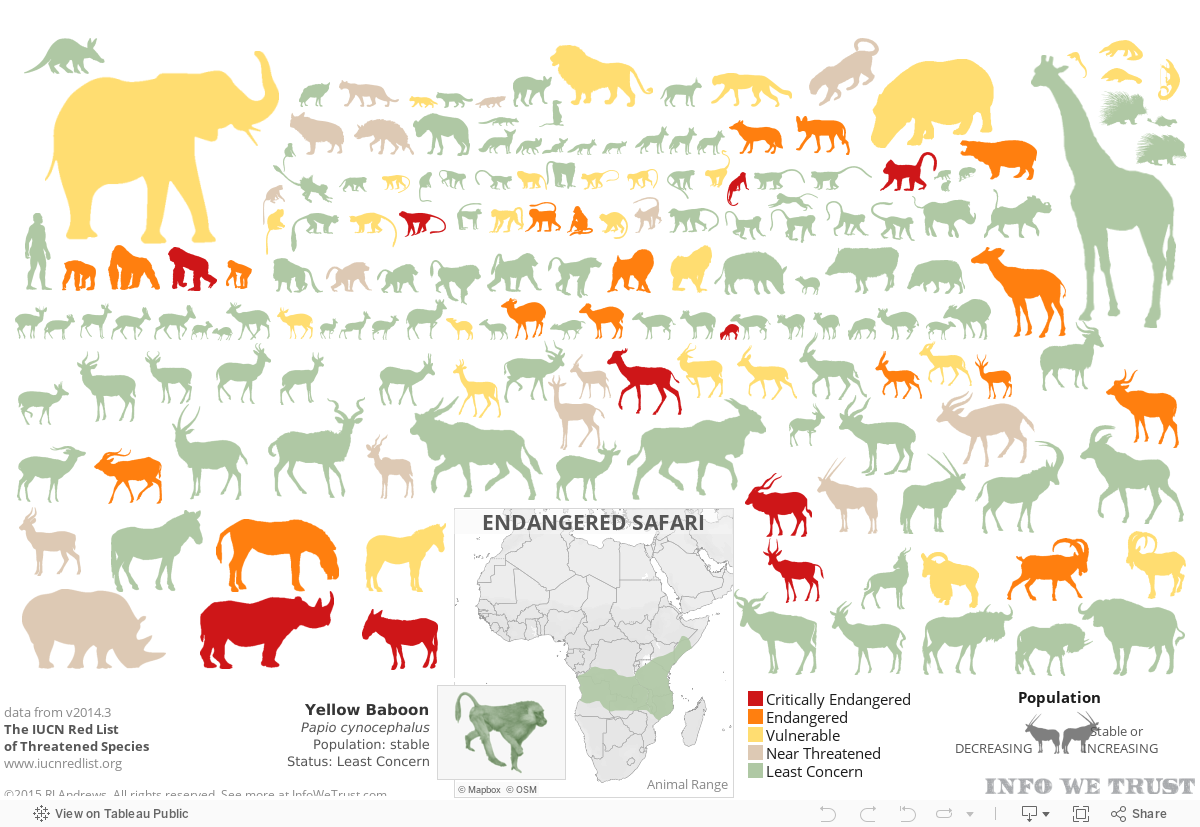
Endangered Safari
RJ Andrews of Info We Trust illustrated the population stability and endangered status of large African mammals. Animals facing left are decreasing in population whereas animals facing right are stable or increasing. RJ's use of color emphasizes the most crucial information while his use of shape and placement make this visualization delightful to look at.
Chicago Crime Scene
Tableau Picasso George Gorczynski visualized crime in Chicago in this innovative and highly-designed Story Points visualization. George set the tone with a gruesome color scheme, and included enriching elements like an embedded Twitter feed that reports Chicago homicides. With a map of hot spots and crime trend charts, George made a winning viz that is both beautiful and digestible.


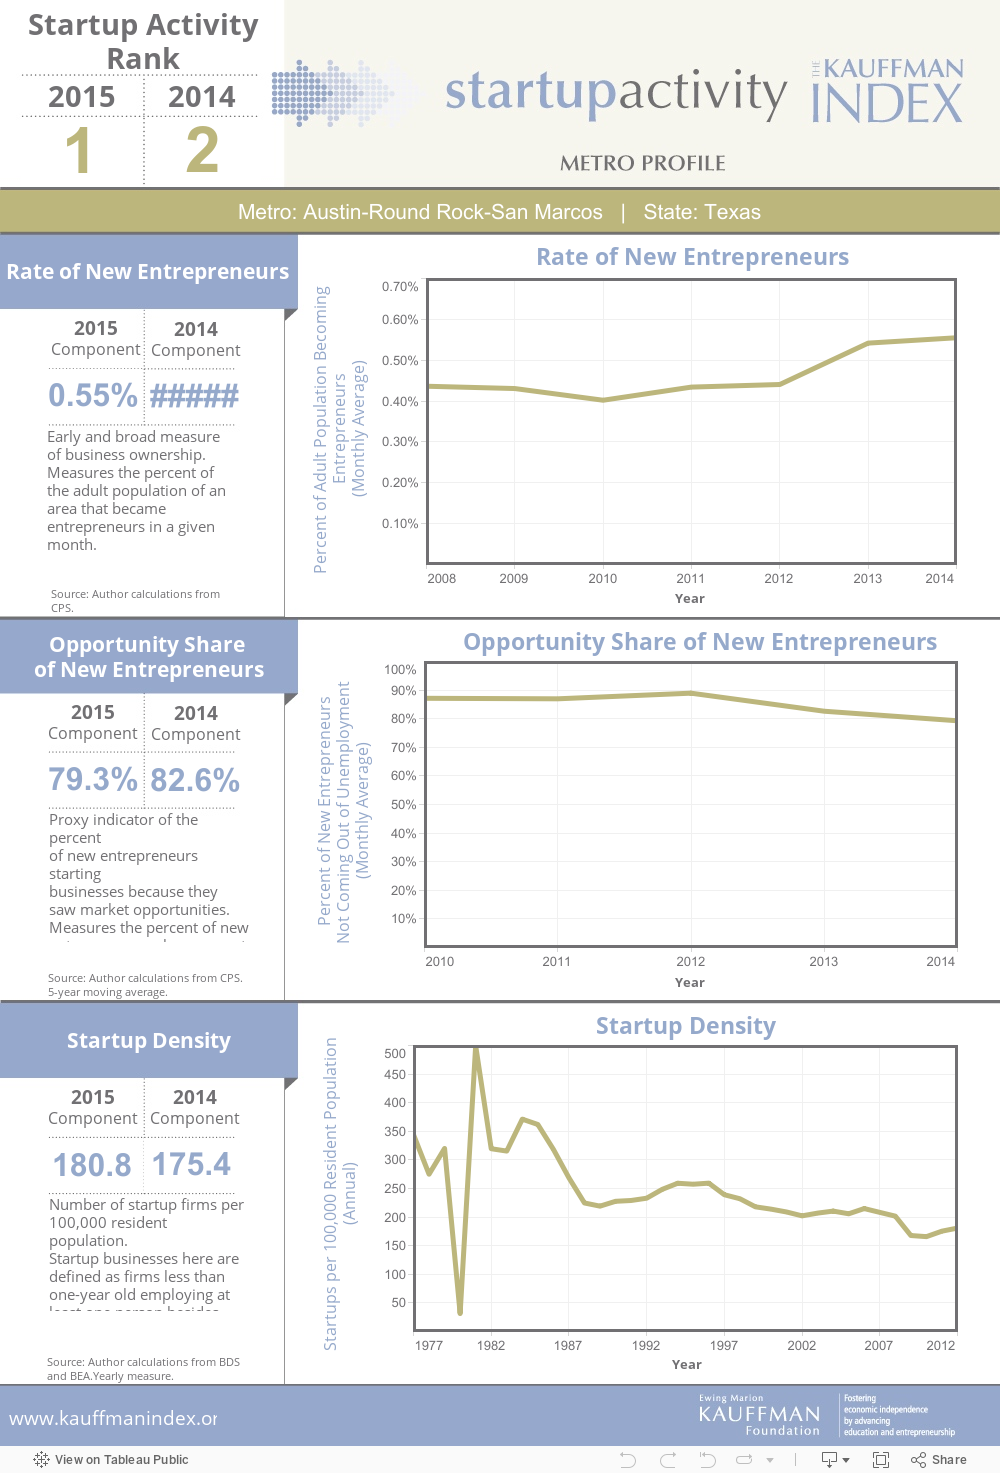
Startup Activity in Austin
Austin, Texas has overtaken Silicon Valley as the number one city for startups, according to the Kauffman Index. This viz by Kauffman shows why Austin is such a great place for startups. It tracks Silicon Valley-tinged metrics like Rate of New Entrepreneurs and Startup Density. (This viz was originally published in the Austin Business Journal.)

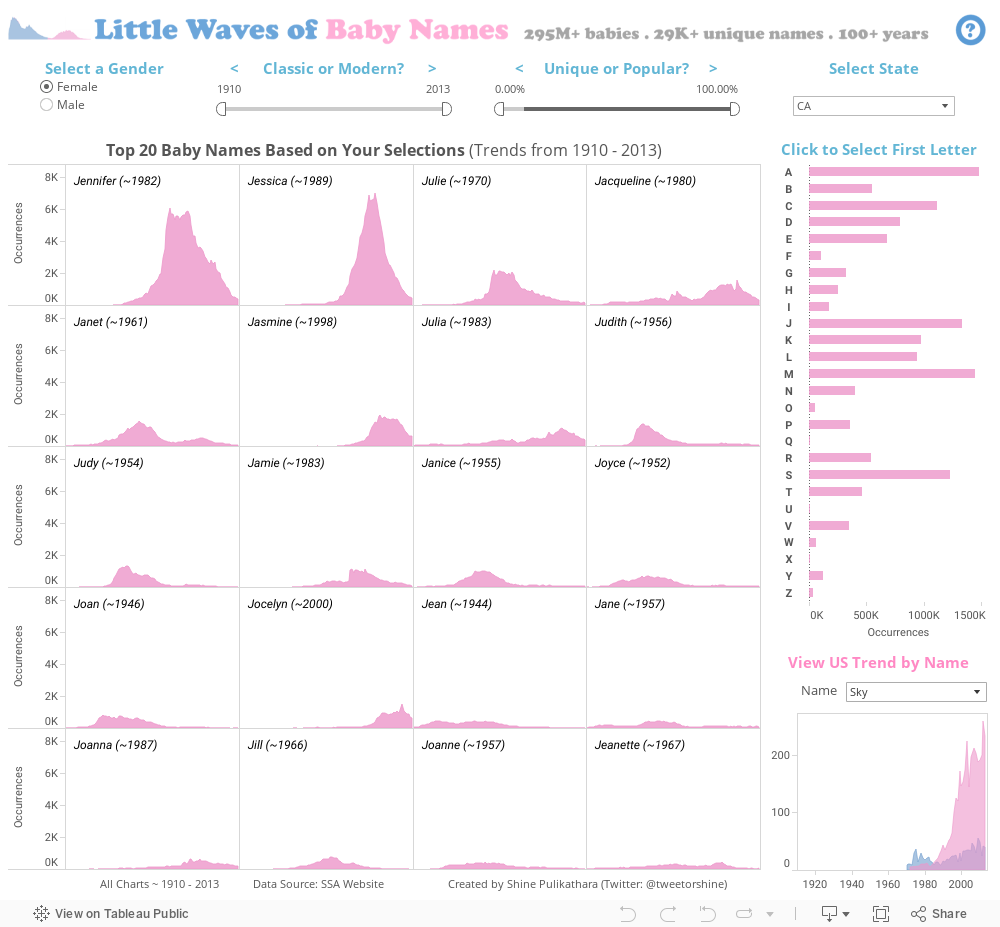
Little Waves of Baby Names
Shine Pulikathara took a stab at the SSA Baby Names database with this visualization that filters down to the top 20 names based on the parameters you choose. Shine's use of small multiple area charts allows the user to quickly compare different frequencies between names. Plus his color scheme is adorable.

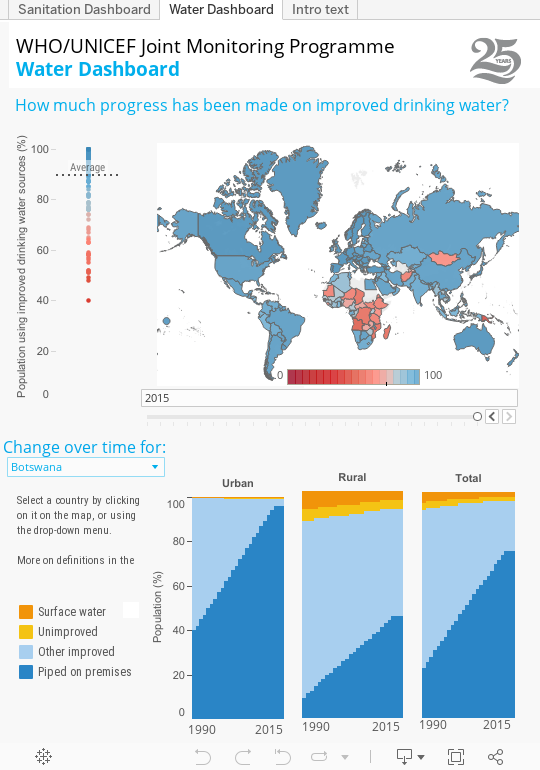
Progress on Sanitation and Drinking Water
Late June, the WHO/UNICEF Joint Monitoring Programme for Water Supply and Sanitation launched its report titled Progress on Sanitation and Drinking Water: 2015 Update and MDG Assessment". This viz summarizes the data from that report and shows how far different countries have come, in the past 25 years, in terms of sanitation and improved drinking water. Notice the use of the percent area chart—an apt way to show changing proportions over time.

We hope you enjoyed these vizzes. Follow Viz of the Day on Twitter for daily visualizations.