How NGOs Are Bringing Data into Myanmar’s Burgeoning Democracy


When Myanmar’s newly-installed government conducted its 2014 census, many of the country’s newly-elected leaders and NGOs were fearful of the impending release of data.
They were not concerned about of what the figures would show about the country in the immediate aftermath of military rule. What worried them was the potential for a wave of violence as the result of people not understanding what the data was showing.
You see, the last time the government conducted a census was in the mid-‘80s, and the military government dramatically undercounted the country’s Muslim population. The country has struggled with Muslim-Buddhist tensions for decades, and a variety of civil wars among permutations of the 135+ ethnic groups have been a feature of life since the end of colonial rule in 1948. The conflict between Muslims and Buddhists has grown increasingly violent in the last half decade.
The fear in 2014 was that if the teams accurately reported the Muslim population census, it would look like an extreme increase relative to what it was before, even though it was not true. The newly-elected leaders were afraid of what taking these numbers at face value would result in riots and violence.
The government eventually did release the data, but has been careful to contextualize it by showing that the overall population figure has grown, not just the Muslim portion. And data visualization has been critical in that process.
“By being able to visualize and understand that data, it helps give context and helps people understand and appreciate and approach these situations in ways they wouldn’t have before,” says Chris Rothschild, a researcher with the University of Washington’s Technology and Social Change Group (TASCHA).
Rothschild and other researchers from the University of Washington have spent the last year working with Burmese NGOs, and increasingly the government itself, to inculcate data-based decision-making into democratic civic life after a decades-long absence.

Ensuring that data is a part of Burmese society is more than just visualizing census data, though. It requires a careful effort of community education—a task that is complicated exponentially by the rapid spread of internet-enabled mobile phones across the country.
Myanmar went from under 10% mobile phone penetration to more than 80% in just four years. And across the country, the “internet” is primarily just one application, Facebook.
“They like it because it is interactive and they can have their own voice, take control of what is going on," says Rothschild.
The mix could certainly be combustible—highly-personal social media in a place with longstanding ethnic conflict and a limited understanding how to view what appears on the screen with reliable facts and data. That is why the UW TASCHA has brought together a group of Data Fellows from several civil society organizations. With support from the Tableau Foundation and volunteers, the group is building data analysis and storytelling training that can be replicated across the country.
Even the training itself required some special consideration. For most of the fellows, their understanding of data itself was undeveloped.
“We were teaching folks about Excel and Tableau all at the same time,” says Tableau senior product consultant Lauren Bearden, who volunteered to travel to Yangon for the training. “What first seemed like a problem actually turned into an advantage. Because they were developing their understanding of data storage and visualization at the same time, they picked up on the connections much faster.”
Rothschild also saw the pace of learning pick up when the group started digging into local data.
“One of the things we found is that things are So context-specific in the country, and unless you have a Myanmar-specific resource, it won't be relevant,” he says. “We were most effective when we could say, ‘This is the theory, and here is how it specifically applies to you, your data, your practices, interests, and culture.’ It made the training meaningful.”
And the TASCHA team is hard at work on the next phase of the project, which will include bringing the trainings to regional centers. It will also include more collaboration with the National Statics Office and the Ministry of Information, both of which appreciated the work being done by these civil society organizations.
“We’ve tapped a genuine hunger for good information,” says Rothschild, noting Myanmar’s unique history as an access-denied culture with very limited resources has led to a culture of collaboration.
“A lot of civic life has been built on horizontal networks because that is the only way they could get things done, by working together,” he says. “There is a good sharing culture within the country. It is another thing we can build off of.”
With the initial trainings behind them, several of the partner organizations have begun to use the data visualizations in their own work. Below is a brief look at four who have stood out.
Visualizing Civic Life in Myanmar
Myanmar Book Aid and Preservation Foundation (MBAPF) — This group is working to position the country’s 7,000+ libraries as hubs for connectivity to reach everyday people. Even throughout the years of military rule, the libraries were seen as an impartial source for learning and played a strong role in community life.
These maps have been used by MBAPF to show the reach of the library system within the country and lead constructive discussions with the government and funders about expanding the network.

Enlightened Myanmar Research Foundation (EMReF) – Historically, Myanmar’s government didn't share much election data, even at a national level, which severely limited people's understanding of the country’s politics. Although the data is now technically public, the majority is not provided online, let alone able to be meaningfully explored.
To build that civil discourse around electoral engagement, EMReF spent months compiling, cleaning, and analyzing census, population, election, and parliamentary data. The organization is now visualizing the data to inform discussion about the path forward.
Within that collection, the parliamentary data from individual states and regions are particularly important. This data has never before been accessible online, so visualizing it on the EMReF contributes immensely to understanding the transition to democracy at the local level.
These select visualizations explore the engagement level across the country.


Myanmar Information Management Unit (MIMU) – This group partners with several UN organizations to gather, analyze, and present information required for the management of humanitarian and economic development programs in the country.
Under its mandate, MIMU tries to work with information at the most granular administrative level possible—cities, townships, even villages—and present those data sources, visualizations, and maps back to UN, NGO, and donor and government decision-makers.
Working with partners like Mapbox and Tableau, MIMU has become the main geospatial analysis agency for the country.

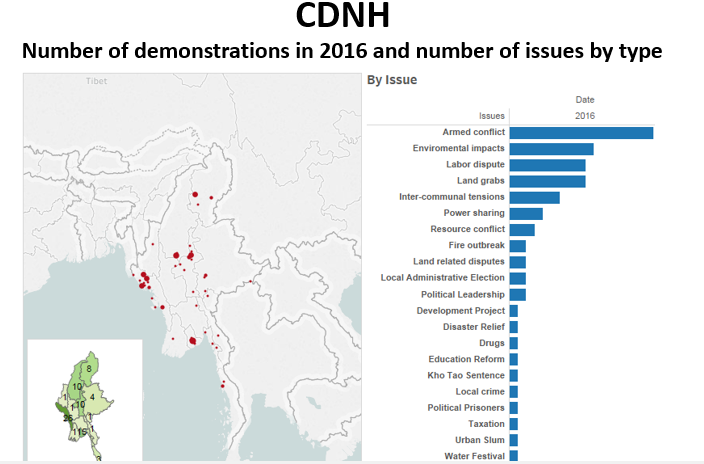
Center for Diversity and National Harmony (CDNH) - Operating at the intersection of historic intercultural conflict and an explosion of new social media outlets, CDNH’s promotion of tolerance, diversity, and community education is vital for a future peace in Myanmar. To first understand and then to act, the organization has been manually monitoring and recording—and, as of recently, visualizing—incidence of hate speech and incitements to violence on Facebook from across the country.
While the sensitive nature of these dashboards makes them impossible to share with the public, these snapshots show the location, nature, and volume of relevant posts.

Know of an organization using data to change the world? Tell us in the comments below.
相關文章

Iron Viz 2026: Read Between the Data
 2026/05/28

Tableau's Iron Viz Winners

Explore the 2026 Iron Viz Entries
 2025/12/15