Viz Roundup: Seed Storage, Zika Virus, and the Beatles


Our latest viz roundup is a parade of maps—plus one very impressive Beatles-playing viz about (who else?) the Beatles. The Tableau Public community visualized a variety of issues ranging from the spread of the Zika virus to the price of attending Super Bowl 50. Here are just a few of the many impressive visualizations.
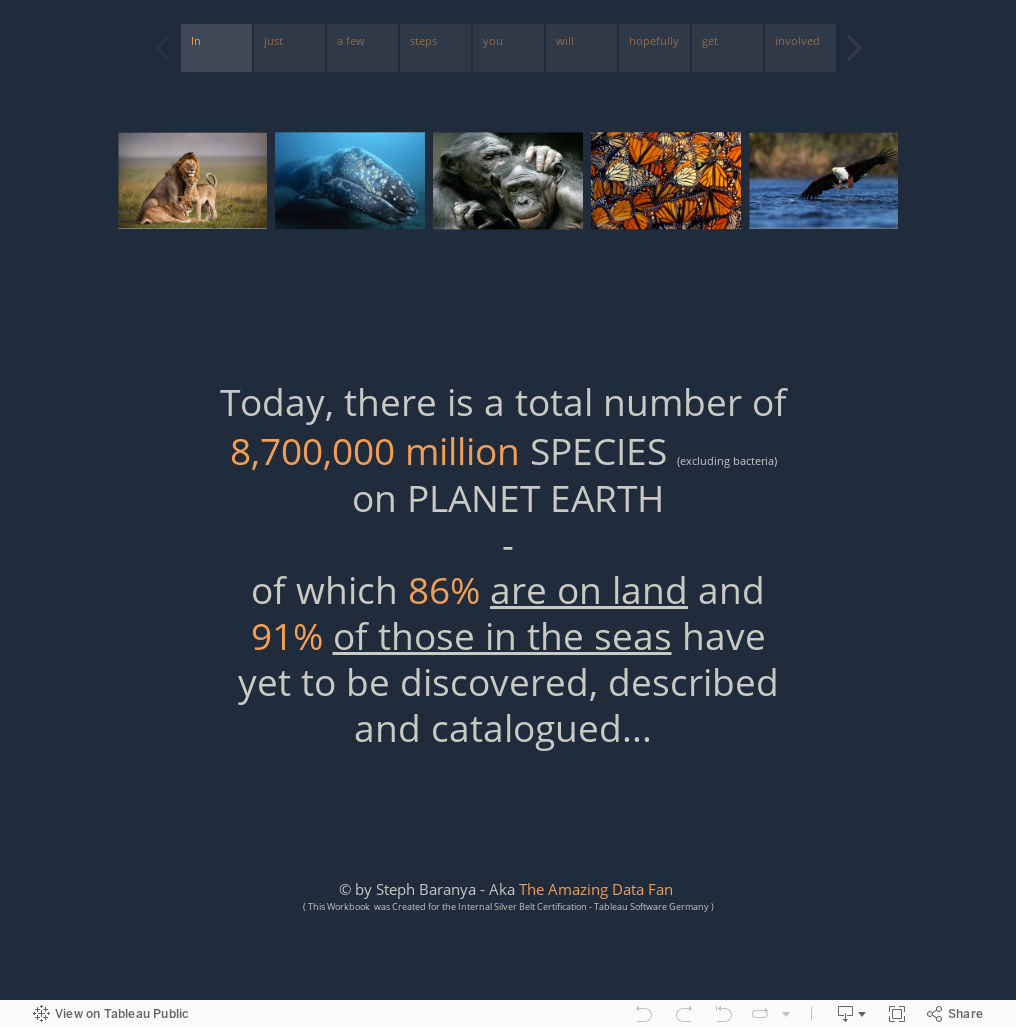
The Svalbard Global Seed Vault
Some 1,300 kilometers beyond the Arctic Circle is the world's largest secure seed storage opened by the Norwegian government in 2008. From all across the globe, crates of seeds are sent here for long-term storage in cold, dry rock vaults. Tableau's own Stephanie Baranya used Story Points to explain why the vault is so important.
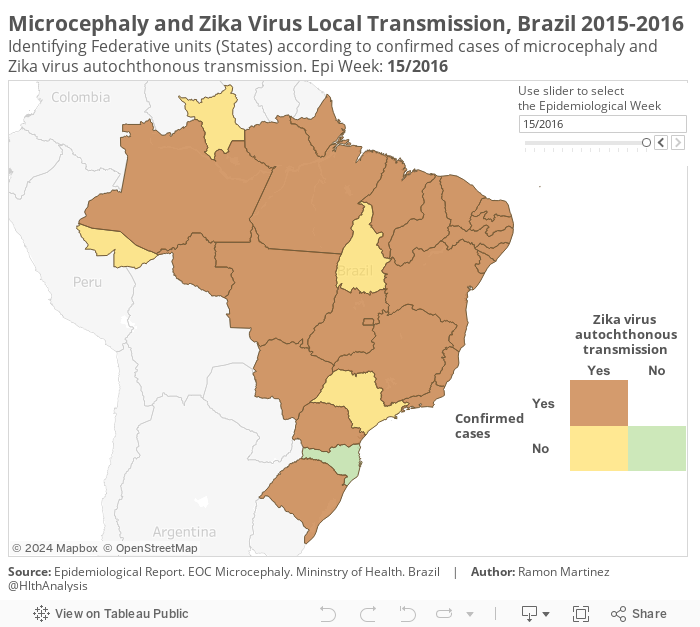
Microcephaly and the Zika Virus in Brazil
With the Zika virus on the rise, Ramon Martinez created a visualization to show which regions of Brazil have reported cases of both microcephaly and the Zika virus.
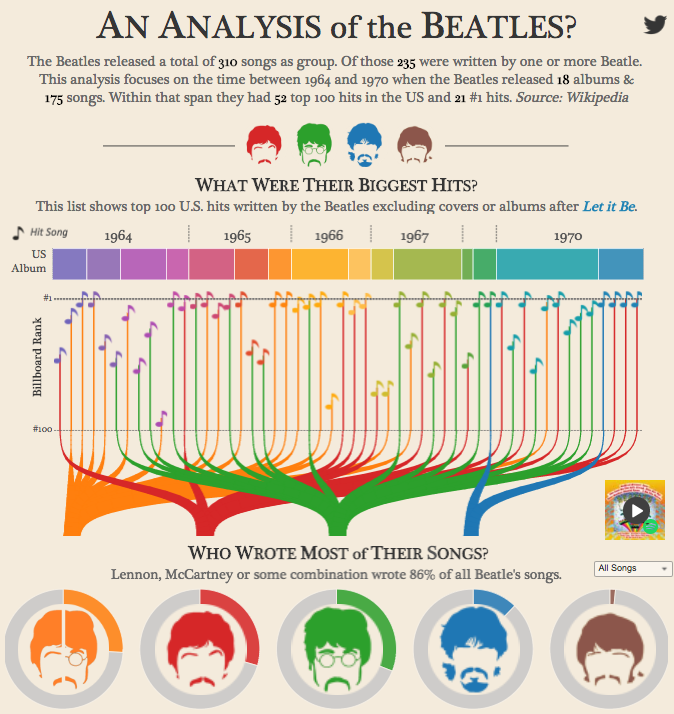
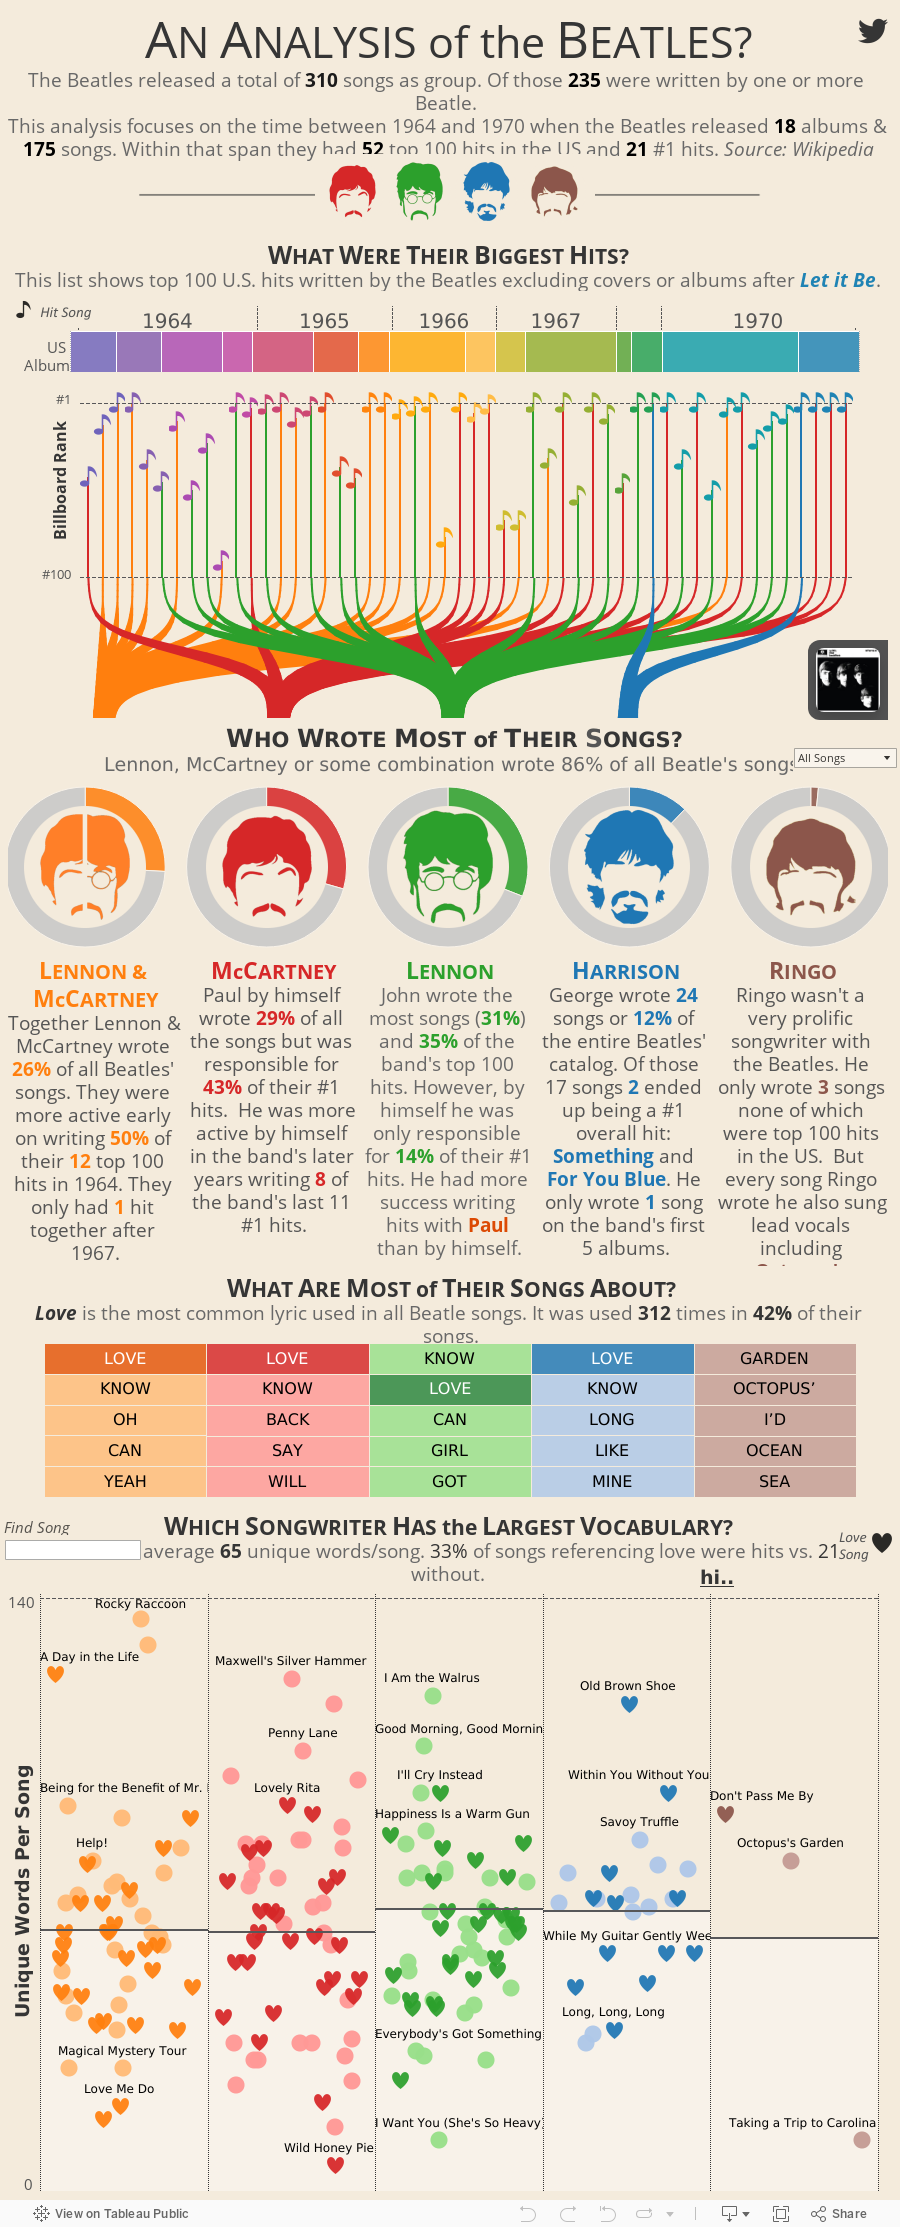
Analyzing the Beatles
Adam McCann of Dueling Data visualized the epic discography of the Beatles. Explore the stars' careers and see who wrote which songs. And click on the album icon to play the band's music directly from the viz.
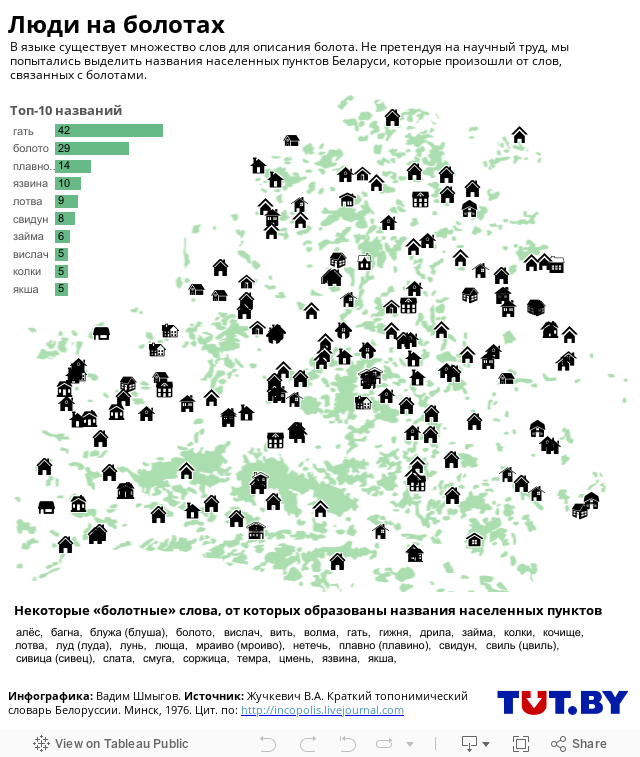
People on the Moor
Vadim Shmygov of TUT.BY visualized the location of different historic settlements in the Belarus low country. Click on the different names on the bar chart to update the map.
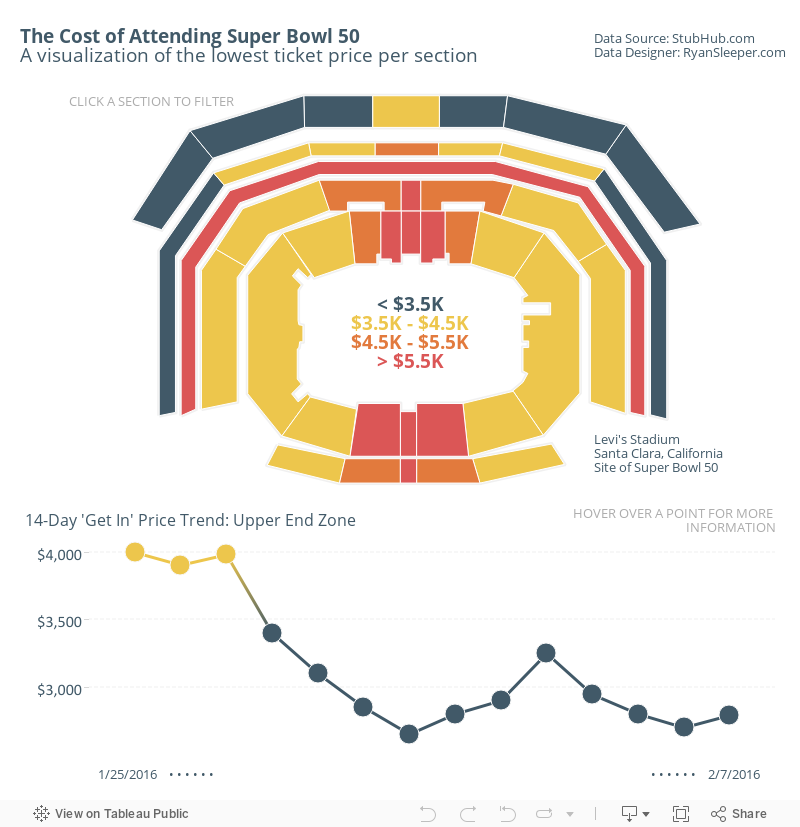
The Cost of Attending Super Bowl 50
This viz by Ryan Sleeper looks at the lowest ticket price for each section of the Levi Stadium for Super Bowl 50. Notice how the prices dropped as the date neared the event itself. You can also see the huge difference in price for the various sections.

Of course, there were many more great vizzes than we had room for. To see a new, beautiful Viz of the Day (#VOTD) every day, follow Tableau Public on Twitter.