Why bullet graphs pack more punch than gauge charts
While adorable, gauge charts can be misleading and take up too much space.


In some circles, gauge charts are a popular visualization tool. They're enticing, seeming to offer up immediate insight at a glance. They allude to the most universal gauge, a car's speedometer.
But there are problems with gauges. They're too simplistic. They lack context. They waste space. Sure, we can all imagine what it feels like to be moving 0 mph as compared to 100, but how do we "feel" the significance of $5 million in sales?
What's more, with a business's progress being infinitely more complex than measuring the speed of a car, how do we begin to pack layers of information and context into this obstinate circle that's already taking up a large portion of our dashboard? While they can be attention-grabbing, gauge charts can often mislead by omitting key information. Data discovery can be easy, but gauge charts are just too easy—dangerously so.
Even if your gauge chart is not misleading (say, on a dashboard about different models of cars), they always take up valuable space. In the wonderful age of big data, there are innumerable ways to visualize your data. If you want to deliver all the insights in one place without flipping between PowerPoint slides, efficiency is crucial. To demonstrate, see how much space is conserved by replacing your gauge chart with a bullet graph (a great alternative!):
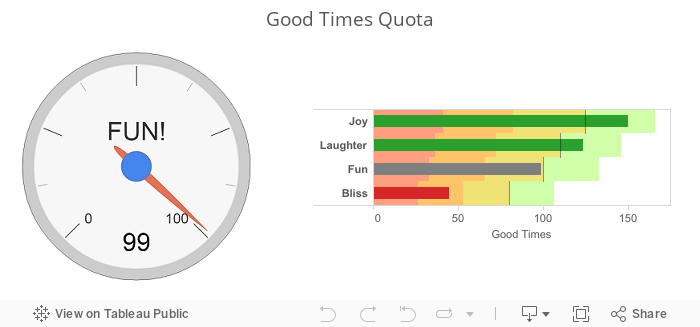
On the bullet graph, you can quickly see that joy is well above quota, laughter is above quota, fun fell short of quota, and bliss is well behind quota. Comparing categories becomes easier, and the graph also saves on space. Plus the format is more flexible—what happens if fun exceeds 100 on the gauge to the left?
Data visualization researchers prefer bullet charts because they leverage our perceptual and cognitive predispositions. According to statistics professor William S. Cleveland, humans don't compare angles as quickly or accurately as they compare lengths or parallel positions relative to a common baseline [The Elements of Graphing Data, 1985]. Data visualization expert Stephen Few has some great things to say about bullet graphs as well.
For these and other reasons, gauge charts aren't included by default in Tableau. Get to know bullet graphs instead. They can do all gauge charts can, and more. Bullet charts may not mirror a ubiquitous symbol, but when it comes to the metrics that drive your business, they pack a lot of horsepower.
เรื่องราวที่เกี่ยวข้อง

5 Ways to Use Tableau Public to Achieve Your Goals
 มกราคม 11, 2025

World Mental Health Day: Elevating Awareness Through Data Visualization
 ตุลาคม 10, 2024

From TV Screens to Tableau: Visualize Your Favorite Shows with IMDb
 สิงหาคม 31, 2024