From academia to tech, Sue Kraemer promotes data literacy for Tableau


A self-proclaimed “science geek,” Sue Kraemer has always been a math and science person who is passionate about sharing her knowledge with others. She’s now applying those lessons in the classroom to promote data literacy.
Growing up in Wisconsin, Kraemer tutored fellow students in math and science and later focused on chemistry and biology in college.
“Thank God for a scholarship because otherwise I couldn’t afford to go,” she said. “I’ve been thinking about that a lot, about how college has become so expensive. If I were 18 today, would I still have been able to go?”
With her love of learning, Kraemer went on to earn a master’s degree in health physics, and then a doctorate in molecular and cellular biology and radiation biology. This led to several positions in health-focused research centers and then teaching at several universities, including the University of Washington Bothell, where she is still an affiliate. She’s also a master gardener and even teaches in the Seattle-area-based Growing Groceries Program.
Having access to and promoting education for all has always been important to her, so coming to Tableau was a natural fit.
“The root of my passion is to break those barriers,” she said. “Every student should have that opportunity I had. That’s why I continue to push to make Tableau more accessible for academics.”
She’s doing that in her work with Tableau Academic—our program dedicated to growing the next generation of data people. Established in 2011, Tableau Academic has enabled more than 1.7 million students and instructors with data skills in several top universities around the world, including MIT, NYU, Nanyang Polytechnic in Singapore, and Oxford University in the UK. After joining Tableau, Kraemer built a 10-week course for academia that was then used to launch Data Literacy for All, a free set of guided, online training modules focused on empowering everyone with the fundamental ability to explore, understand, and communicate with data.
Here Kraemer shares more about her background and how she’s bringing her passion for data to a global audience.
Molly: Your background is in academia, with nearly 10 years at the University of Washington Bothell. Why did you switch to tech?
Sue: I really had a realization that I loved to teach and mentor, and made a switch to leaving research to consider something new. While teaching at UW Bothell, I bumped into Tableau and fell in love with the software.
My “aha” moment with Tableau was that this can be a teaching tool in itself. I was using other software programs, and I was on the hunt for a free program that would engage students. I thought, “Oh, this is the program when students leave my class they can hang out at home on their sofa and use it and still be excited about data.”
My goal wasn’t only that they do well in my class. My goal was that they keep doing this five years from now. I wanted a program to inspire students to stay engaged and stay involved and work with data after they left my class.
The culture of Tableau is so attractive to me. They use the word "humble" in their job ads. I had friends there, and when I saw this job posting I don’t even know if I could have written this job description myself—it all lined up with who I am. I stood up at the beginning of every stats course and said, “This is important stuff, not just for checking a box for your requirement, but for your life.” That passion is in my DNA. And here I am, designing a curriculum for data skills.
Molly: A lot of your work at Tableau focuses on promoting data literacy. How did that come about?
Sue: We had discussed the importance of data skills and data literacy from the beginning so Courtney [Totten, Director, Academic Programs] and I were brought together to do this. I am sure my passion for the subject played a role. When I arrived, I had to do a strategy, and I ended up presenting it to [former CEO] Adam [Selipsky]. I had to research the field and share my experience of what courses and content would be most important. Data literacy was at the top of that list.
It overlaps a lot with what I used to teach, and also pulls from my experience in the classroom of the gaps I saw. I noticed particular concepts that many students still struggle with and addressed them in the data literacy courses.
Molly: Tell us a bit more about how the Tableau data literacy courses came together?
Sue: Basically, when I make these I pretend I’m going to have a class at UW Bothell, where I’m still an affiliate. The first Tableau Academic version, Data Literacy One, I created the equivalent of a five-credit, 10-week course, including the content for academics, test bank, homework, discussion board, Tableau demos, and lecture slides. That came out in February 2020. The second course, Data Literacy Two, launched in December 2020.
Meanwhile, during the pandemic, we managed to create this partnership with services to turn Data Literacy One content into eLearning. Data Literacy for All, [a free, five-plus hour program of data skills fundamentals], launched in the fall of 2020.
My job is to serve the academic community and create content for college academic instructors. The data literacy eLearning is a side hustle, an extra thing that just kind of happened outside what I’m here to do. It makes sense there’s a need, and I’ve been noodling around the idea of how Tableau Academic programs were a little hidden away and how the work we’re doing can be a bridge to these other audiences.
Molly: How will your data literacy work continue to play with Tableau Data Culture initiatives? Are there plans to potentially offer the courses as part of larger corporate training initiatives?
Sue: I hope so. I don’t know the overall plan. I have been in conversations with other folks as to what I am working on, and I’m thinking about that a lot. Another piece in here is about equity and access, and I want to spend more time there.
The tech world, there is a culture there, and if we really want organizations to embrace a Data Culture, how do we help them be more inclusive and welcoming? In a way, it’s what I used to do in my stats course. You always get a bunch of kids who say, “I can’t do math,” or “I don’t like data.” How do we break through the barriers to have people be unafraid to embrace data?
I can do that really well in a classroom. One of the activities I’d have my students do was a math and data biography where they’d talk about their experiences, good and bad. Quite often, it was a bad teacher or past trauma, and it took opening the door to wrestle with the material and get over the fear.
That was me in the room. How do we do that and scale in this online environment? That kind of work needs to happen. I think this steps into how do we break down barriers in tech culture? This psychology is key to helping people anywhere, being welcoming, and breaking down the barriers to access.
Learn more about Sue's work in her latest article for Tableau, Bridging the data literacy gap between academia and the workforce.
Histórias relacionadas
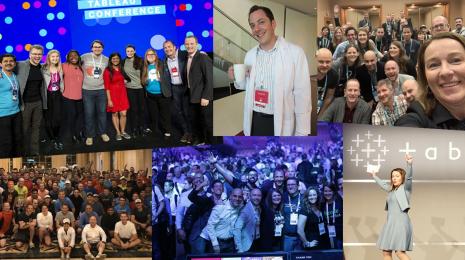
How I TC: A behind-the-scenes look at how Tableau leaders prepare for the biggest data event of the year
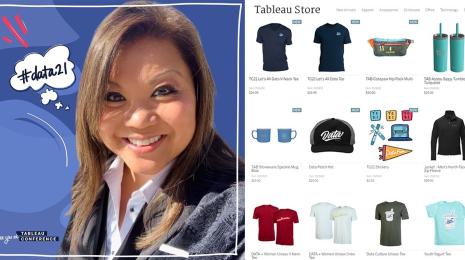
Events manager talks Tableau Store, TC conference gear, and event planning for employees