Vector maps, parameter actions, new Tableau Server browsing experience, and more—now available in 2019.2


The newest release of Tableau is here! This 2019.2 release includes exciting new ways to interact with your data and new dashboarding capabilities that come together to make a big difference for a more precise, streamlined authoring experience. Enjoy parameter actions, vector maps, and a new way to browse your content on Tableau Server and Online. Be sure to upgrade to the latest version of Tableau to take advantage of these new features!
Interactive analytics: Parameter actions and vector maps
Parameter actions
Unleash your analytical creativity with parameter actions—the sky’s the limit with this simple, but powerful feature. With parameter actions, you now have the ability to visually change a parameter’s value. By interacting with marks on a viz, you can drive reference lines, calculations, filters, and even SQL queries, bringing visual interactivity to your data like never before.
Vector maps, new map styles, spatial calculations
We’re bringing a richer mapping experience to Tableau with vector-based maps. Vector-based maps look sharper and smoother as you pan, zoom in, and zoom out to explore your geospatial data. We’re also introducing brand-new map styles and layers. Bring more life and context to your data with Street, Satellite, and Outdoor styles, as well as building footprints, subway and train stations, and points-of-interest layers.

But there’s more—we’ve also brought spatial calculations to 2019.2. MakeLine support makes it easy to create two-point origin-destination maps, such as flight maps of airline routes, metro maps showing subway lines, and weather maps of storm paths. And with MakePoint, you can now turn latitude and longitude values from any data source (like text files or Excel) into spatial fields for use in spatial joins.
Redesigned content browsing experience: New homepage and left navigation
We’re also making it easier to find the content you care about on Tableau Server and Online. In 2019.2, we’re introducing a brand-new home page and fully redesigned navigation experience so you can get to your content faster than ever. Quickly access your favorited and recently-viewed dashboards in the new left navigation and discover new content through popular views to stay on top of what’s trending on your Tableau Server or Online site.

In addition to a new browsing experience, we’ve also added private custom views for the Viewer role on Tableau Server and Online. You can think of Custom Views as a way to bookmark your data—whether that be through filtering, sorting, or interacting to get to your preferred version of a dashboard. Today, Explorers and Creators can create Custom views, but based on feedback from customers, we’re happy to be extending this functionality to the Viewer role so that everyone can customize their views based on their goals.
New dashboarding capabilities: Custom reference line tooltips, show or hide dashboard containers, show or hide sort controls, and replace worksheets
We’ve heard your ideas in the community, and in this release we’re excited to deliver the following capabilities to make authoring dashboards easier, regardless of your skill set. Focus less on the mechanics of building dashboards and more on exploring and analyzing your data.
Custom reference line tooltips
You can now customize reference line tooltips—edit the tooltip text, or choose to disable the tooltip altogether.

Show or hide dashboard containers
We’ve added the ability to toggle between “visible” or “hidden” for any floating container on your dashboard. Elements that don’t need to be visible all the time, such as instructions, filters, or legends, can now be hidden to maximize screen real estate.
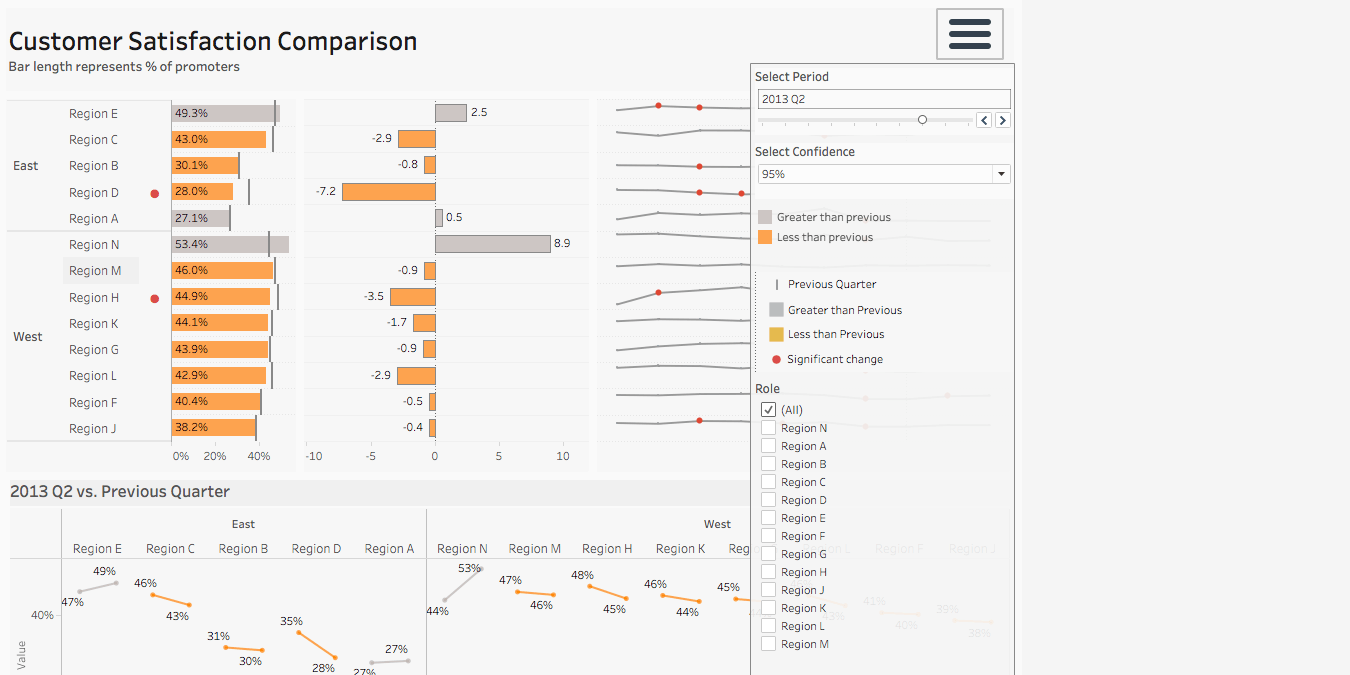
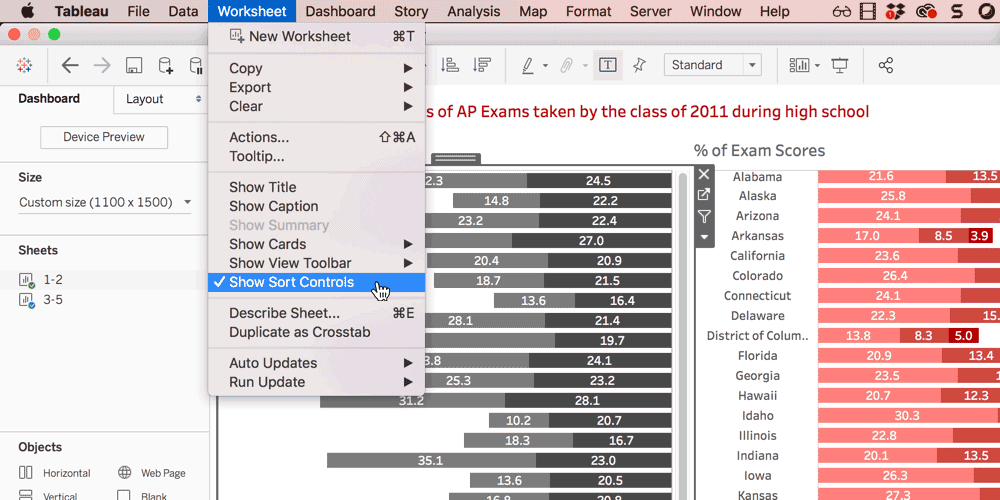
Show or hide sort controls
Authors can now preserve the sort order they’ve set on their worksheet by disabling the ability to one-click sort. Rest assured that end-users interact with data as you intended for the best dashboard experience.
Replace worksheets with a single click
And finally, get to that perfect dashboard faster with the ability to replace an existing worksheet in a dashboard with a new worksheet from the sheet list, with a single click. Dashboard spacing, dimensions, and aspect ratios all carry over for a faster, more precise authoring experience.

Ask Data updates: Conversational interactions, calculations, multiple sheets, and usage analytics
Ask Data continues to improve with significant updates in 2019.2, all to make it easier for you to ask sophisticated questions in a natural, ad-hoc way. You’ll notice a new interface allowing for more conversational interactions as you dig into your data. Replace a statement in an existing question by typing in your request. To change “average sales by state” to “average profit by state,” simply type “replace sales with profit.” You can also type things like “remove filter” to remove phrases from the query making it easier to iterate as you think of new questions. You can also now add calculations, such as the sum, difference, and ratio of two measures, on the fly. For example, type “Avg Sales/Avg Profit”, hit enter, and Ask Data automatically divides the measures for you.
Take advantage of the ability to create multiple worksheets in Ask Data—data to insight to dashboard, all without leaving the browser. Simply type to ask questions and iterate to create multiple useful visualizations and use them to build a fully functioning dashboard.

And finally, saving the best for last—2019.2 brings usage analytics to Ask Data. Data source owners and administrators can see what questions their users are asking and the most commonly-used fields in their data sources—all to optimize for the best possible experience. For example, you might see that a field labeled “Ttl_Sales” is a commonly used field. This gives you input to tune this field to be more accessible for your users. You could rename the field to a more readable name and check that the field has the correct data type or default aggregation.
Tableau Prep updates: New connectors, enhanced publishing experience
Accompanying the 2019.2 release is a brand new version of Tableau Prep Builder, 2019.2.1. In this release, we are introducing two brand new connectors: Amazon Athena and other JDBC! This means you can connect to and prepare an even more diverse set of data.
Also new in this release is an enhanced flow publishing experience. You’ve told us that it's often difficult to know or gain visibility into whether or not files stored in a network directory have been safelisted by your administrator. With this improvement, you can see the list of network directories that have been safelisted so you know the status of a directory right away.
Thank you, Tableau Community!
We can’t do this without you so thank you for your continued feedback and inspiration. Check out the Ideas forum in the community to see all of the features that have been incorporated thanks to your voices.
We’d also like to extend thanks to the many testers who tried out Tableau 2019.2 in beta. We appreciate your time and energy to help make this release successful.
Get the newest version of Tableau today, and if you’d like to be involved in future beta programs, please sign up to participate!
Verwante verhalen

The Tableau+ Bundle with Premium AI, Enterprise Capabilities, and Premier Success
 24 juni, 2026

What is Tableau Prep?
 30 april, 2026

Insights Wherever You Work: Meet the Tableau App for Microsoft 365
 16 maart, 2026