Visualizing Climate Change: Expert Tips from #TheSDGVizProject Leaders


As we celebrate Earth Day worldwide, let’s take the time to reflect on our planet's well-being and the role of data visualization in raising environmental awareness and action. Your data stories have the power to drive lasting change as they empower us to comprehend complex environmental issues and collaborate toward a sustainable future. As we embark on this journey of visualizing climate data, meet Brian Moore, Jacqui Moore, and Vinodh Kumar—leaders of the Tableau Community Project #TheSDGVizProject—who will guide you toward the most effective ways of visualizing climate data.
What is #TheSDGVizProject?
The Sustainable Development Goals (SDG’s) were created and adopted by all United Nation Member States in 2015 as part of a 15-year plan to end poverty, protect the planet, and improve the lives and prospects of all persons. The U.N. Secretary General has called for increased action on three levels; Global Action, Local Action, and People Action. #TheSDGVizProject focuses on the third level of action; People Action. Learn more about this project.
What do people need to know before visualizing climate data?
"There are a few things to keep in mind when visualizing climate data. First, get the data from a reliable source (check out the links below!) Second, make sure that you clearly understand the data, the metrics you are visualizing, and how that data was collected. One of the most common climate metrics that I have seen visualized is the ‘Global Surface Temperature Anomaly’, but I have also seen that data misrepresented countless times. It’s important to understand what’s being measured and how, so you can effectively visualize the data without accidentally misleading your audience. And third, even though Climate Change is a scientific certainty, it has become a political issue, especially in the U.S. To reach the widest audience possible, maintaining objectivity in your analysis and refraining from aligning with specific viewpoints is crucial. Let the data tell the story." Brian Moore.
Where can you find trusted and reliable data sources?
There are many governments, NGOs, and agencies collecting and providing access to high quality global and local data related to sustainability and climate change. A list of some trusted sources are listed below:
- The UN SDG Indicators Database: The global SDG Indicators Data Platform provides data for over 210 sustainable development goal indicators across the globe.
- The Climate Action Tracker: This project offers up-to-date data and analysis on countries' climate policies and their alignment with the Paris Agreement goals’.
- Our World in Data: Get accessible and understandable data on global challenges like poverty, disease, hunger, and climate change to drive progress.
- The World Bank: Get timely and reliable collections of time series data on a variety of topics, including international data sets on world development indicators.
- The Humanitarian Data Exchange: Find humanitarian data in one place.
- Organization for Economic Cooperation and Development: One of the world’s largest and most trusted sources of comparative socio-economic data and analysis.
- NASA: Get comprehensive global datasets on Earth’s climate change, planetary atmospheres, and more.
- NOAA: The National Oceanic and Atmospheric Administration offers data on climate variability and change.
- IPCC: Get reports about the state of scientific, technical and socio-economic knowledge on climate change, its impacts and future risks.
- https://wmo.int/: The World Meteorological Organization provides data related to weather, climate, and water.
- Climate Watch: Get data sets and insights on countries' climate progress.
For specific topics and regions, look for official sources from relevant government agencies or research institutions. By using data from these trusted sources, you can be confident your information is as accurate and objective as possible.
Ready-to-Visualize Climate Data Sets in Tableau
Ready to jump into visualizing climate data? From analyzing global temperatures to examining emissions by country and year, each data set offers a unique perspective on the complexities of climate change. You can also visualize the impacts of natural disasters, track international efforts such as Paris Agreement participation, and delve into the intricacies of rising sea levels and greenhouse gas emissions. Or participate in the #SDGVizProject which also shares a variety of data sets that support the United Nation’s Sustainable Development Goals like this climate action dataset.
What inspired you to create #TheSDGVizProject?
I think the main goal for all of us with #theSDGVizProject was to spread awareness. The Sustainable Development Goals are a big deal in many places, but they’re rarely discussed in some countries, including the U.S. We wanted to help change that. The SDGs give the world a common way to measure and discuss the many aspects of protecting and improving the future for humans, wildlife, and the environments we share. We had access to an incredible amount of data related to the SDGs, through the SDG portal and through our partnership with the Humanitarian Data Exchange. And we had access to an incredible community of like-minded folks who are passionate about data visualization and using their skills to make a positive impact. All we had to do was bring those together.
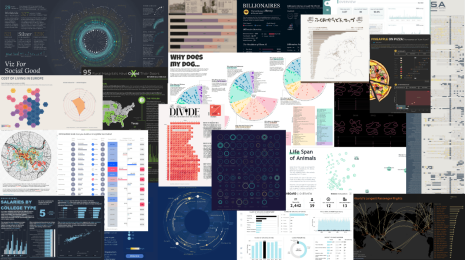
Explore this curated collection of data visualizations created by the #DataFam which advocate for a sustainable future.
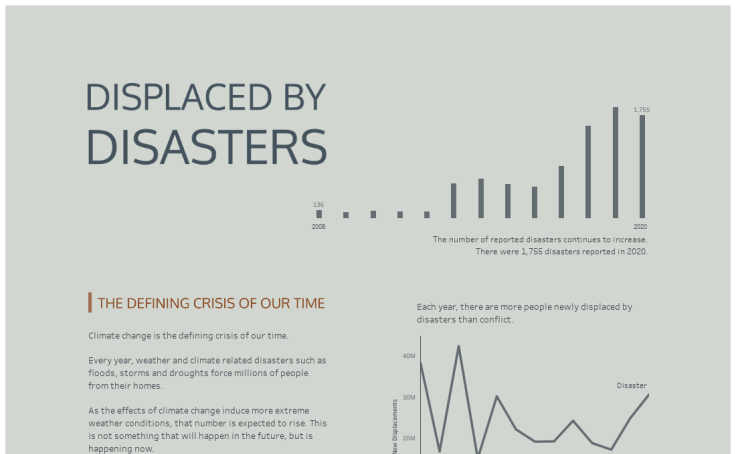
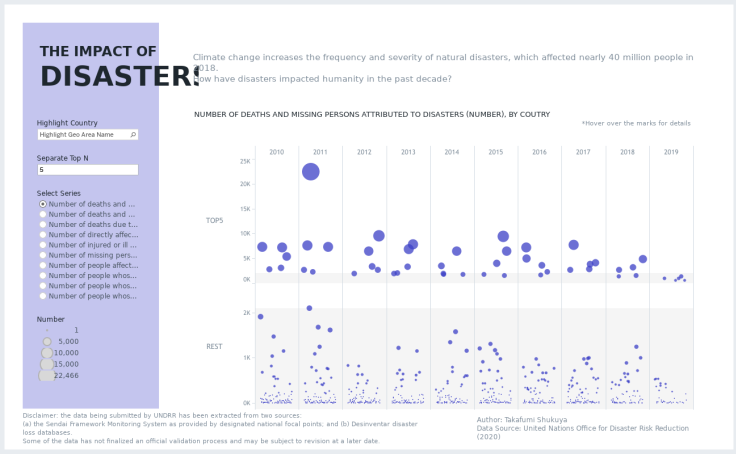
Displaced by Disasters | #Viz4ClimateAction

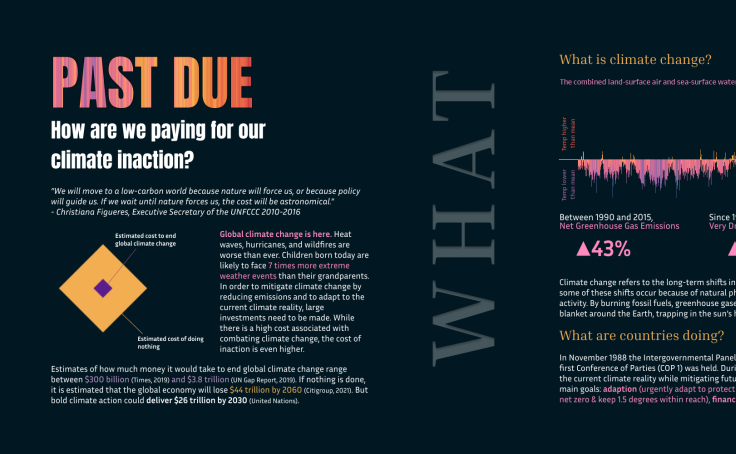
#Viz4ClimateAction Climate Financing - #VOTD
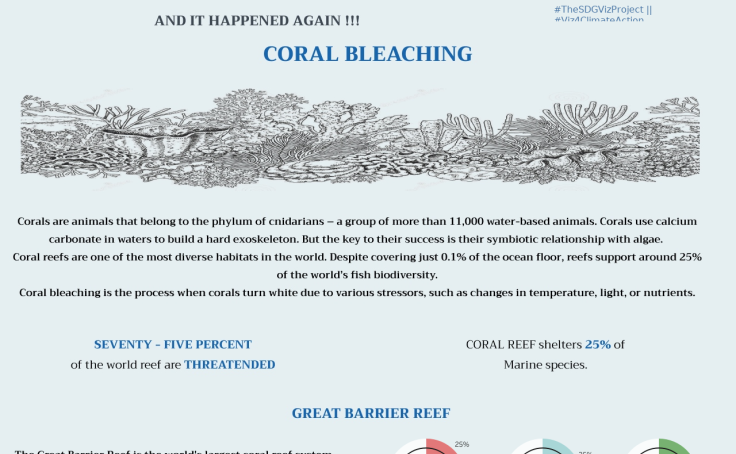
Coral Bleaching || #Viz4ClimateAction
The Burning Earth #SDGVizProject #Viz4ClimateAction
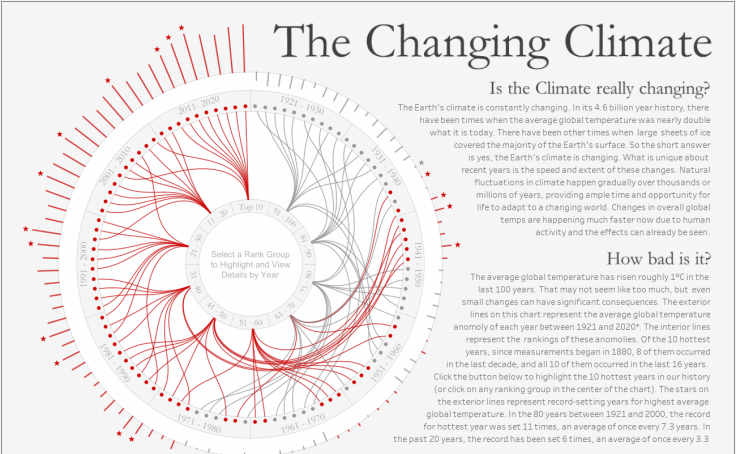
#Viz4ClimateAction - The Changing Climate
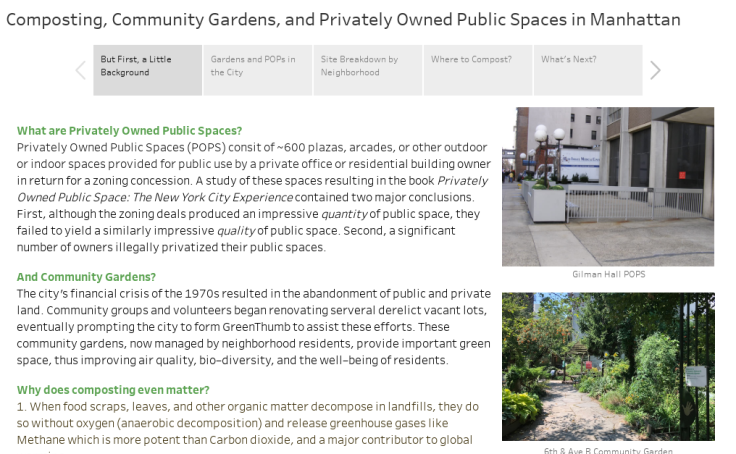
POPS, Community Gardens, and Composting in Manhattan #Viz4ClimateAction
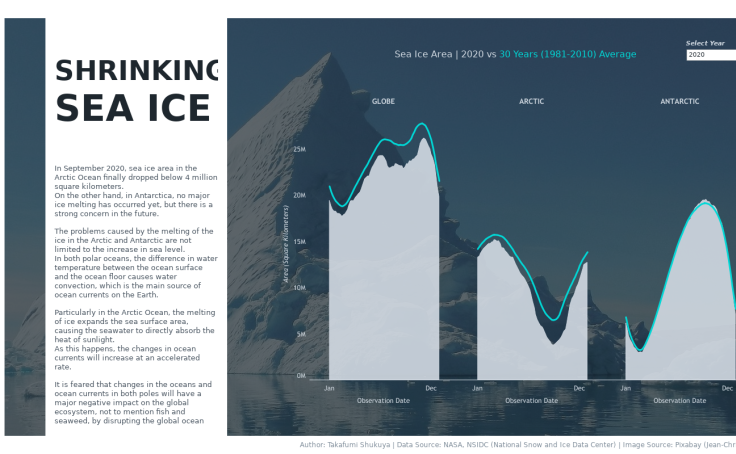
#Viz4ClimateAction | SHRINKING SEA ICE
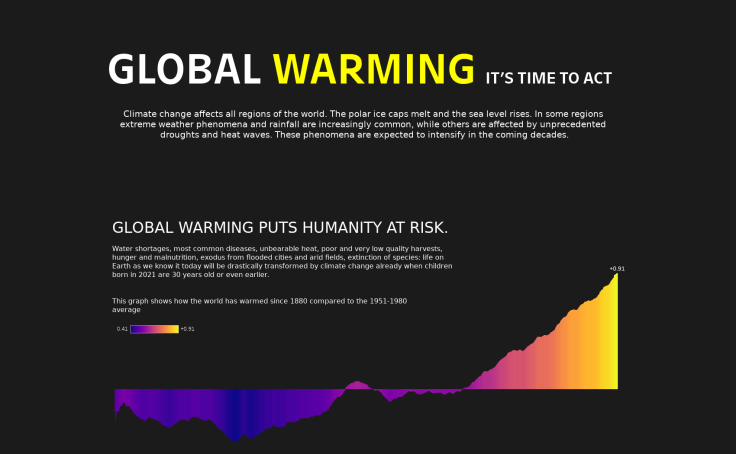
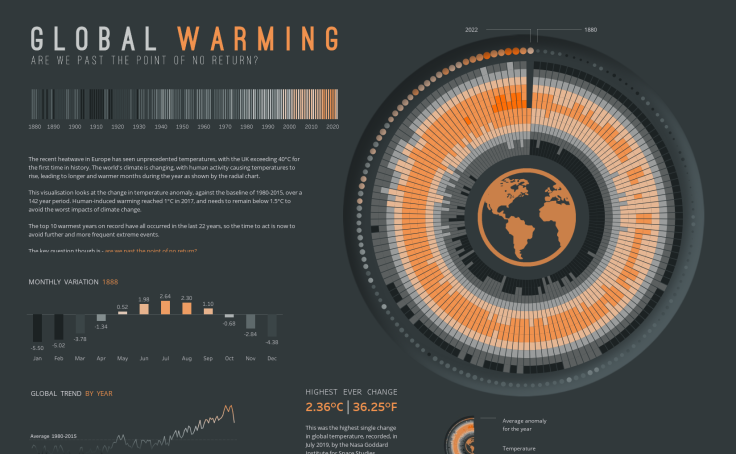
Global Warming -
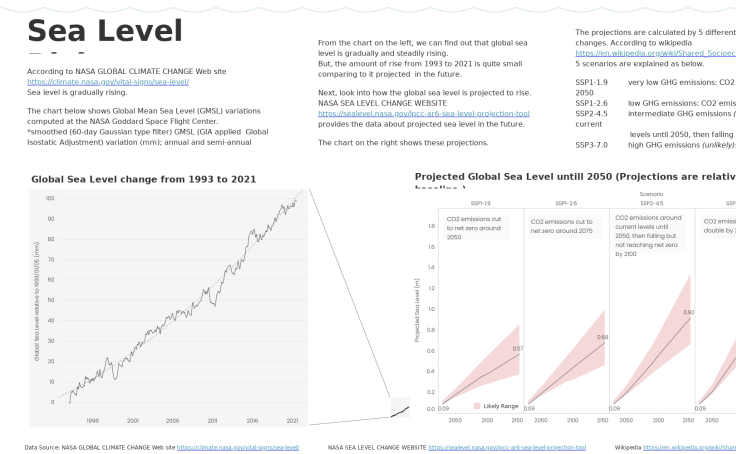
Sea Level Riging (#Viz4ClimateAction)
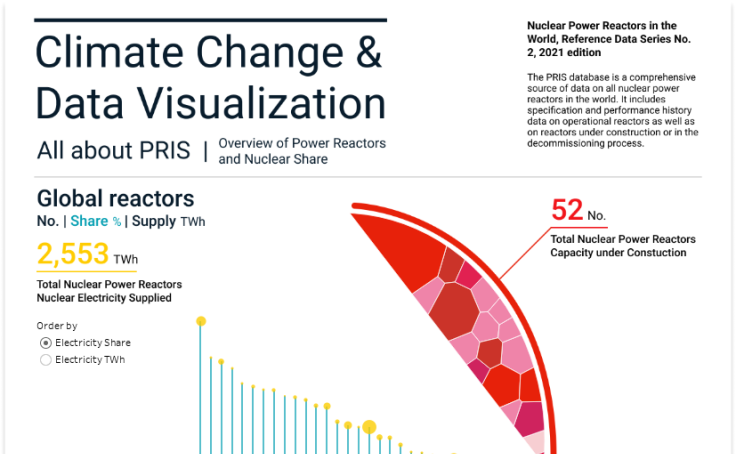
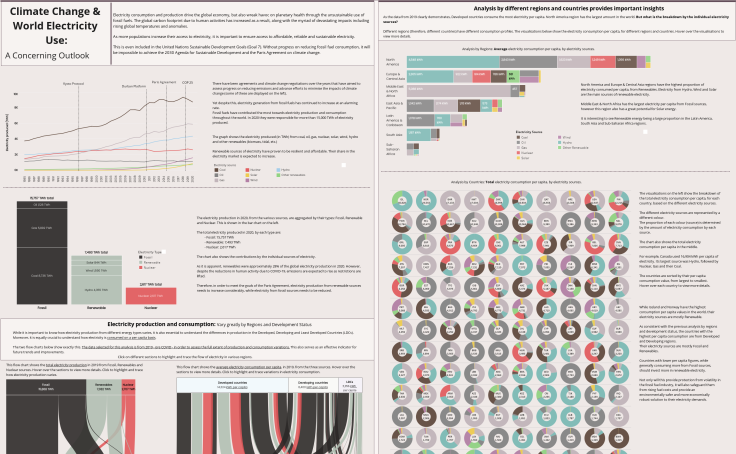

Climate Change #SDGVizProject #Viz4ClimateAction
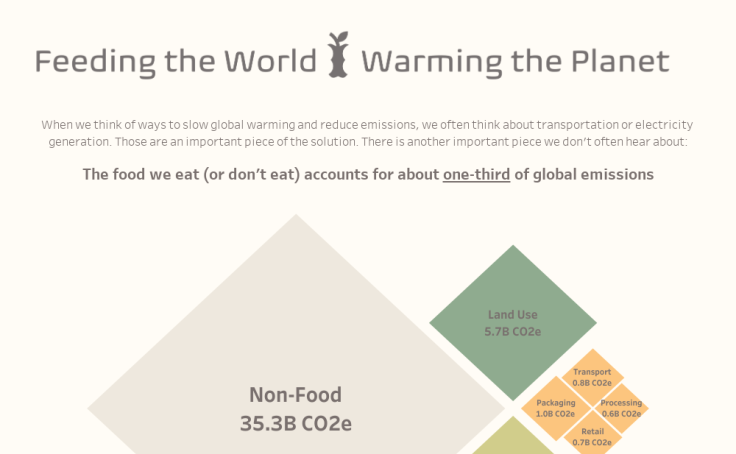
Food Emissions
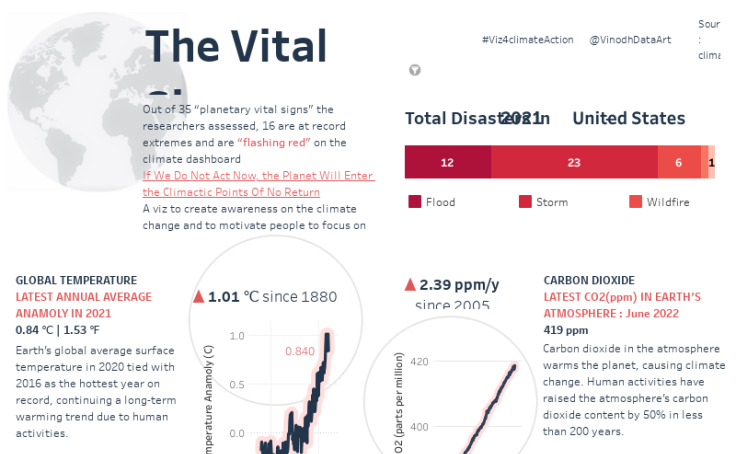
Vital_signs_of_the_planet - #Viz4ClimateAction

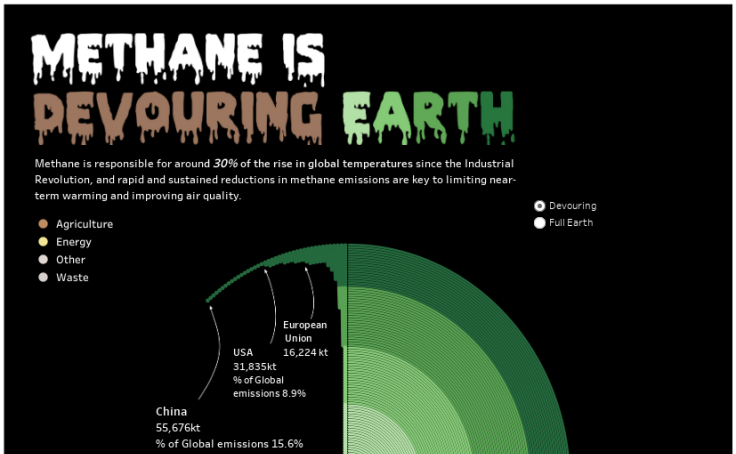
IEA _Methane is Devouring the Earth
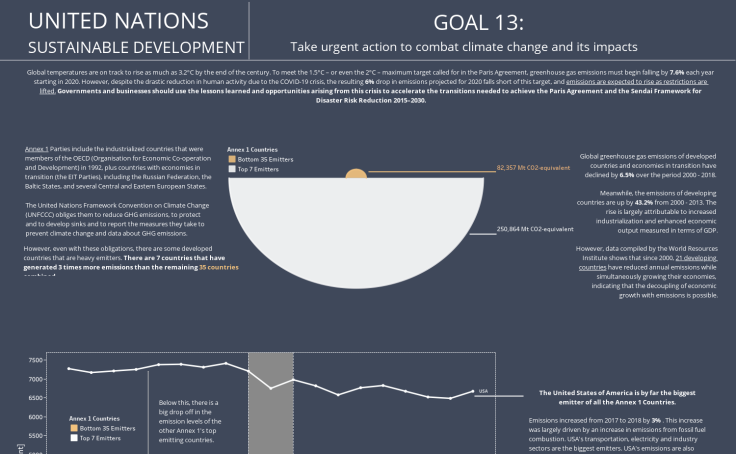

#TheSDGVizProject | 13 CLIMATE ACTION
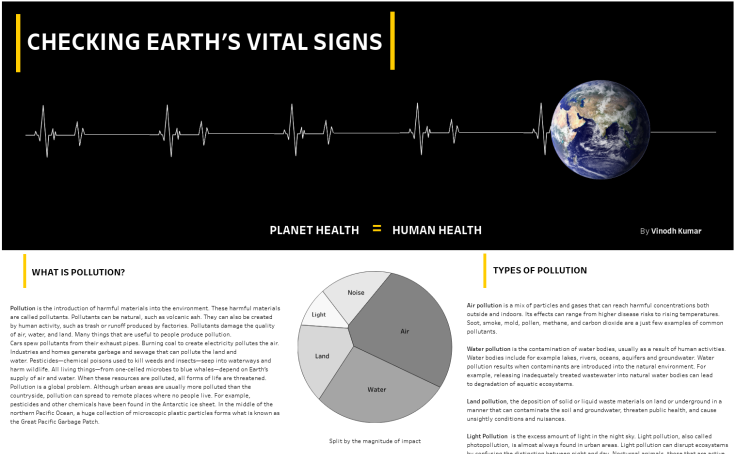
Checking Earth's Vital Signs - Ironviz_2020

SDGs#13
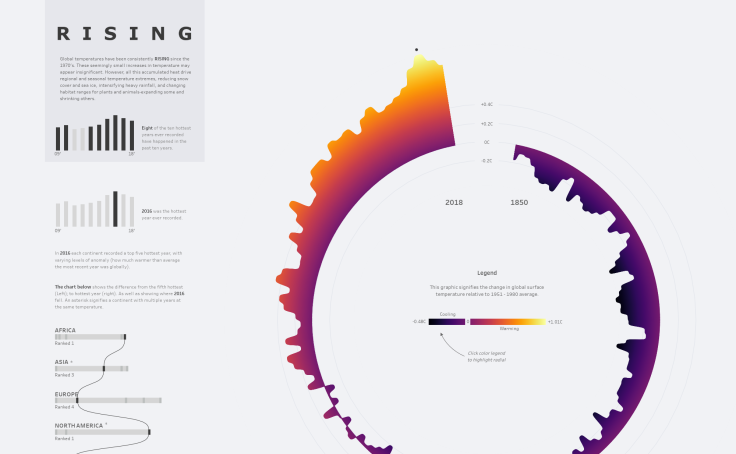
RISING

The Global Water Crisis
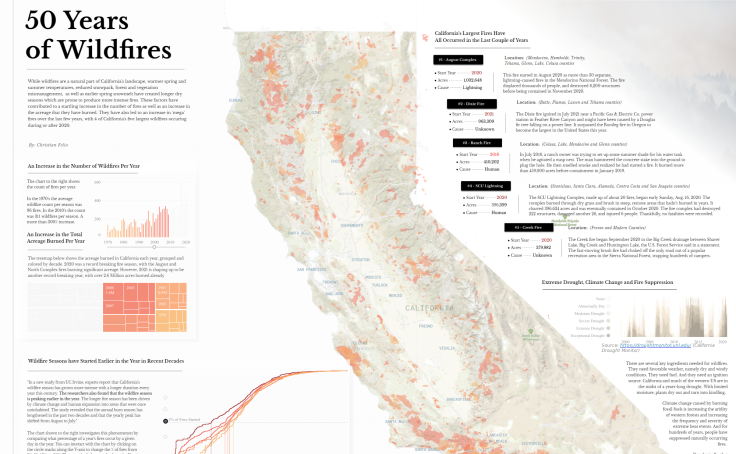
50 Years of California Wildfires
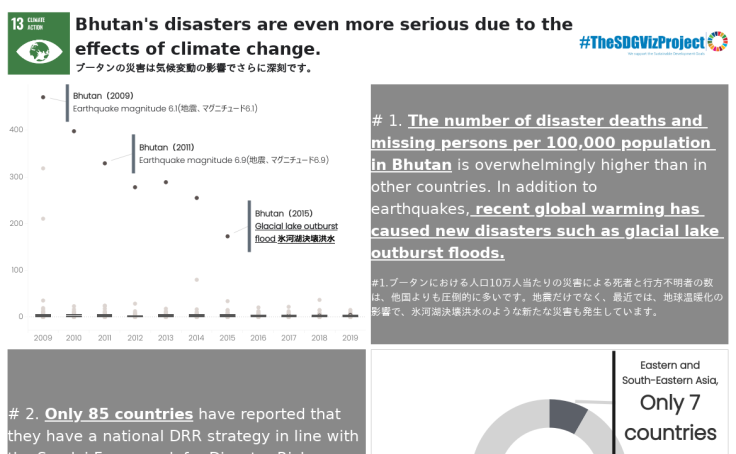
SDGVizProject13

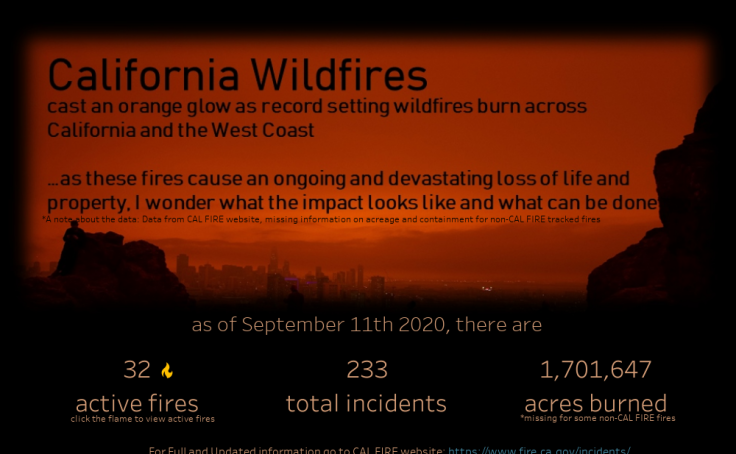
CA Wildfire 2020
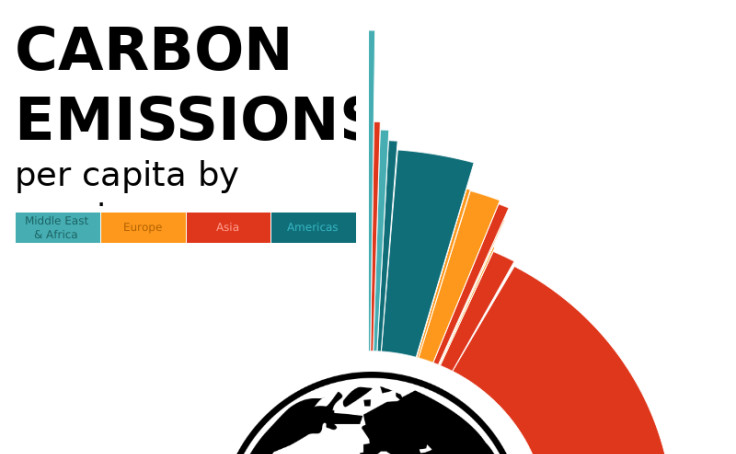
Radial Marimekko
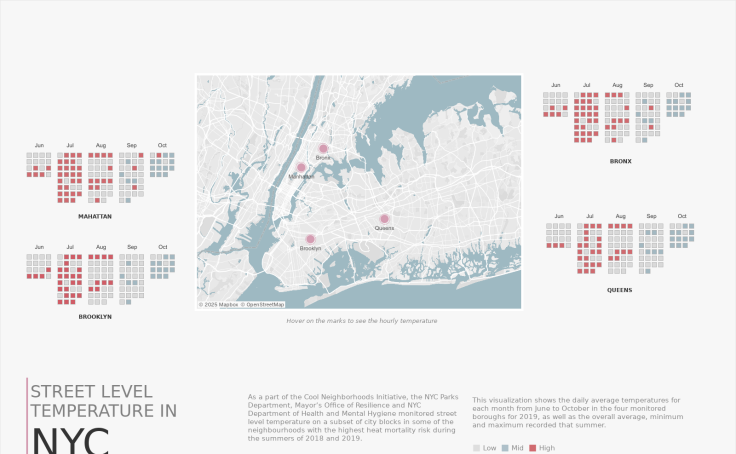
Street level Temperature In NYC #VOTD
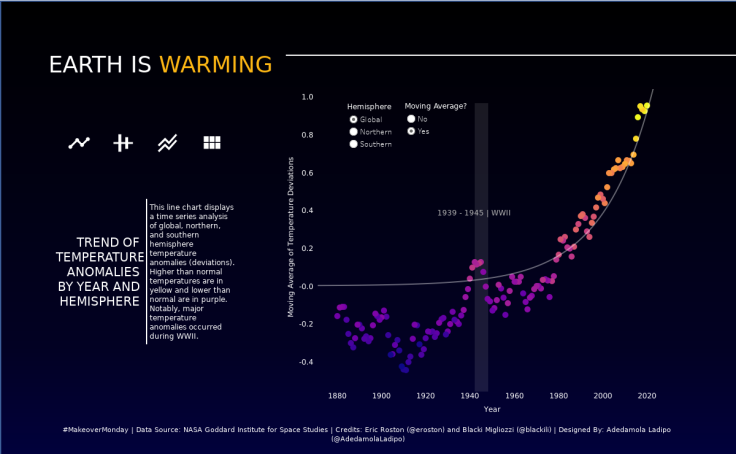
#MakeoverMonday | Global Temperature Anomalies
Vital_signs_of_the_planet - #Viz4ClimateAction
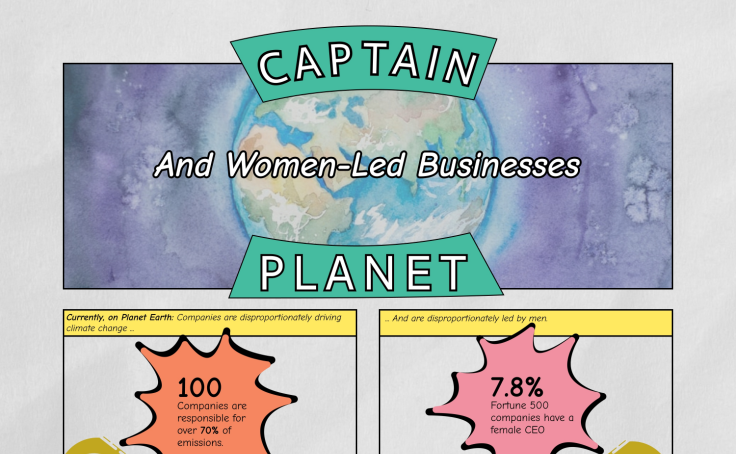
Women in Business and Climate Change
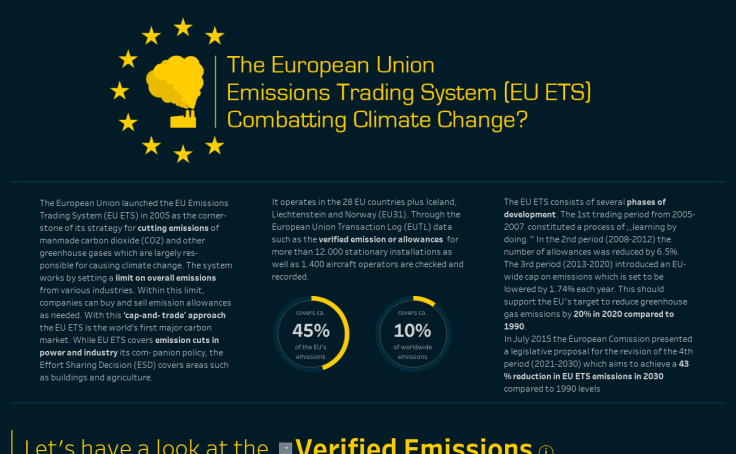
EU ETS: Combatting Climate Change?
Looking for more inspiration? Check out the vizzes created for the #Viz4ClimateAction challenge. Start making meaningful connections by exploring each author’s profile. Give them a follow and favorite the vizzes you love the most.
関連ストーリー
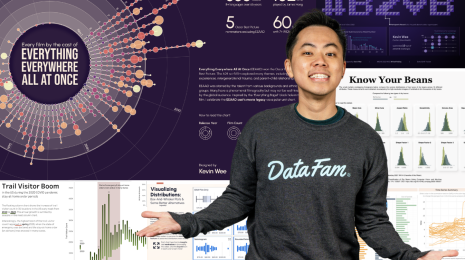
Kevin Wee's Remarkable Path from PhD Scientist to Data Artist Extraordinaire
 2024/08/26
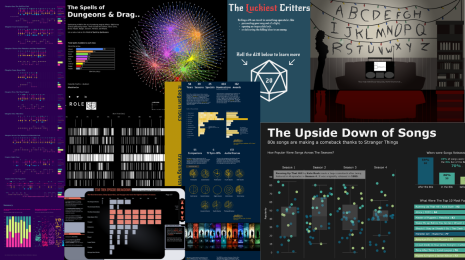
Practice and Grow Your Data Skills with Tableau Community Projects
 2024/03/05
What is the Tableau Community Project—DataFam Con?
 2022/12/28