
Tableau Pulse: 新しい拡張 Q&A 機能の強化
強化された拡張 Q&A 機能を使用して、インサイトをさらにスピーディに掘り下げましょう。AI との会話を開始するエントリポイントとして、ホームページやインサイト探索ページなどが新たに加わりました。また、テキストの書式設定が改良され、出力がよりわかりやすく表示されるので、インサイトを明確に把握できるようになります。Tableau Cloud の Tableau+ エディションで一般提供が開始されています。
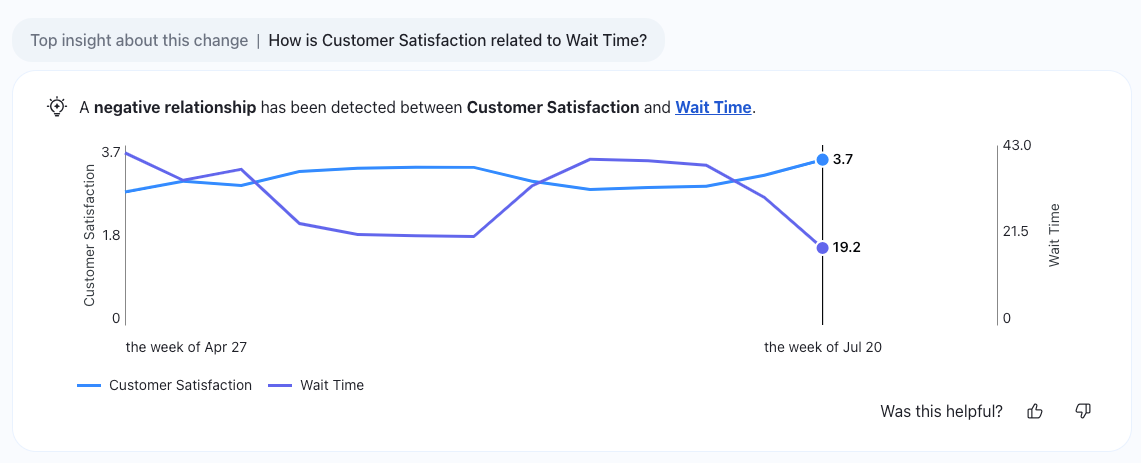
Tableau Pulse: 相関メトリクスによるインサイト
Tableau Pulse で、新しいタイプのインサイトを通じて洞察をさらに深めましょう。相関メトリクスは、データ内の主要な相関関係を特定することで、メトリクス間の有意な関係を見つけやすくする機能です。Tableau Cloud の Tableau+ エディションで一般提供が開始されています。
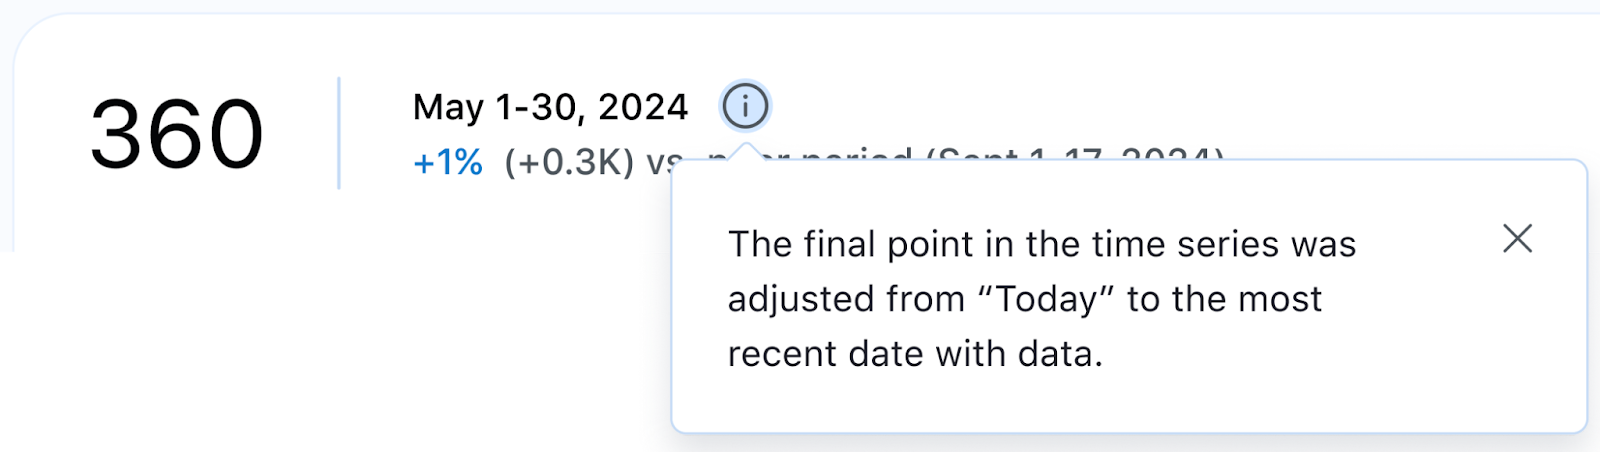
Tableau Pulse: 日付の更新
パフォーマンスの推移をより正確に把握できるように日付を設定しましょう。ローリング期間 (過去 7 日間、過去 90 日間など) を選択することで、より的確に判断できるようになります。また、直近のデータが反映されるよう、時系列を動的に設定することも可能。こうすれば、今日のデータが取得される前でも確実に全体像を把握できます。Tableau Cloud のすべてのエディションで一般提供が開始されています。
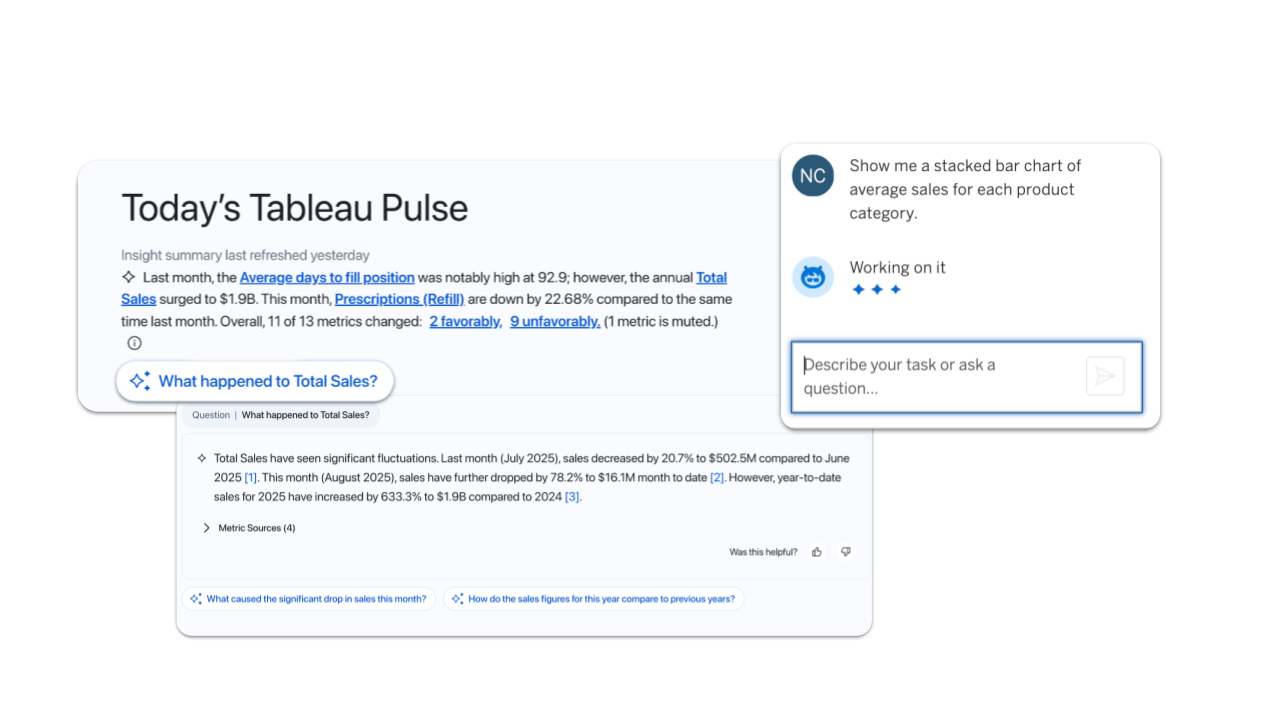
Tableau Pulse と Tableau Agent が地理情報に対応
Tableau で、より迅速かつセキュアに AI を活用可能に。Pulse と Agent は、ご利用の Data Cloud リージョンに基づいて最も近くの LLM プロバイダーに自動的に接続するようになりました。これにより、パフォーマンスが向上するとともに、データをリージョン内に保持することができます。Tableau Cloud のすべてのエディションで一般提供が開始されています。
注: 現時点では 1 つの LLM に限定されます

Tableau リリースについていち早く知るために
Tableau の DataFam Discovery (DataFam ディスカバリ) ユーザーグループでは、リリースされる新機能を Tableau プロダクトマネージャーがご紹介しています。
参加する
すべての機能
9 月
Ensure data residency and reliable availability and speed in Switzerland, India, and South Korea. Cloud Admins can now create sites in Switzerland and India. Availability in South Korea is planned by the end of September.

Tableau Mobile: Snowflake Authentication
Get faster access to insights on the go. Seamlessly authenticate Snowflake in Tableau Mobile for a streamlined sign-in process.
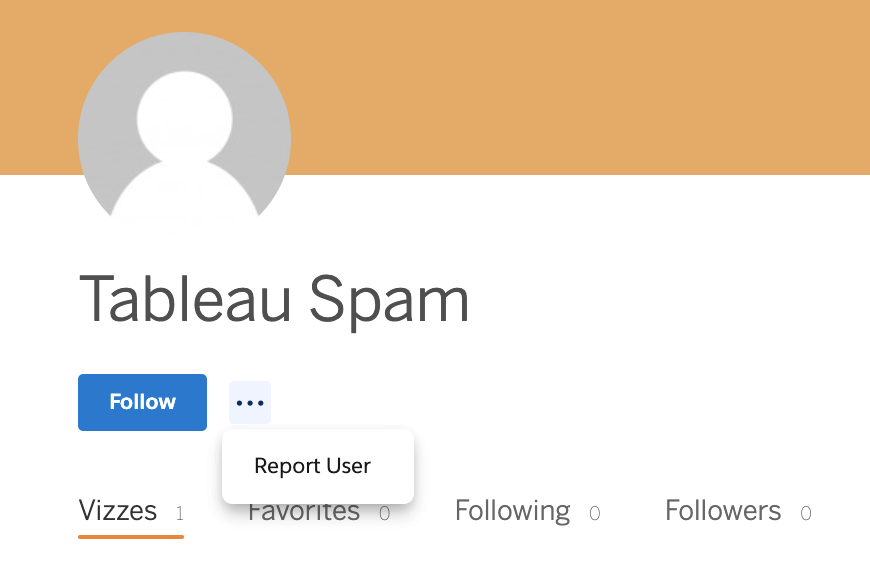
Tableau Public: Spam Moderation
Help us keep Tableau Public a safe and trusted space by reporting suspicious profiles and flagging spam. Must be logged in to report.
This feature addresses or partially addresses the following request on the Salesforce IdeaExchange: Report suspicious profiles. It also addresses [1].
Tableau Pulse and Tableau Agent are now Geo-Aware
Experience faster, more secure AI in Tableau. Now, Pulse and Agent automatically connect to the nearest LLM provider based on your Data Cloud region. This boosts performance and keeps your data in-region.
Note: Currently limited to one LLM
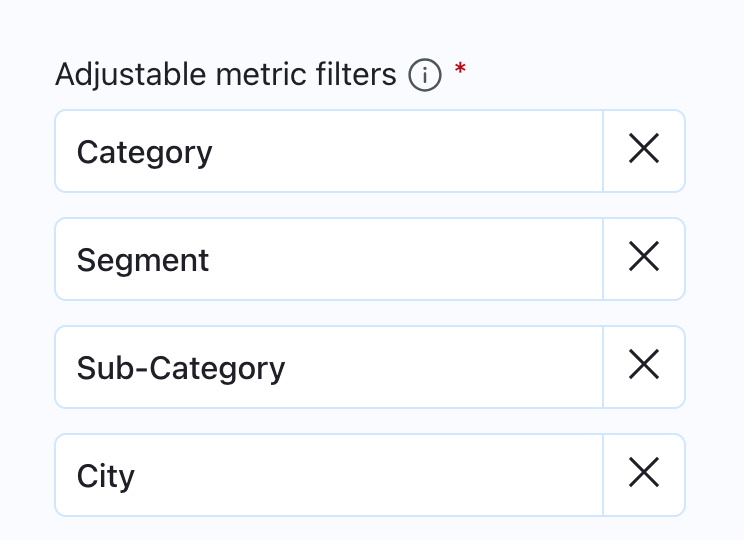
Tableau Pulse: Breakdown Chart Filtering Enhancements
Get a more consistent experience on metric detail breakdown charts with static ordering of dimension pills. Order is now based on the adjustable metric filters set on the metric definition instead of changing based on data conditions to offer a more predictable user experience.
Tableau Pulse: Correlated Metrics Insights
Get even deeper insights in Tableau Pulse with a new insight type. Correlated Metrics helps you find significant relationships between metrics by identifying key correlations in your data.
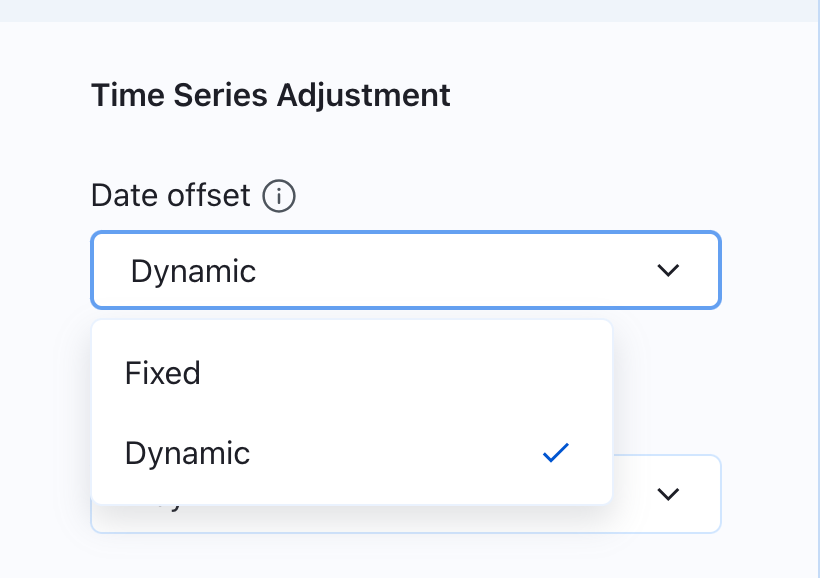
Tableau Pulse: Dynamic Date Offset
Get the most accurate view of your data over time. Set your time series to reflect the most recent data available to ensure a complete picture even when today's data hasn't been populated yet.
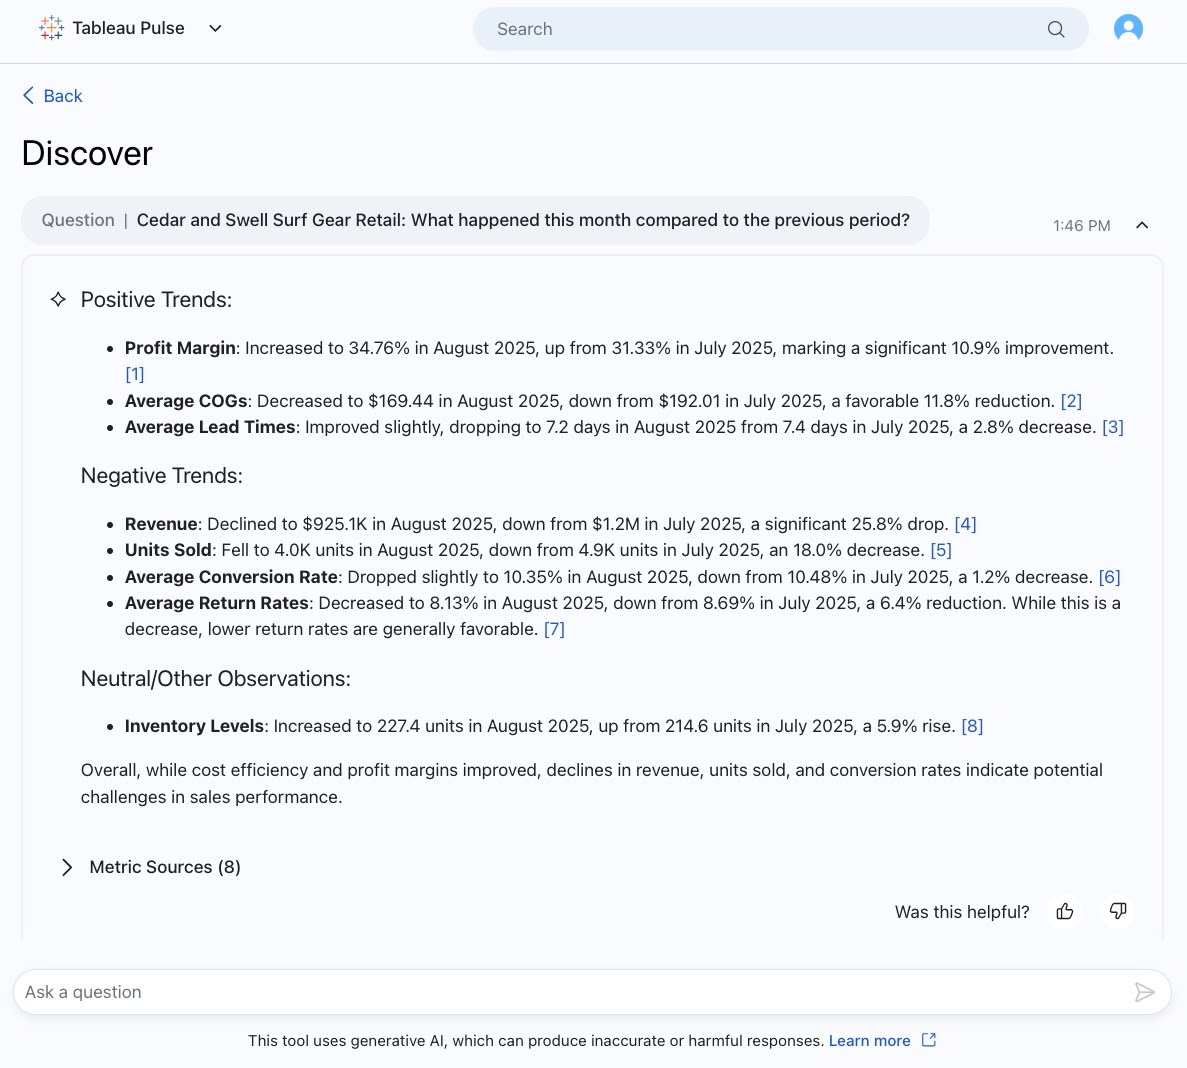
Tableau Pulse: Improved Output Text in Enhanaced Q&A
Get clearer insights in Enhanced Q&A with improved text formatting that makes outputs easily readable. Bolded text brings your attention to the most important info and bulleted, organized text makes info more digestible.
Note: Enhanced Q&A is available in Tableau+.
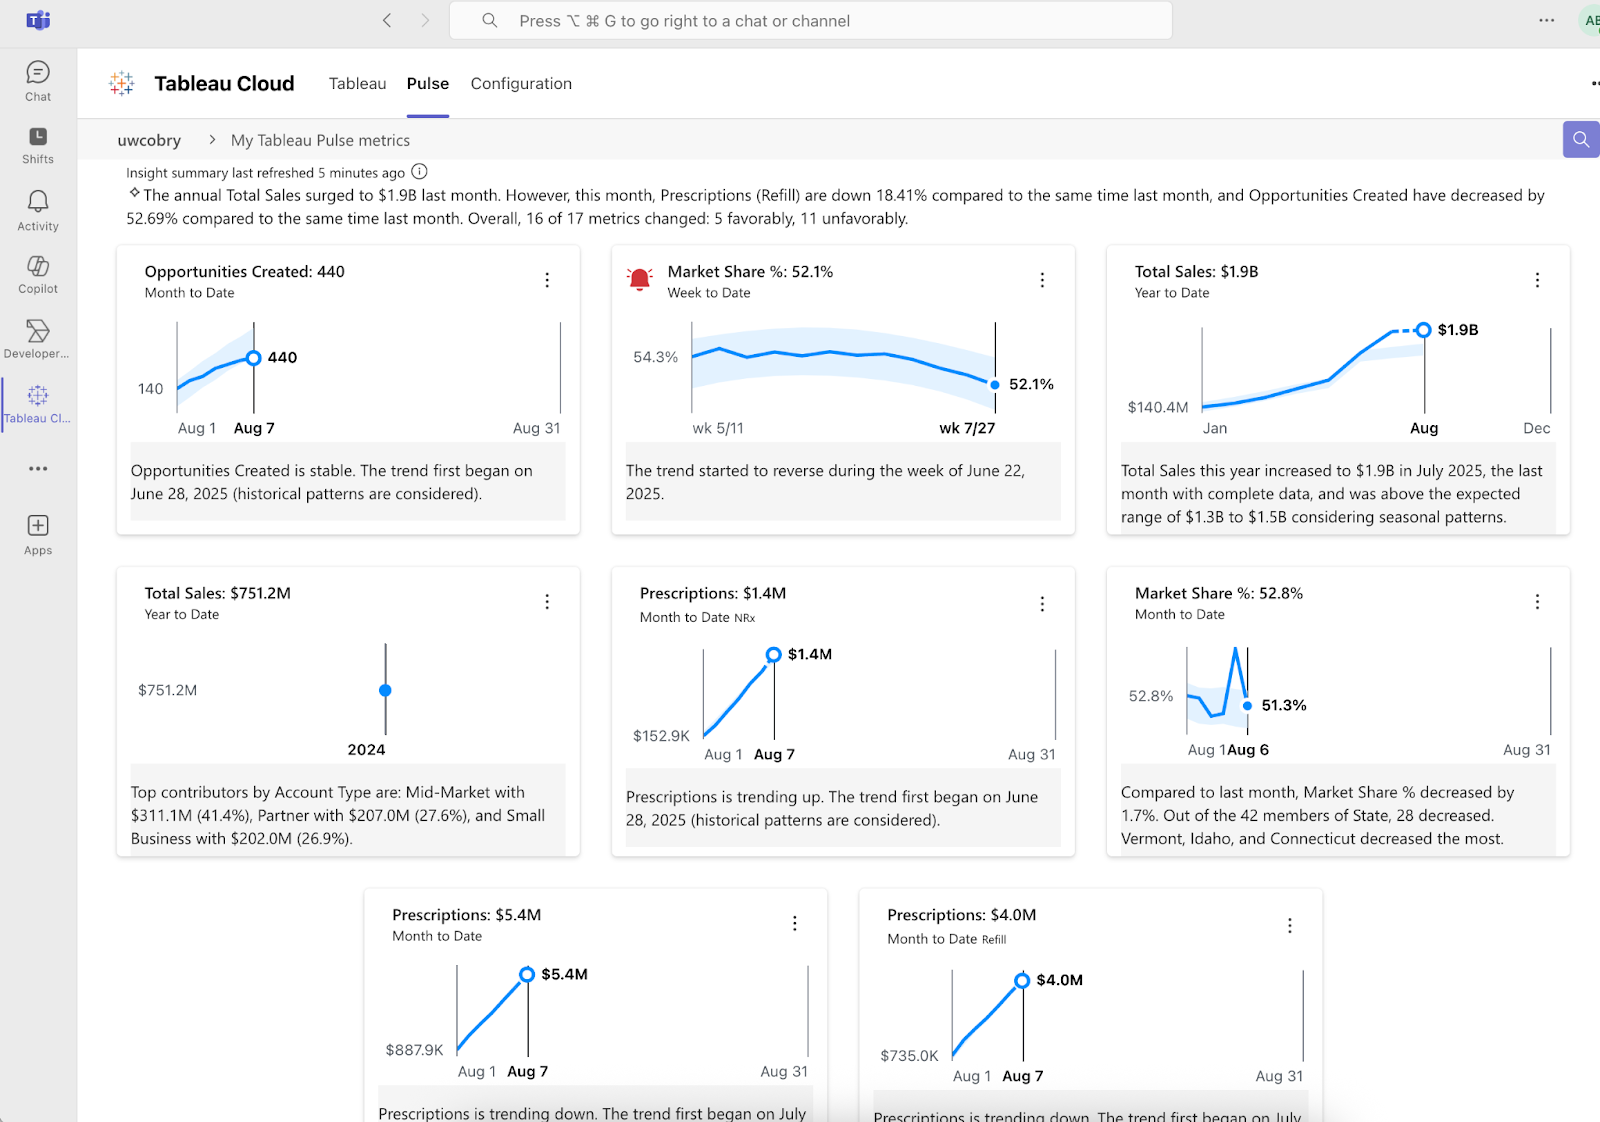
Tableau Pulse: Improvements to Teams Integration
Get more insights delivered into your Microsoft Teams workflow with deeper integrations that bring more of the Pulse experience to Teams. Get your Insight Summary, localized insights, and alerts right in your flow of work.
Tableau Pulse: New Enhanced Q&A Entry Points
Launch conversational AI from more parts of the Pulse experience and dig into metrics with Enhanced Q&A from the homepage and insight exploration page.
Note: Enhanced Q&A is available in Tableau+.

Tableau Pulse: Recommended Metrics on Mobile App
Discover metrics that matter to you with new recommended metrics on the Tableau Mobile app. You no longer need to leave the mobile app and search manually for metrics. Simply follow recommended metrics and instantly start receiving insights on the go.
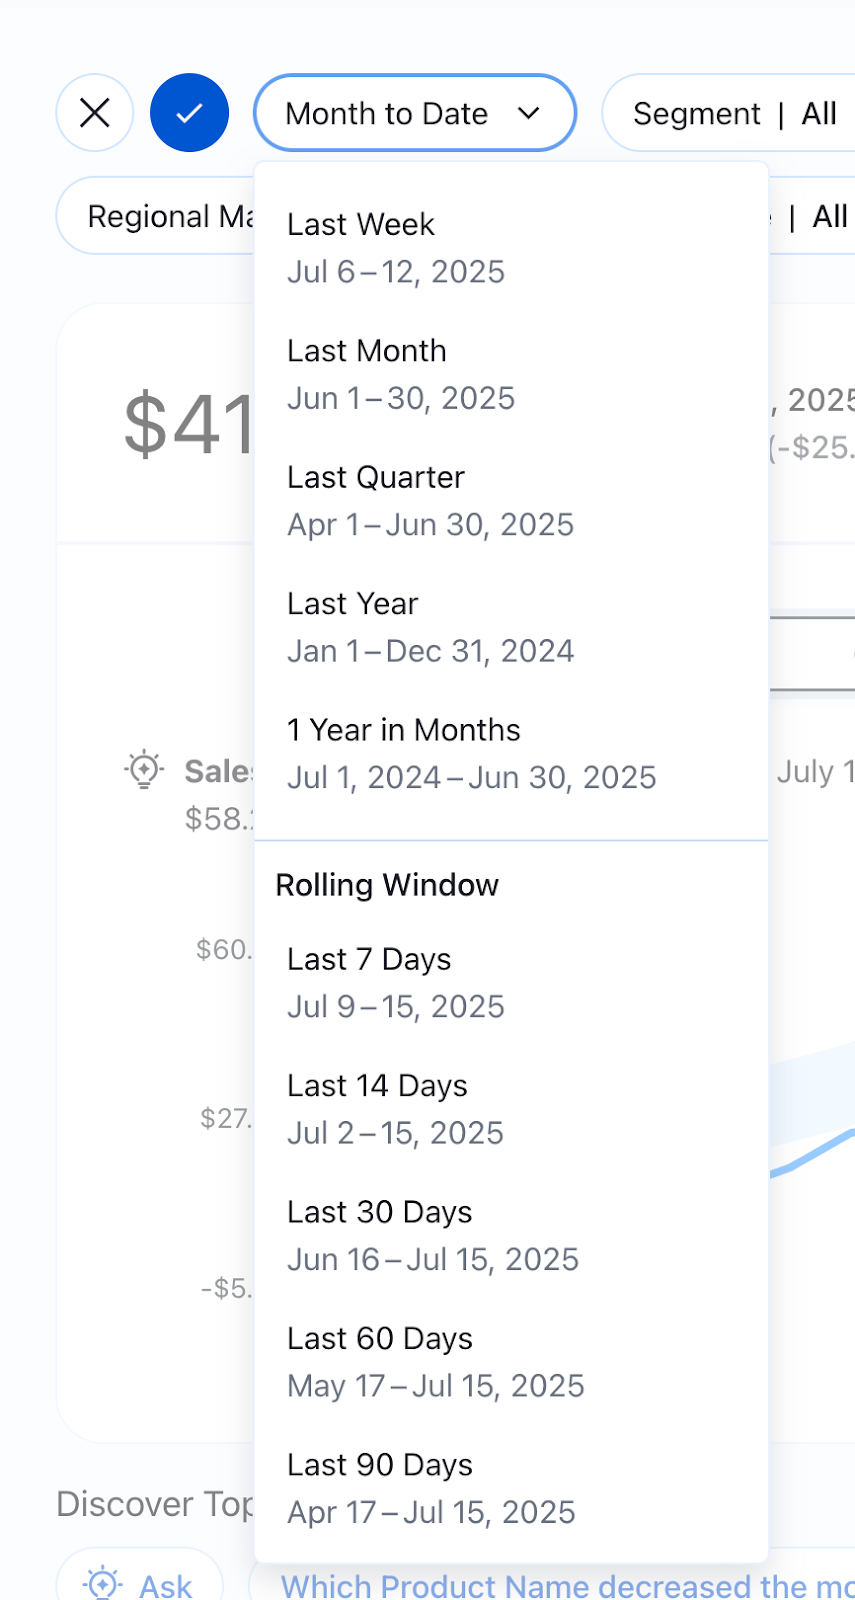
Tableau Pulse: Rolling Time Ranges
Examine the performance of your key metrics with a wider selection of time ranges to get a more precise understanding. Broader time ranges now include rolling time ranges like the last 7 days or last 90 days and more
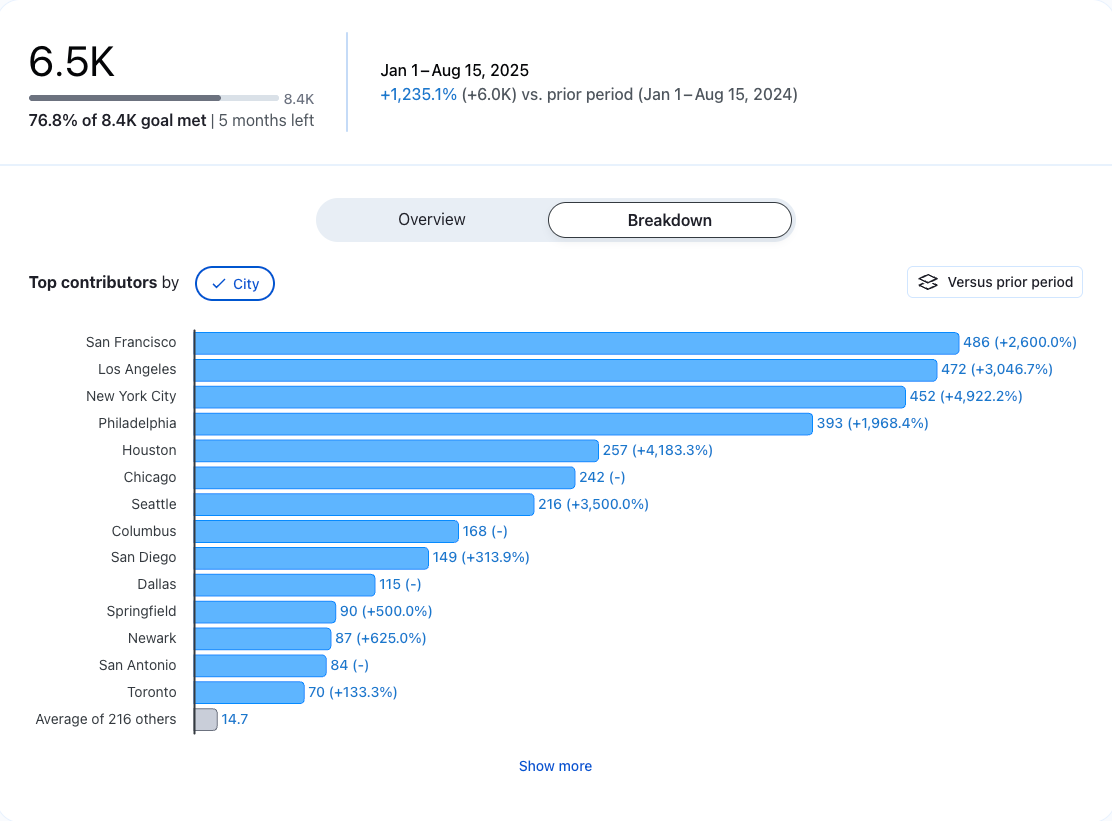
Tableau Pulse: See More Data on Breakdown Charts
Gain a more complete picture of the drivers behind a metric or goal with the “Show More” button on breakdown charts. See beyond the top 7 contributors to the insight to dig deeper and see the more minor contributors easily.
This feature addresses or partially addresses the following request on the Salesforce IdeaExchange: Reload Current Tab.