
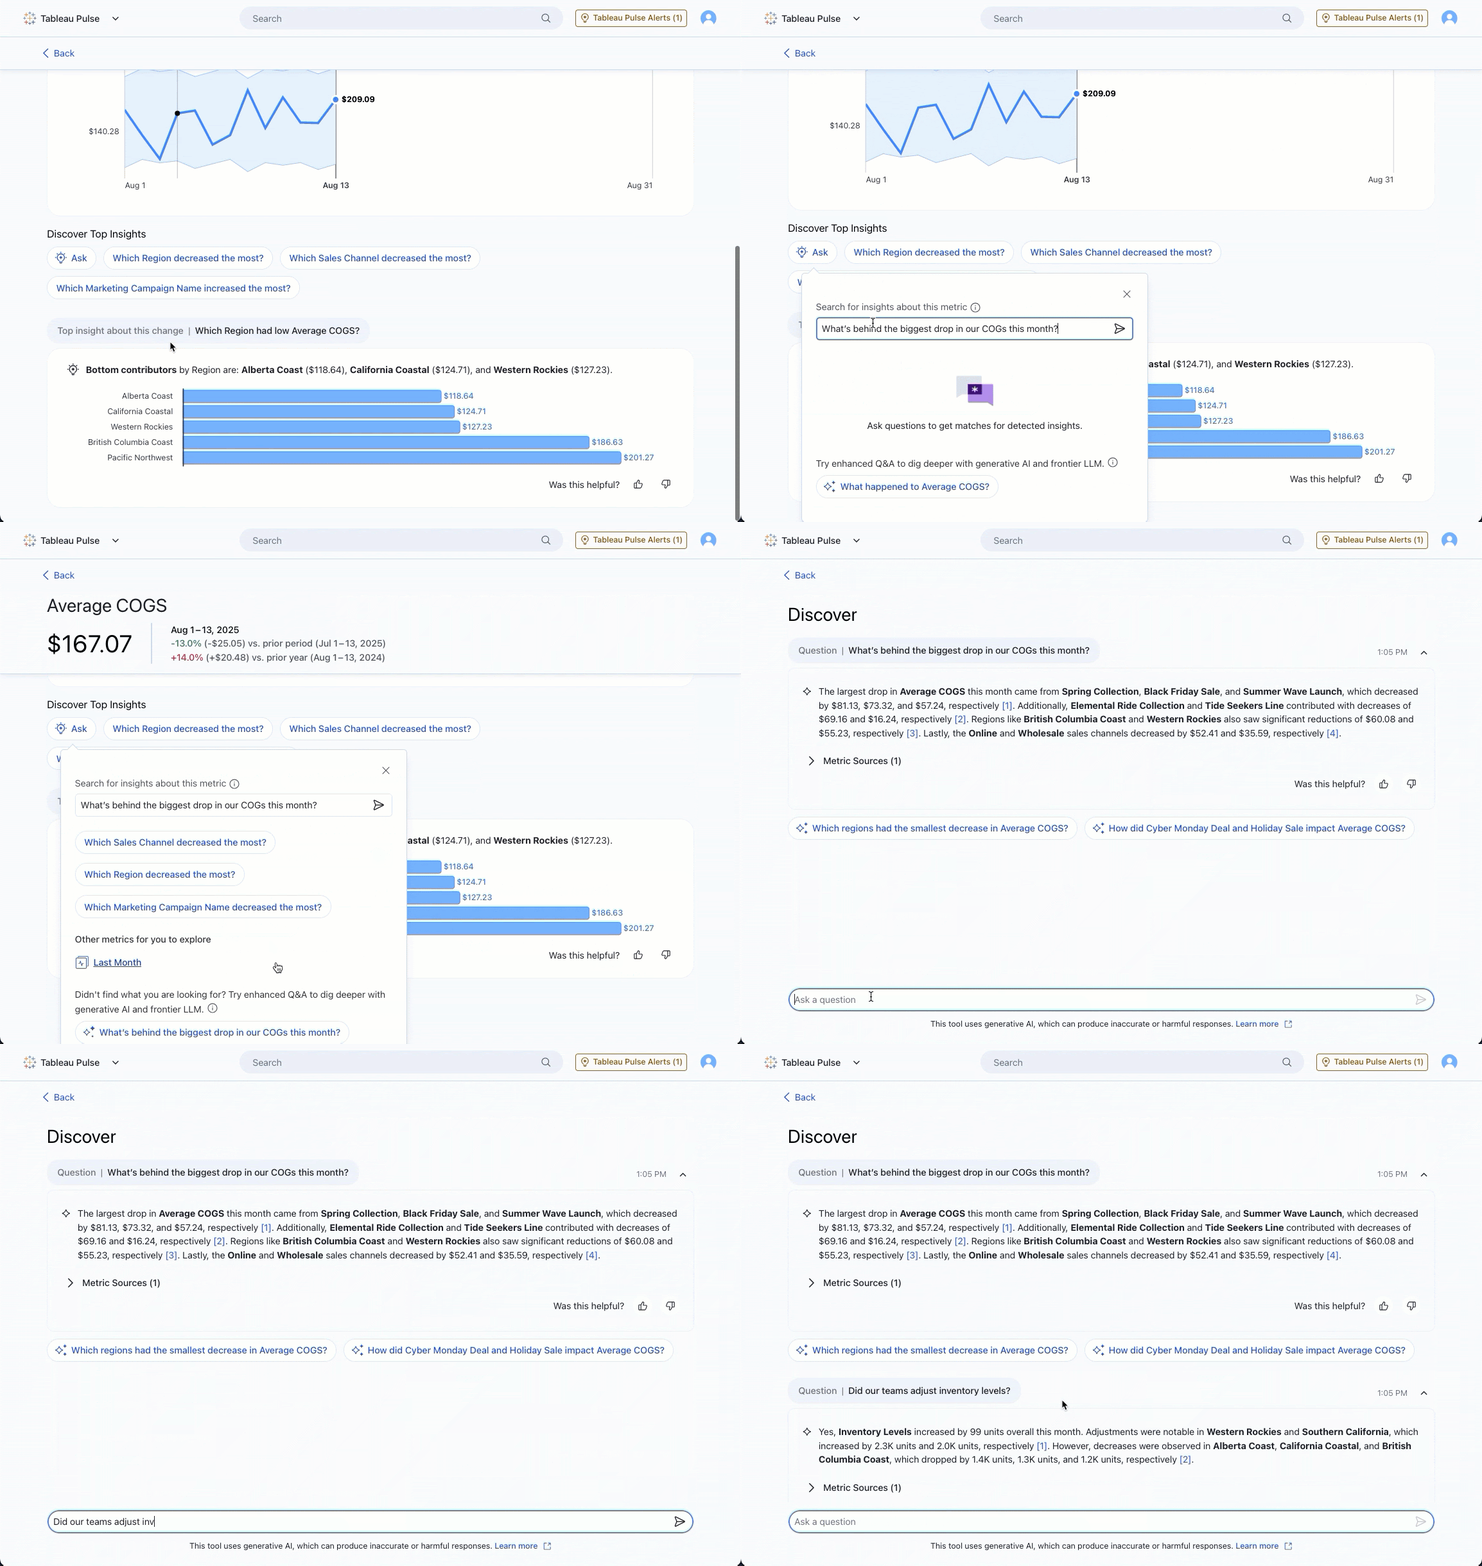
Tableau Pulse: 새로운 Enhanced Q&A 업데이트
Enhanced Q&A 업데이트로 인사이트와 더 빨리 상호 작용할 수 있습니다. 홈페이지 또는 인사이트 탐색 페이지 등 어떤 진입점에서든 대화형 AI를 시작할 수 있습니다. 또한, 개선된 텍스트 서식 지정으로 인사이트를 더 분명하게 이해하고 더 체계적인 결과를 얻을 수 있습니다. Tableau Cloud의 Tableau+ 버전에 정식 출시되었습니다.
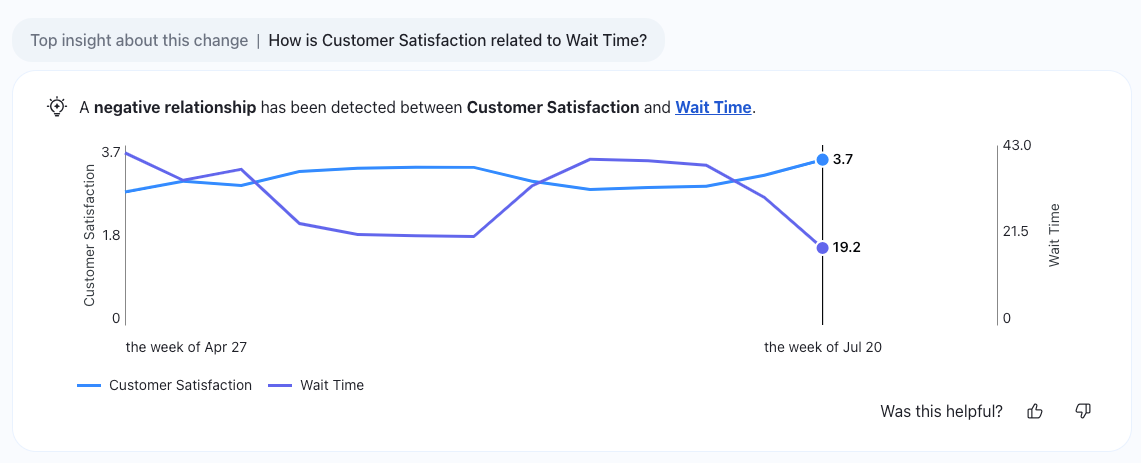
Tableau Pulse: 상관관계가 있는 메트릭 인사이트
새 인사이트 유형으로 Tableau Pulse에서 더 심층적인 인사이트를 얻습니다. 상관관계가 있는 메트릭으로 데이터에서 주요 상관관계를 식별함으로써 메트릭 간의 중요한 관계를 찾을 수 있습니다. Tableau Cloud의 Tableau+ 버전에 정식 출시되었습니다.
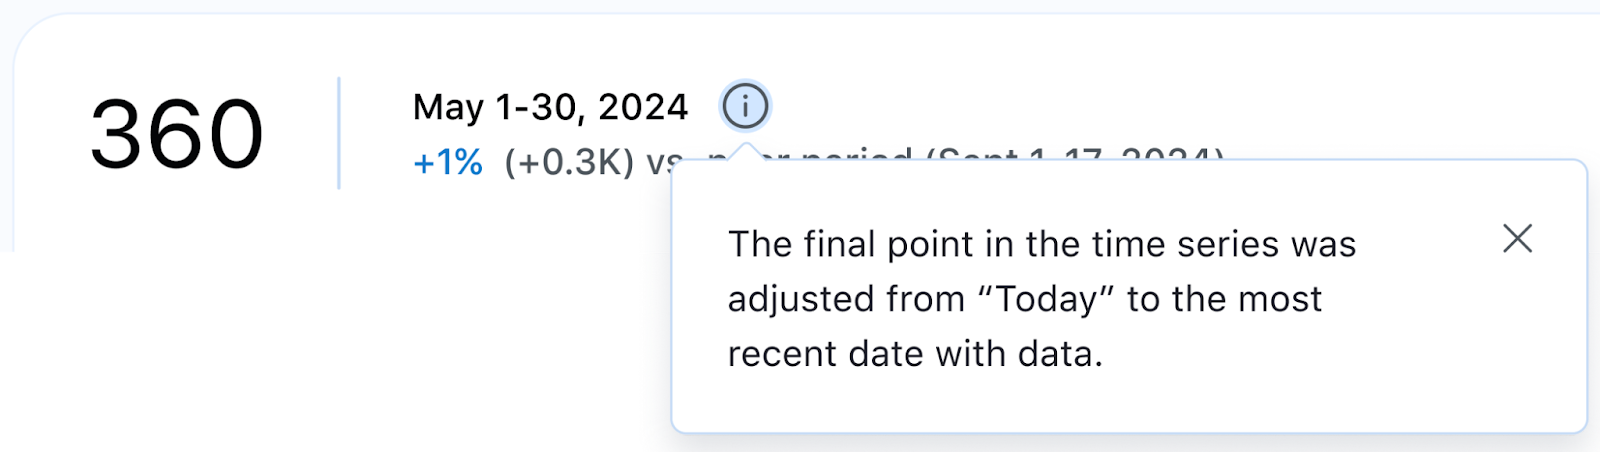
Tableau Pulse: Date Updater
시간의 흐름에 따른 성과를 더 정확하게 확인하기 위한 날짜를 설정합니다. 지난 7일 또는 90일 같은 진행 시간 범위를 선택하여 성과를 더 정확하게 파악하십시오. 또한, 시계열을 동적으로 설정하여 가장 최근에 사용할 수 있게 된 데이터를 반영하도록 함으로써 오늘의 데이터가 아직 채워지지 않은 경우에도 전체 상황을 파악할 수 있습니다. 모든 Tableau Cloud 버전에 정식 출시되었습니다.
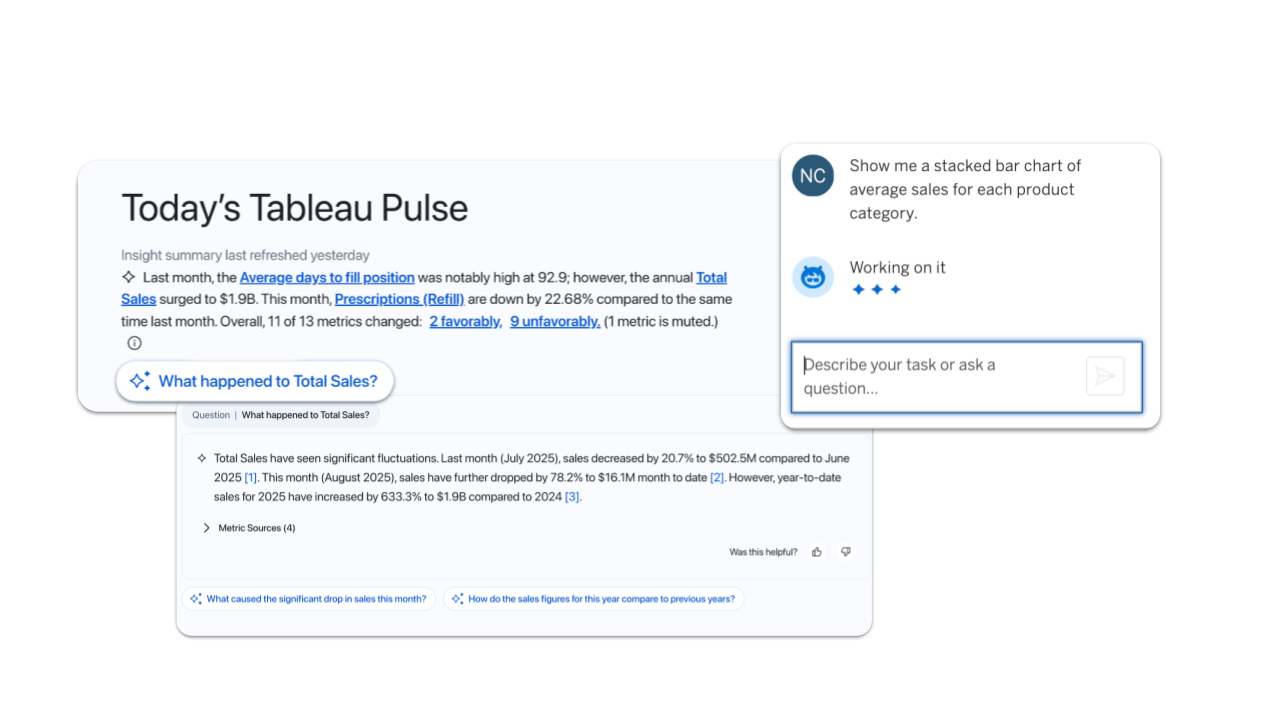
이제 Tableau Pulse와 Tableau Agent가 지리를 인식하고 작동
Tableau에서 더 빠르고 더 안전한 AI를 경험하십시오. 이제 해당 Data Cloud 지역에 따라 Pulse와 에이전트가 자동으로 가장 가까운 LLM 공급자에 연결합니다. 이로써 성능이 향상되고 데이터를 해당 지역에 보관합니다. 모든 Tableau Cloud 버전에 정식 출시되었습니다.
참고: 현재 하나의 LLM으로만 가능합니다.

Tableau 릴리스에 대해 다른 사람보다 먼저 알아보기
DataFam Discovery 사용자 그룹에서 Tableau 제품 관리자와 함께 곧 출시되는 새로운 기능에 대해 알아보십시오.
지금 가입
모든 기능
9월

Ensure data residency and reliable availability and speed in Switzerland, India, and South Korea. Cloud Admins can now create sites in Switzerland and India. Availability in South Korea is planned by the end of September.

Tableau Mobile: Snowflake Authentication
Get faster access to insights on the go. Seamlessly authenticate Snowflake in Tableau Mobile for a streamlined sign-in process.
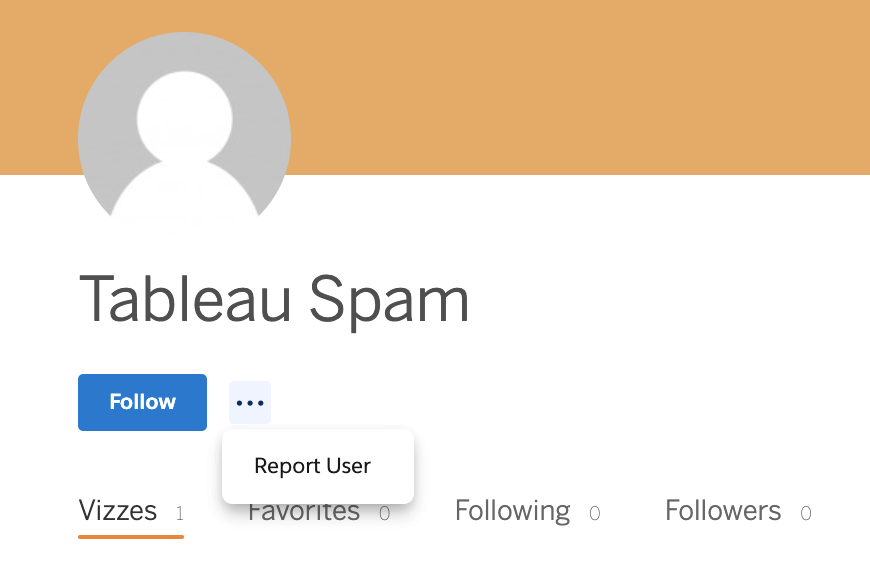
Tableau Public: Spam Moderation
Help us keep Tableau Public a safe and trusted space by reporting suspicious profiles and flagging spam. Must be logged in to report.
This feature addresses or partially addresses the following request on the Salesforce IdeaExchange: Report suspicious profiles. It also addresses [1].

Tableau Pulse and Tableau Agent are now Geo-Aware
Experience faster, more secure AI in Tableau. Now, Pulse and Agent automatically connect to the nearest LLM provider based on your Data Cloud region. This boosts performance and keeps your data in-region.
Note: Currently limited to one LLM
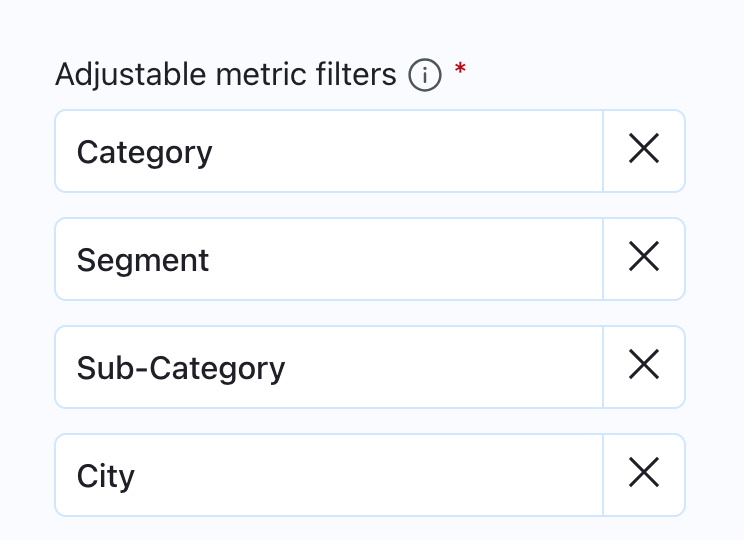
Tableau Pulse: Breakdown Chart Filtering Enhancements
Get a more consistent experience on metric detail breakdown charts with static ordering of dimension pills. Order is now based on the adjustable metric filters set on the metric definition instead of changing based on data conditions to offer a more predictable user experience.
Tableau Pulse: Correlated Metrics Insights
Get even deeper insights in Tableau Pulse with a new insight type. Correlated Metrics helps you find significant relationships between metrics by identifying key correlations in your data.
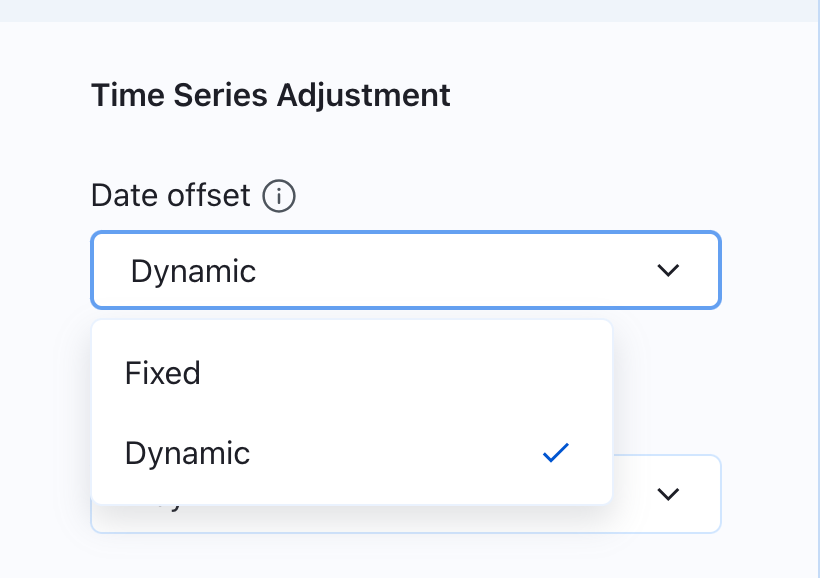
Tableau Pulse: Dynamic Date Offset
Get the most accurate view of your data over time. Set your time series to reflect the most recent data available to ensure a complete picture even when today's data hasn't been populated yet.
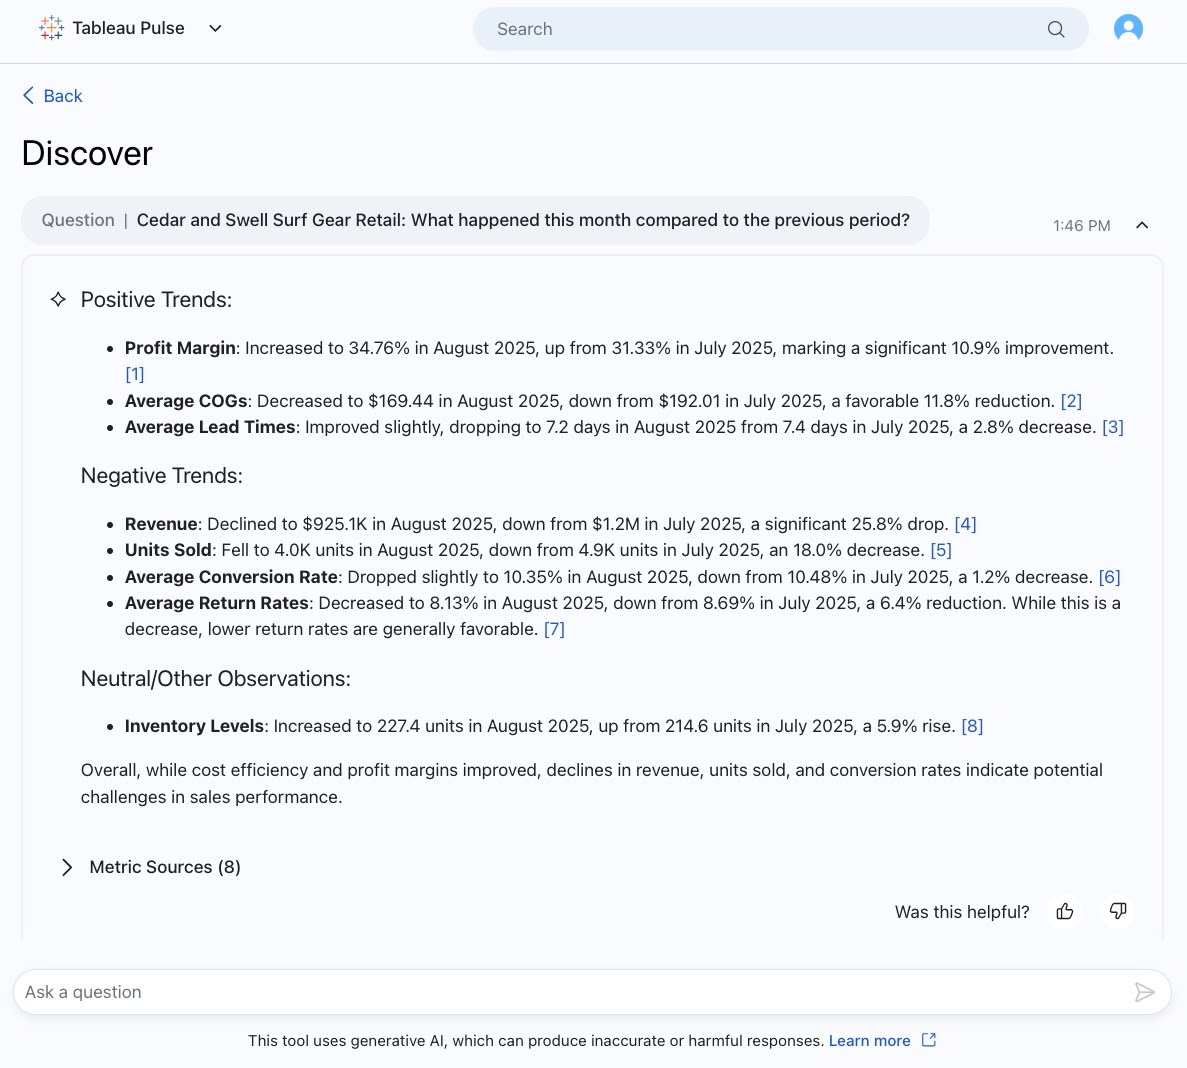
Tableau Pulse: Improved Output Text in Enhanaced Q&A
Get clearer insights in Enhanced Q&A with improved text formatting that makes outputs easily readable. Bolded text brings your attention to the most important info and bulleted, organized text makes info more digestible.
Note: Enhanced Q&A is available in Tableau+.
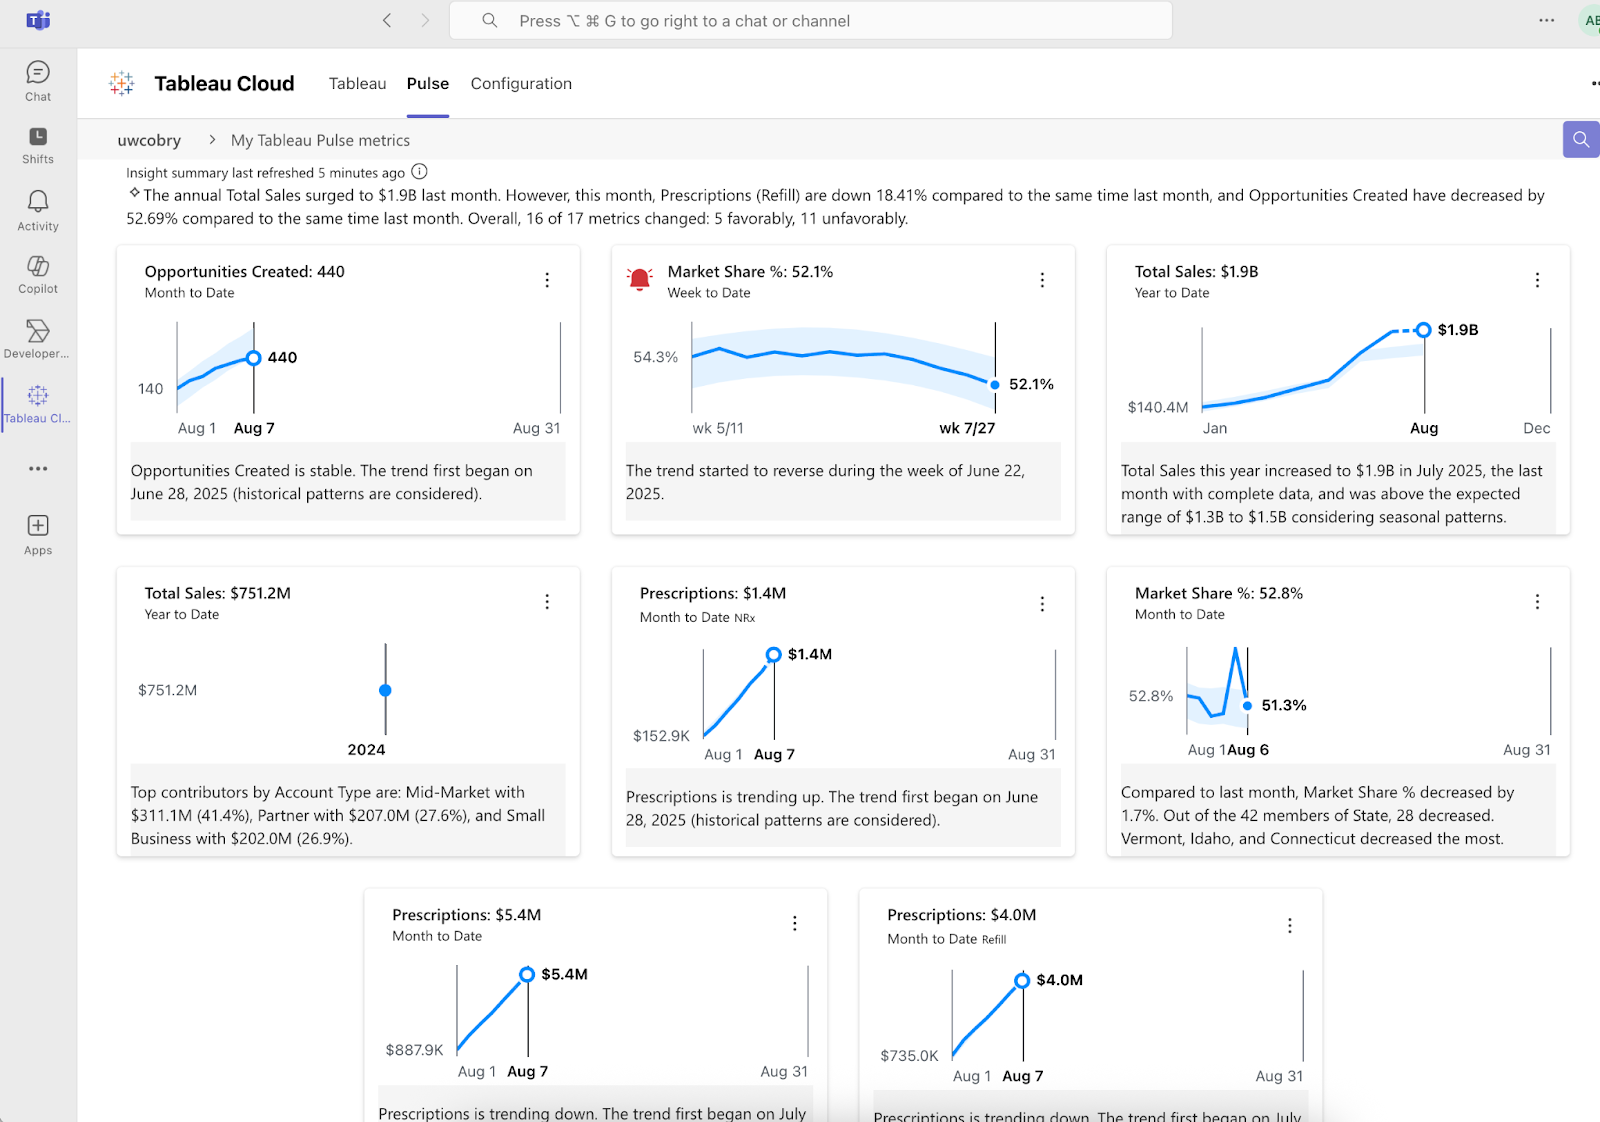
Tableau Pulse: Improvements to Teams Integration
Get more insights delivered into your Microsoft Teams workflow with deeper integrations that bring more of the Pulse experience to Teams. Get your Insight Summary, localized insights, and alerts right in your flow of work.
Tableau Pulse: New Enhanced Q&A Entry Points
Launch conversational AI from more parts of the Pulse experience and dig into metrics with Enhanced Q&A from the homepage and insight exploration page.
Note: Enhanced Q&A is available in Tableau+.

Tableau Pulse: Recommended Metrics on Mobile App
Discover metrics that matter to you with new recommended metrics on the Tableau Mobile app. You no longer need to leave the mobile app and search manually for metrics. Simply follow recommended metrics and instantly start receiving insights on the go.
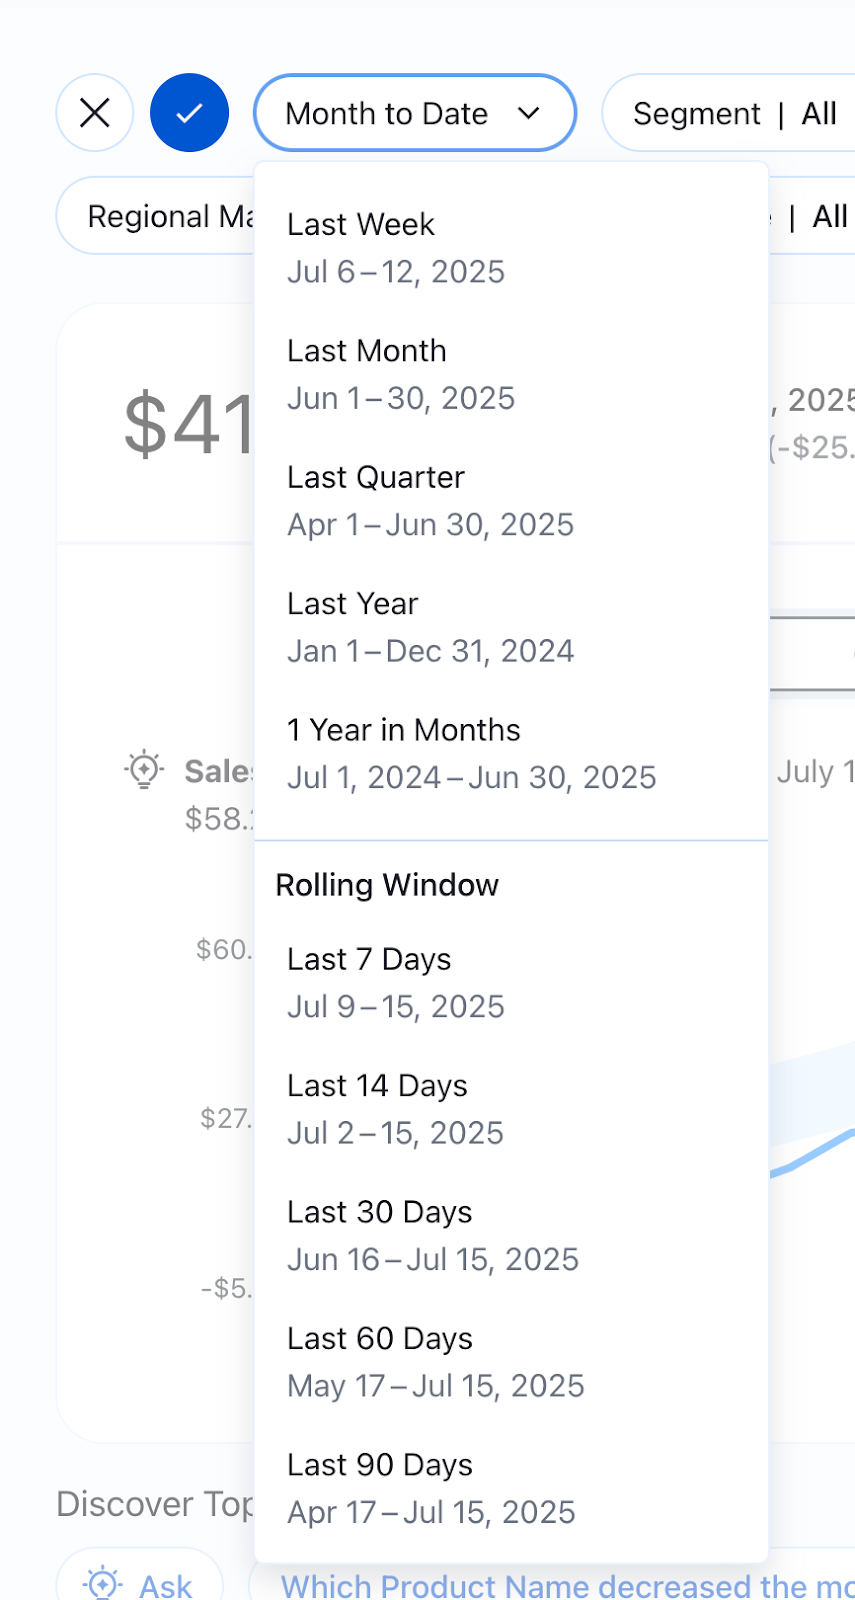
Tableau Pulse: Rolling Time Ranges
Examine the performance of your key metrics with a wider selection of time ranges to get a more precise understanding. Broader time ranges now include rolling time ranges like the last 7 days or last 90 days and more
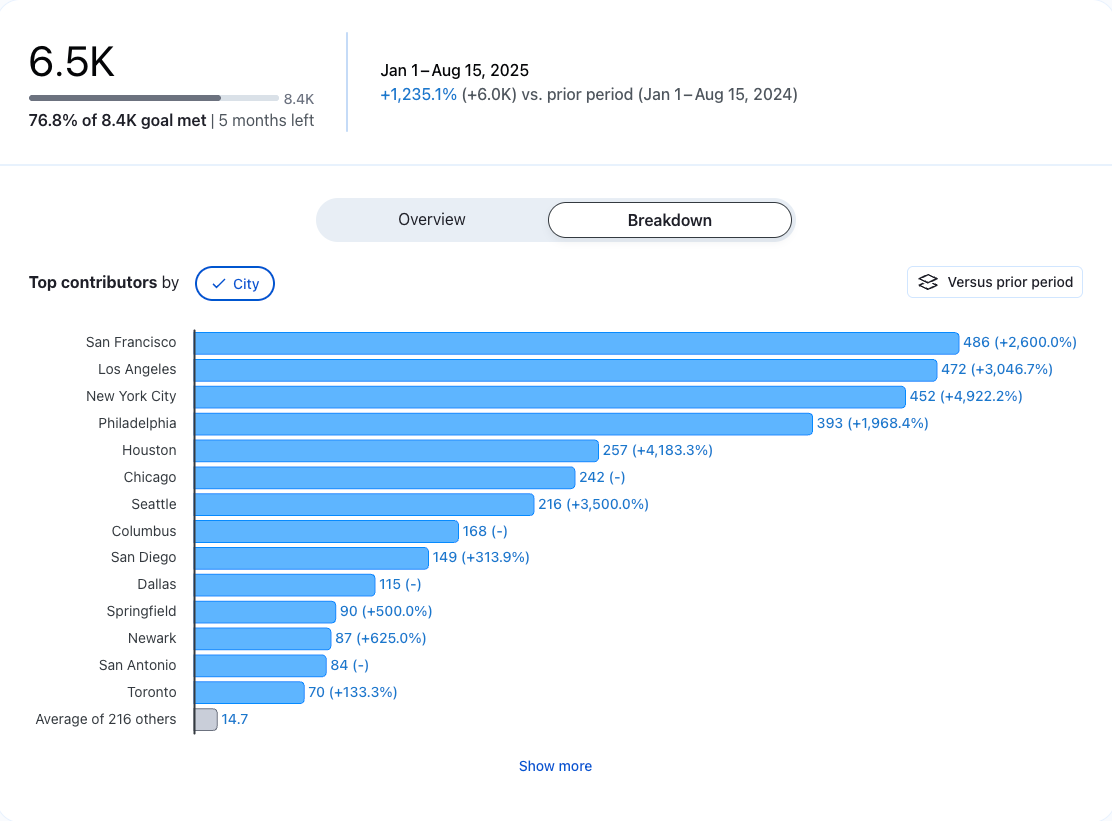
Tableau Pulse: See More Data on Breakdown Charts
Gain a more complete picture of the drivers behind a metric or goal with the “Show More” button on breakdown charts. See beyond the top 7 contributors to the insight to dig deeper and see the more minor contributors easily.
This feature addresses or partially addresses the following request on the Salesforce IdeaExchange: Reload Current Tab.