What can you learn from attending the Tableau Public User Group?


Tableau Public has revolutionized the way we visualize data, enabling data analysts to create and share powerful, interactive visualizations in just a few clicks with drag-and-drop ease. But behind our free data visualization platform are the people who power it—a vibrant community of data enthusiasts and a thriving network of groups filled with non-stop creativity and knowledge where members gather formally and informally to exchange insights, learn new techniques, and connect with like-minded individuals.
In this blog post, I focus on one of the newer groups formally doing this and interview Tableau User Group Ambassador (TUG) Eric A Howard about why he decided to start this new user group.
What is the Tableau Public User Group?
The Tableau Public User Group is a monthly virtual meeting for anyone interested in improving their data skills and learning from others. It delves into the How behind the "Art of the Possible". Tableau Public is chocked full of beautiful data visualizations and some of the best are awarded Viz of the Day. This User Group focuses on recognizing these authors and giving them a platform to share their data viz development skills. In addition, it highlights what it takes to achieve Viz of the Day on Tableau Public.
What are the benefits of attending?
For me the main benefit is inspiration. I’ve also learned about features in Tableau and data prep tools that I'm not familiar with and typically don’t use for work. Tools that are available for data modeling and graphics design that help make visually stunning vizzes. That exposure to new ways of using Tableau and data tools helps me become a better analytics developer.
It recently won a Vizzie as TUG of the Year!
There are Tableau User Groups all around the world. But which TUG was voted a fan favorite by the Tableau Community this year?
It was a tie between two 2024 "TUG of the Year" Vizzie winners: Tableau Public User Group and Tableau Newbies User Group!
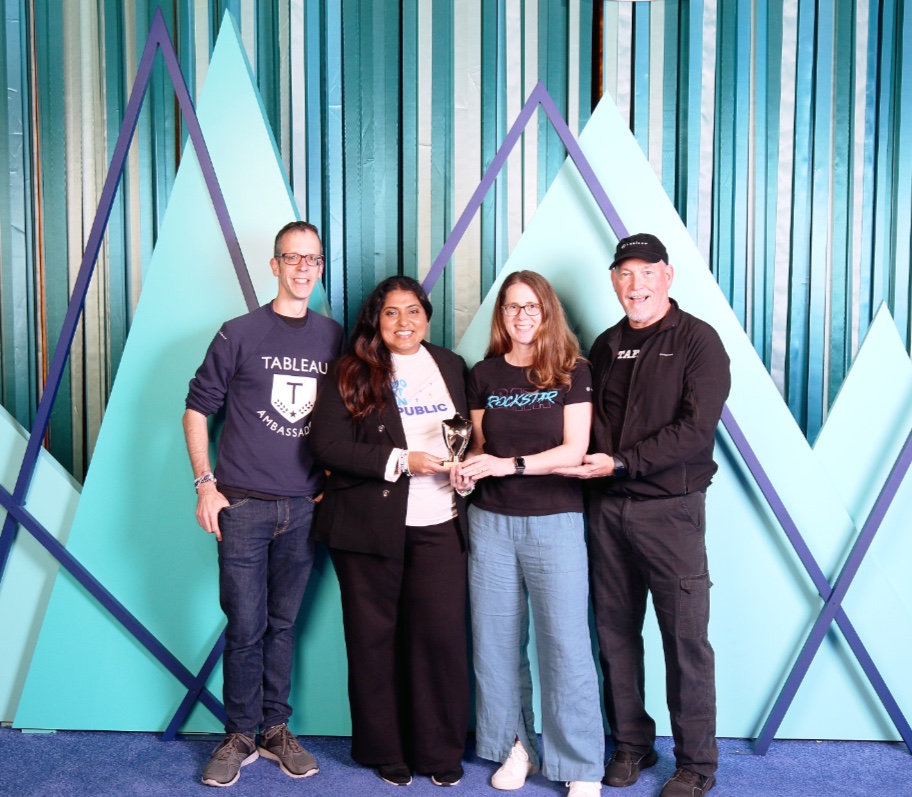
Here leaders Ant, Preethi, Agata, and Eric celebrate their group's award in San Diego during the final day of the Tableau Conference.
The Vizzies at Tableau Conference 2024This recognition is a testament to the hard work and dedication of our entire #datafam community, who share their stories and discuss all things data throughout the year on all TUGS.
What does the Tableau Public User Group cover?
In the past six months, we’ve featured business dashboards, artistic visualizations, poster-style vizzes, infographics, and a Tableau Public author who has a viz with over a million views on Tableau Public. We’ve had visualizations by Tableau Ambassadors, Visionaries, prolific creators, and occasional Tableau Public authors. All have been interesting! Our March meeting was Data + Movies themed and our meeting in July will be focused on Iron Viz.
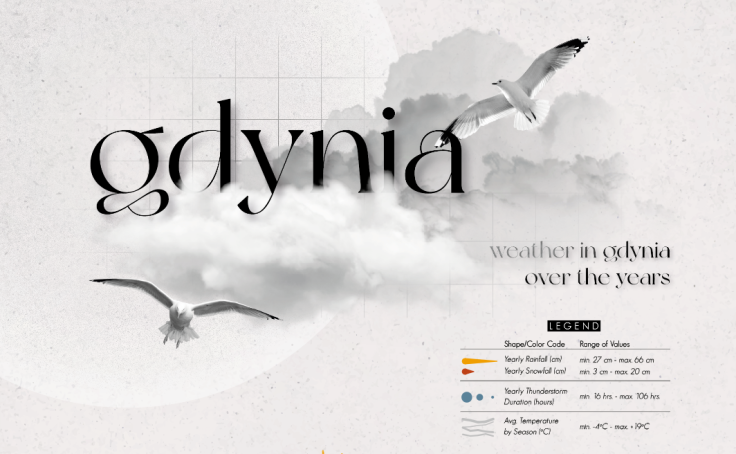
Gdynia
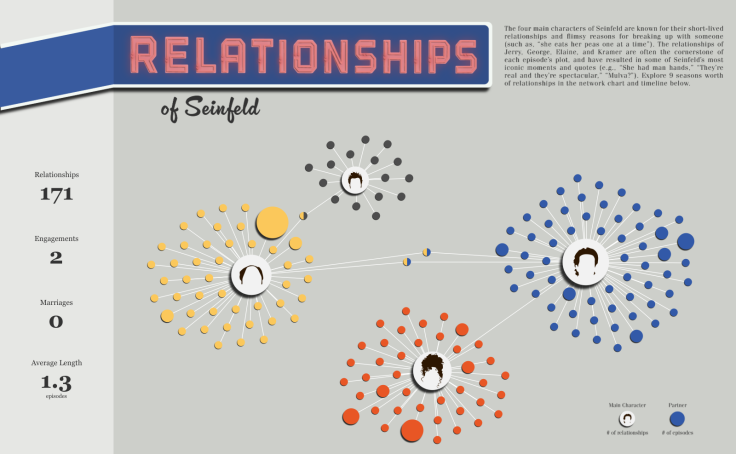
A Viz About Nothing
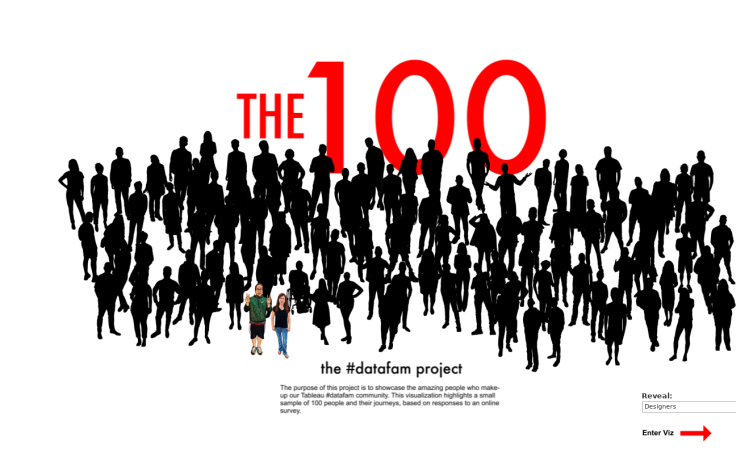
The #Datafam Project V2
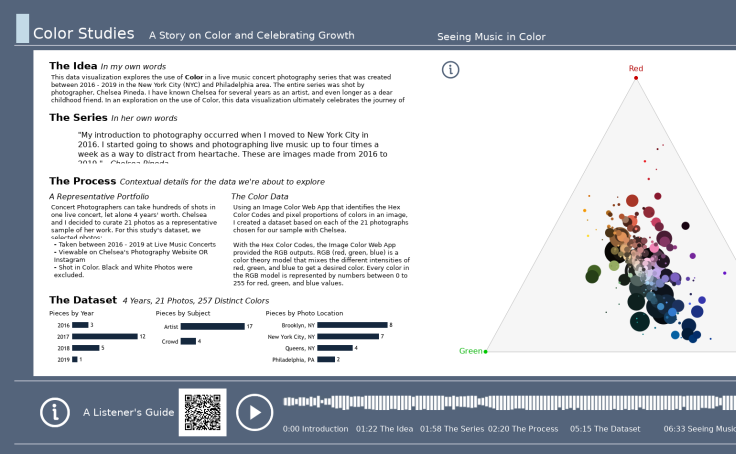
Color Studies | IronViz 2022
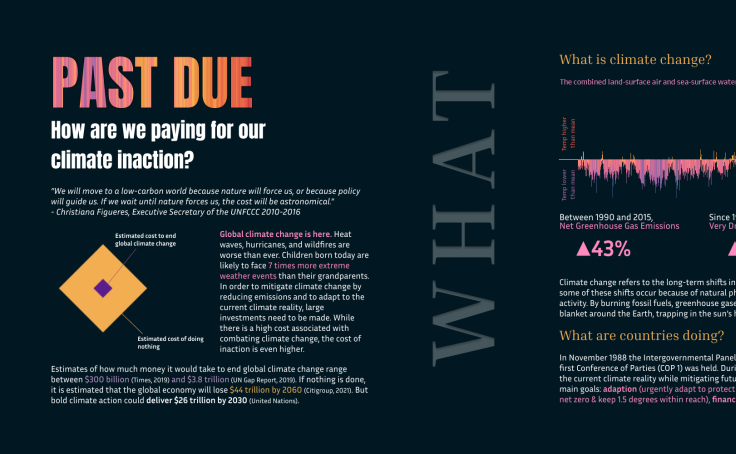
#Viz4ClimateAction Climate Financing
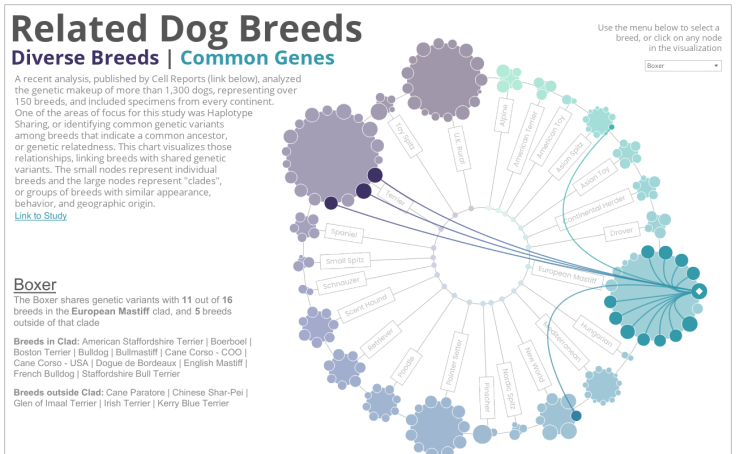
Related Dog Breeds
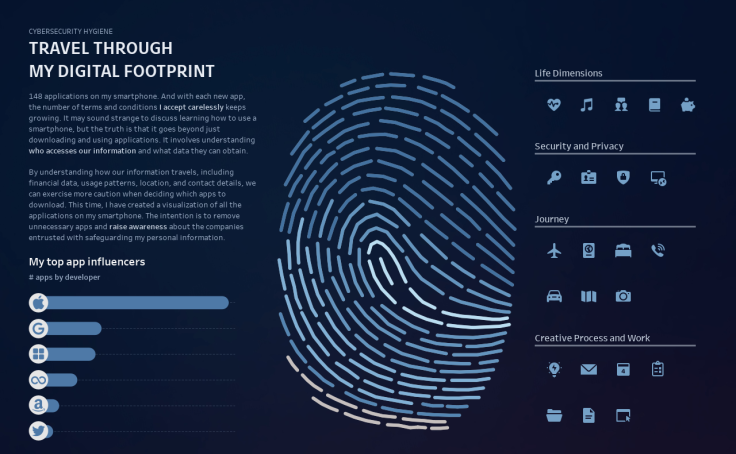
Travel Through My Digital Footprint
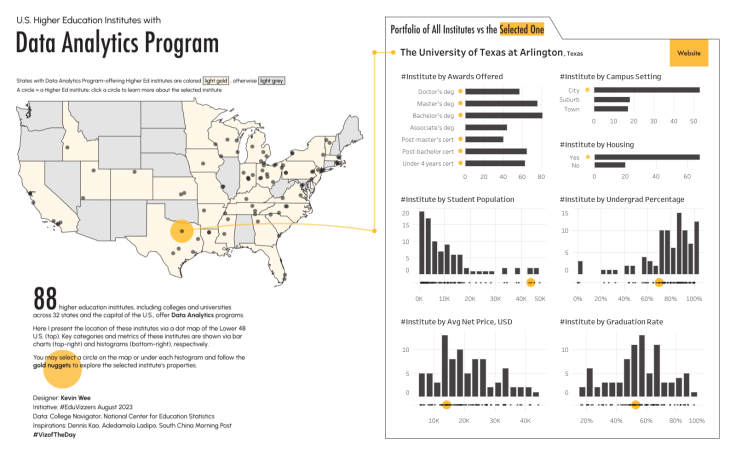
US Higher Ed Institutes w/ Data Analytics Program
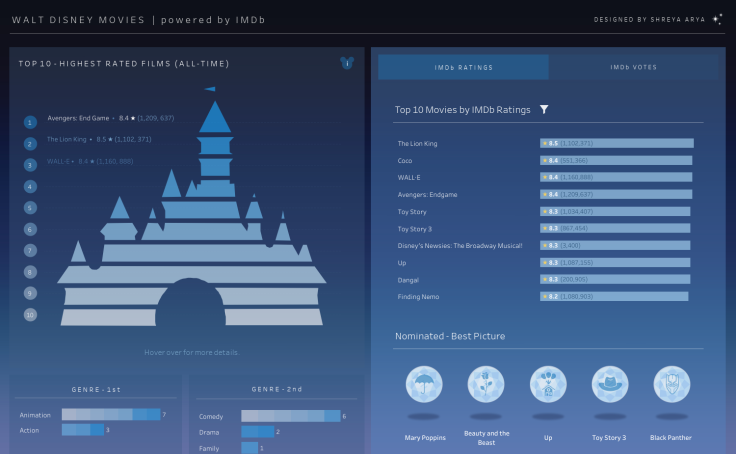
Walt Disney Movies | #DataPlusMovies
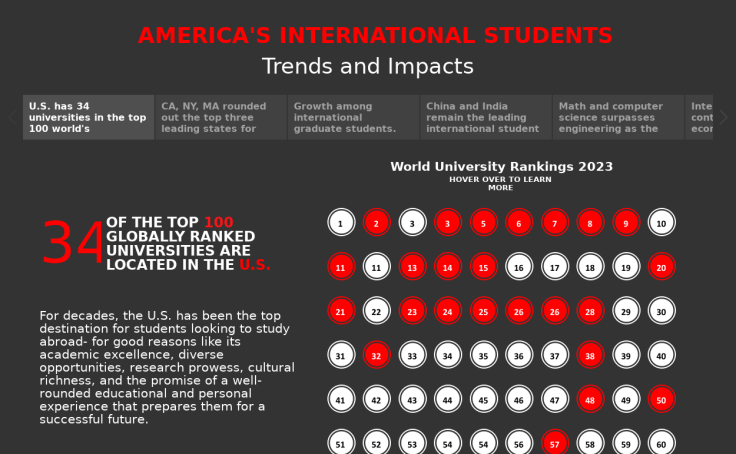
America's International Students Trends and Impacts

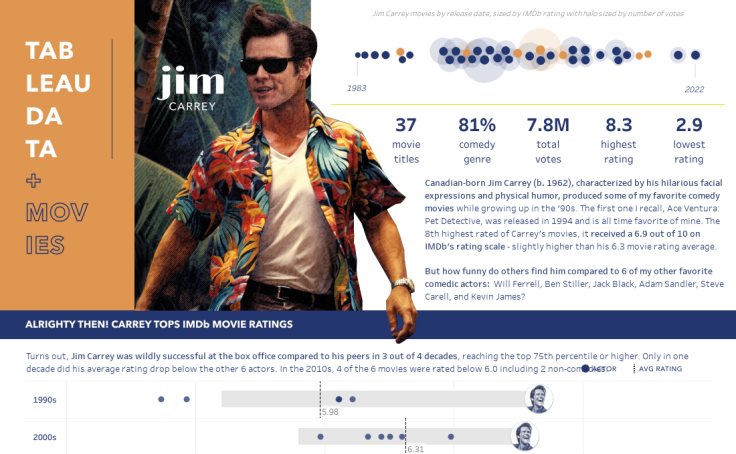
Alrighty Then! Jim Carrey's Hilarious Hits vs. Comedy All Stars
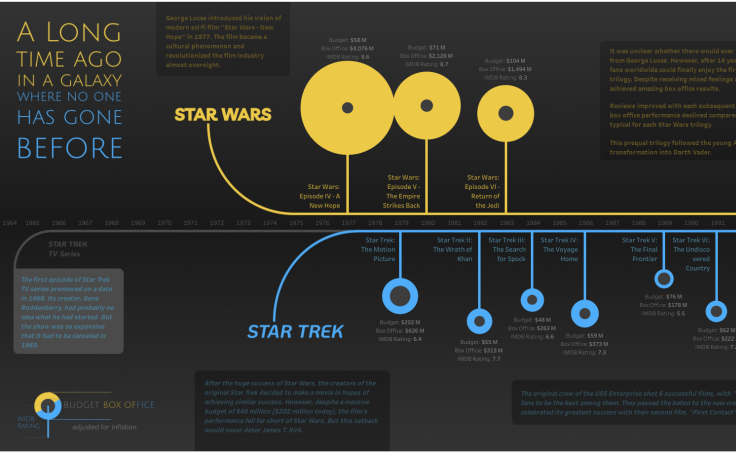
STAR WARS vs STAR TREK - #DataPlusMovies
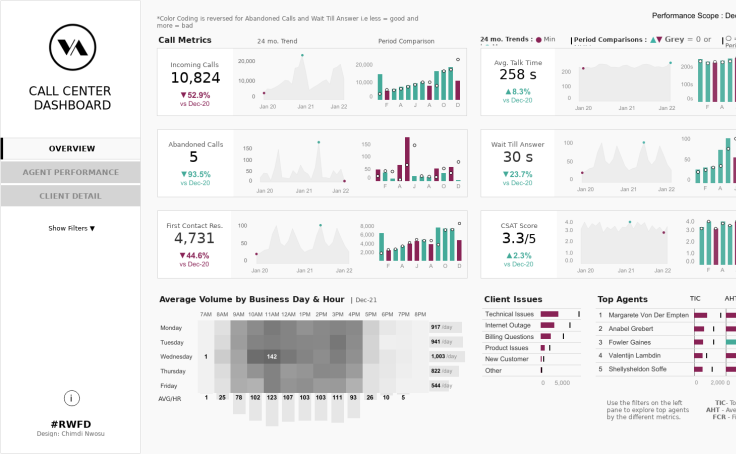
#RWFD Call Center Dashboard
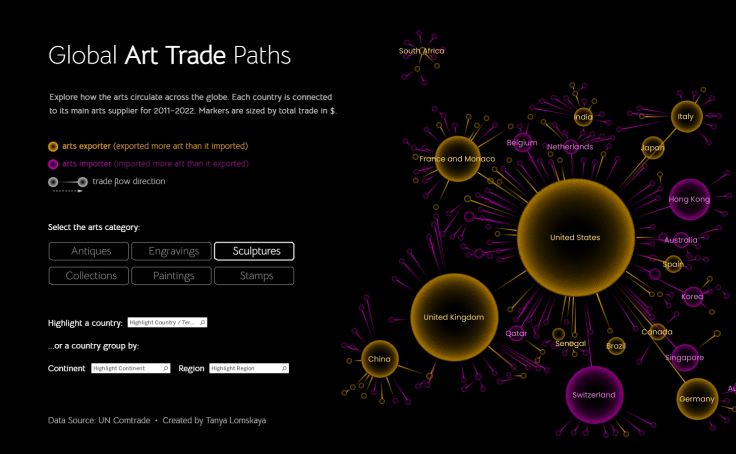
Global Art Trade Paths
Who leads the Tableau Public User Group?

Eric A Howard
Eric is a Tableau User Group Ambassador and an analytics leader based in Nashville, Tennessee, with broad expertise in leveraging Tableau for business intelligence and analytics. As Manager of Data Analytics for Vanderbilt University Medical Center’s Section of Surgical Sciences, Eric is a full-stack Tableau developer that models medical, financial, and HR data into coherent, security-sensitive views that provide detailed insights and drive surgical practice operations. His proficiencies include Tableau Prep, Tableau Desktop Creator, Site Administrator, Data Stewardship, and Data Analytics. He is also a community leader in the Tableau DataFam, helping to lead the Nashville TUG since 2019 and founding the Tableau Public TUG in 2023.
Tableau Public ProfileTableau Public is the best resource for analysts to build their data analytics portfolio. Our TUG helps show them how to make it visually stunning.

Agata Ketterick
Agata is a Business Intelligence and Data Viz Analyst at Gannett and the USA Today Network where she enables business partners to gain new insights and solve business problems with data. She has served as a Tableau Public Ambassador for the past three years and has had nine of her visualizations recognized as Viz of the Day by Tableau Public. When she's not immersed in the world of data viz, you can find Agata enjoying outdoor adventures with her family near her home in southern Maine.
Tableau Public ProfileI took on a leadership role in the Tableau Public User Group to contribute to the community that has shaped my path. Interviewing the talented and inspiring authors we invite to speak has been incredibly interesting and enjoyable.

Ant Pulley
Ant is a Senior Visualization Developer at Lloyds Banking Group, based in the UK. He has been using Tableau for over 7 years for both work and pleasure. He is a Tableau Public Ambassador for ’22, a three-time winner of the Elissa Fink 'WTF I never knew Tableau could do that’ #Vizzie ('22, '23, and ‘24), and has received 4 #VizoftheDay nominations on Tableau Public. Outside of Tableau, he has a wife and two young daughters, enjoys playing the saxophone, tennis, and is a black belt in Tae Kwon Do.
Tableau Public ProfileAs my first experience leading a TUG, I'm really enjoying the process of getting engaging speakers to talk about their amazing vizzes, and all on the platform I love–Tableau Public!
Preethi Lodha
Preethi Lodha is a highly accomplished Data Analytics and Insights Manager in Higher Education, specializing in Tableau and data visualization. As a Tableau Public Ambassador and Featured Author, she globally showcases her talent, amassing over a million views for her visualizations. Preethi co-leads the Tableau community project #DataFamCon, Tableau Public User Group, and serves on the Data + Women New England Chapter advisory board. She's a champion in national and international data visualization competitions, including Women in Analytics Data Visualization and Chart Champ. Through her Tableau Public profile, Preethi shares insights to inspire others to harness the power of data visualization.
Tableau Public ProfileTableau user groups provide an invaluable platform for data enthusiasts to connect, learn, and inspire. We empower each other to excel through collaboration and shared expertise, ensuring every member finds their pace and place.

Priyanka Dobhal
Priyanka is a Business Intelligence Technical Lead at USEReady, a leading data analytics firm, where she oversees the design and delivery of innovative and impactful solutions for clients across various domains and industries. She is currently a Tableau Public Ambassador, a featured author and has received 5 Viz of the Days on Tableau Public. With over 8+ years of experience, she leverages her expertise in Tableau, Alteryx, and Cloud Analytics to create compelling visualizations and dashboards that enable data-driven insights and decisions.
Tableau Public ProfileI strongly believe in vizzing what you love and encourage people to pick a dataset that speaks to you. This will help you in bringing out interesting insights from the data.
How do you see the group evolving?
As TUG’s go, we’re still a small. I hope more Tableau Public Authors will join us live or watch our recordings on YouTube. We strive for globally diverse authors to present their Viz of the Day and we plan to continue and expand that. In June, we will interview all the 2024 IronViz contestants, discuss their Iron Viz entries, and learn more about their creative process!
How often do you meet? Who is the audience? Where can I sign up to attend the next Tableau Public User Group?
Meetings happen approximately once a month. You can view all past and upcoming meetings on the Tableau Public User Group page. This virtual meeting is for anyone eager to learn from other’s experiences and gain insights into building data visualizations on Tableau Public. You can also see a full list of Tableau User Groups meeting virtually and in your area by visiting the TUG homepage.
Historias relacionadas

DataFam Roundup June 2026

DataFam Roundup May 2026

Iron Viz 2026: Read Between the Data
 28 Mayo, 2026