Better Government with Data Analytics: Plotting the way forward with Tableau Blueprint
Welcome to Part Four of our four-part blog series, Better Government with Data Analytics. So far, we have shared thoughts and strategies with you, as you begin or resume an analytical journey at your organization. Conveniently, Tableau created a framework to enable that journey. The framework is Tableau Blueprint, and you can use it to build a roadmap to success.


Welcome to Part Four of our four-part blog series, Better Government with Data Analytics. So far, we have shared thoughts and strategies with you, as you begin or resume an analytical journey at your organization. We’ve discussed ensuring that dashboards inform decision making, and data literacy, i.e. that je ne sais quoi that your people should continually develop. Data literacy inspires good design, which deepens organizational analytics competency.
What does it all mean?
As you read this blog series, you’re probably thinking: 1) this is awesome, and 2) how do we do it ourselves. Conveniently, Tableau created a framework to enable that journey. The framework is Tableau Blueprint, and you can use it to build a roadmap to success.
I recently reviewed a survey that stated (sadly) 92% of organizations fail to scale with analytics. I see this often in the government and education sectors, especially when analytics is treated as “nice to have”, or something to address if there’s time. Consequently, leadership is perpetually reactive, and employees move from fire to fire without an extinguisher. In order to achieve success (and organizational progress) you need a guide to direct business process, and technical architecture to support the journey. Tableau Blueprint is that guide, and I’ll explain more below.
Tableau Blueprint and the leader’s role as a change agent
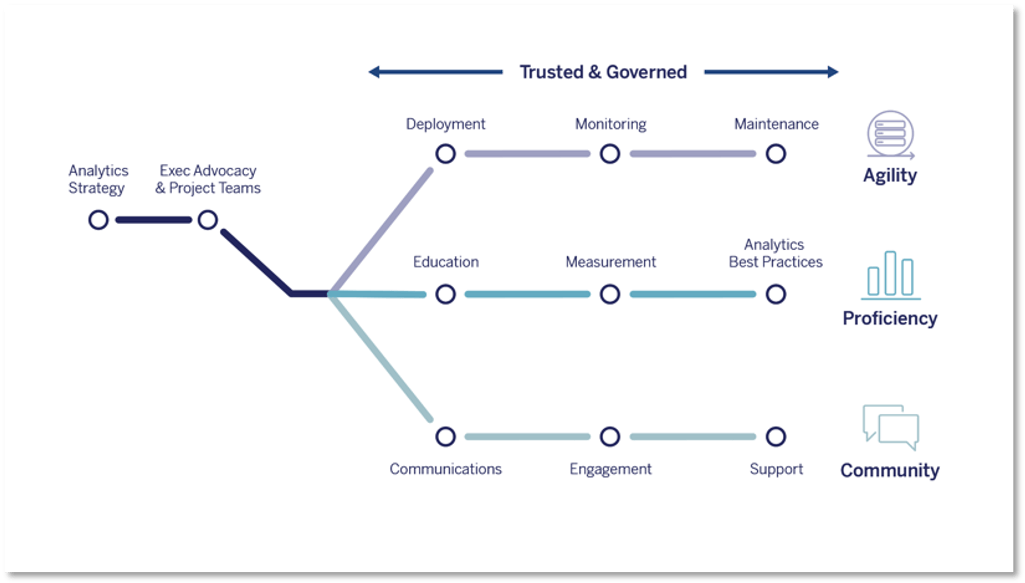
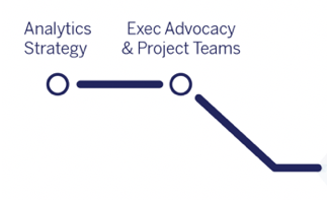
You may have thought when looking at Blueprint for the first time that the first two stops look like pre-requisites. This is no accident. An Analytics Strategy and Executive Sponsorship with defined Project Teams to lead the efforts, are both essential to kicking off with purpose and outcomes in mind.
As a leader, you are a change agent for your organization, and you have the potential to do extraordinary things. Change is inevitable, change will always happen, but you have to apply direction to change, and that's when it's progress. Tableau Blueprint provides your direction, and tangible business value created by data-literate employees is your progress. Change can either be the beacon that lights the path, or the roadblock you cannot overcome. You always have a choice to embrace change and model the behavior you’d like your organization to adopt—and with regard to Tableau Blueprint, we believe the work is worth it.
Your advocacy, inspiration, and ownership are critical in this stage, and will set the tempo for your team. Your analytics strategy should focus on outcomes that empower rather than hinder, and your goals for people, process, and platform should be well-documented. Additionally, your desired outcomes, known and desired use cases should also be considered as you begin the journey, especially if you have any “low hanging fruit” use cases with high potential for positive payback or behavioral change to prove success with the Tableau platform quickly.
The journey to agility: who really leads it?
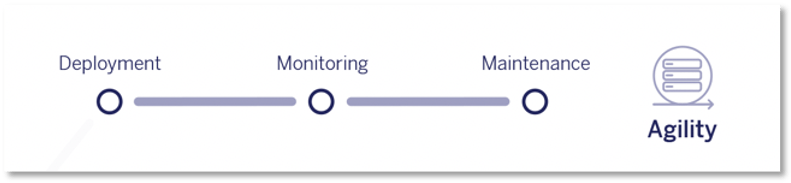
Agility is critical to success in data and analytics efforts. Proper planning now begets success later, and I don’t mean paralyzing analysis of each decision before you even begin. It’s better to define a broad scope initially, followed by rapid execution in manageable waves. I see customers regularly begin their analytical journey much smaller than they should, thinking that akin to the cornfield in Iowa, people will come, and we’ll scale later. Spoiler alert: you should consider scale first, driven by your use case/user volume.
Finally, it’s easy to mistake this as an IT-only path, but your line of business must play a role in driving relevant content and smart analytics.
Proficiency is for everyone (yes, everyone)
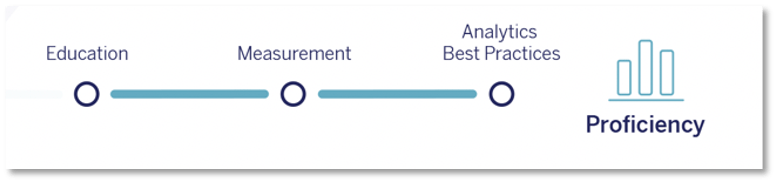
If your people are prepared (i.e. trained, enabled, and empowered) accordingly, your analytics initiative has a much greater chance of success. With preparation and clear expectations, your people can be part of the change. Absent either of those, you could be part of the 92% who are left wondering what just happened.
The reality is, everyone can and should be a data person, yet fear of change (again) gets in their way. Educating your team (all of them) is critical, as is proper timing of those efforts. If the enablement comes too early in the process (i.e. before staff are given expectations of doing analytics on their data, or else access to the platform), they will forget what they learned, and not use the product. If it comes too late or is not deep enough, people will grow frustrated and not use the product then either.
It’s the community, okay?
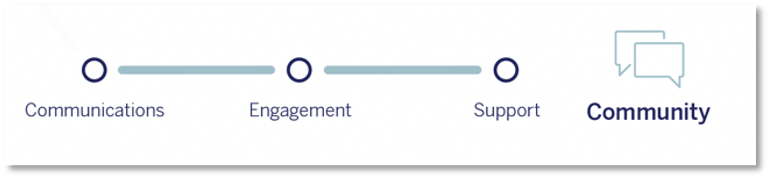
Our community has long been Tableau’s most unique differentiator. Building an organization-wide analytical community can and should be your differentiator, too. Inside your organization are highly skilled professionals who know your business up and down, and It’s these people who know your stories, but aren’t often able to tell them appropriately. They first need a platform, then they need to be enabled, and they need to realize that stories are best told with data.
Stories drive culture, while culture drives our identity, and our identity drives our behavior. Imagine if your people were empowered to use data to tell better stories of how your organization meets challenges and serves its constituents. Stories are born from your use cases, and those use cases produce data, which is synthesized into stories. The more stories your people tell, the more value you can showcase, and the better the career development they see.
Communicating with stories goes hand in hand with analytical best practices for your people. Your journey will be filled with challenges that tempt you to bow out and continue the old way because the old way is the comfy blanket people know and trust. But a data-first path will reward you with better decisions, smarter outcomes, and data literate people that are confident to do more.
Closing thoughts
Thanks for your interest in learning more about how data analytics—and Tableau Blueprint—can deliver data-driven results in your organization. We welcome the opportunity to advise you as you move toward analytical excellence, powered by data-driven decisions. Got 15 minutes? Get started with the Tableau Blueprint Assessment today.
This blog is part of a series for state, local, and education data rock stars who are interested in gaining deeper insights about how to leverage data to improve results, and build a culture of analytics within their organizations. To learn more about what Tableau can do for your organization, please visit our State and Local Government Analytics page.
Historias relacionadas

Making the Move to Tableau Cloud
 24 Octubre, 2023

How to Build a Data Community Within Your Organization
 5 Agosto, 2023
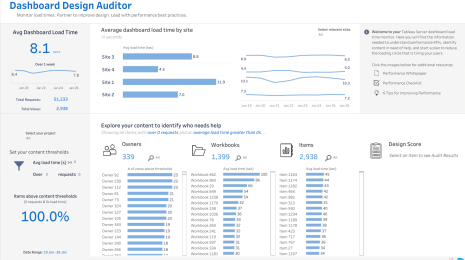
Cómo mejorar los tiempos de carga del dashboard con personas y procesos
 1 Febrero, 2023