
Lanzamiento de la versión de Tableau de agosto de 2025
Data Pro, Tableau Next y Slack, mejoras en las visualizaciones, alertas de umbrales y mucho más
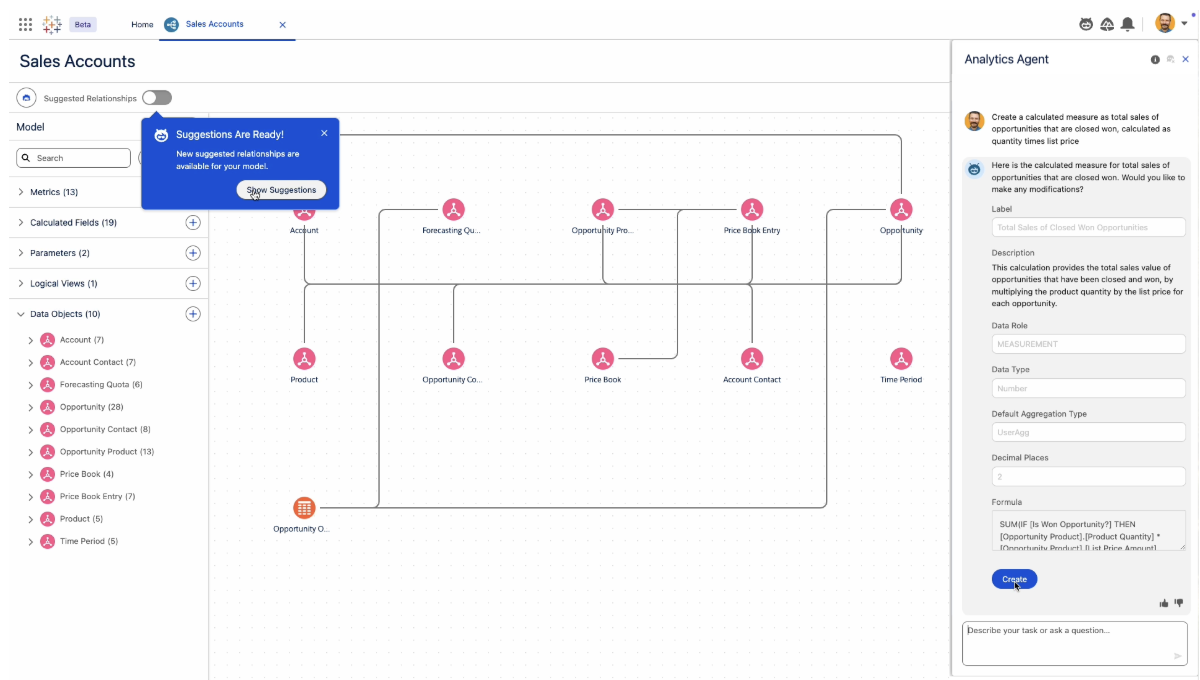
Tableau Next: Data Pro
Obtenga información más rápido y promueva el análisis de autoservicio Data Pro es una habilidad de análisis prediseñada de Tableau Next que permite el modelado de datos semánticos con Agentforce para reducir así el esfuerzo manual y los obstáculos que se interponen en el modelado de datos. Data Pro está disponible para todos en Tableau Next.
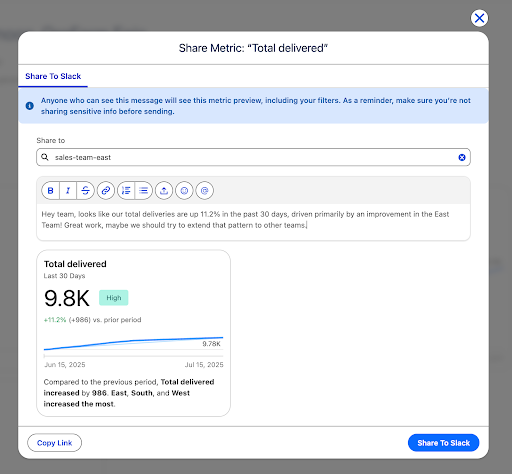
Integraciones de Tableau Next y Slack
Acelere la colaboración entre equipos y la toma de decisiones. Con un solo clic, comparta sin problemas información de Tableau Next directamente en Slack, sin necesidad de insertar o copiar código. De esta manera, podrá tomar al instante decisiones basadas en los datos y obtener información y valor más rápido. Disponible para todos en Tableau Next.
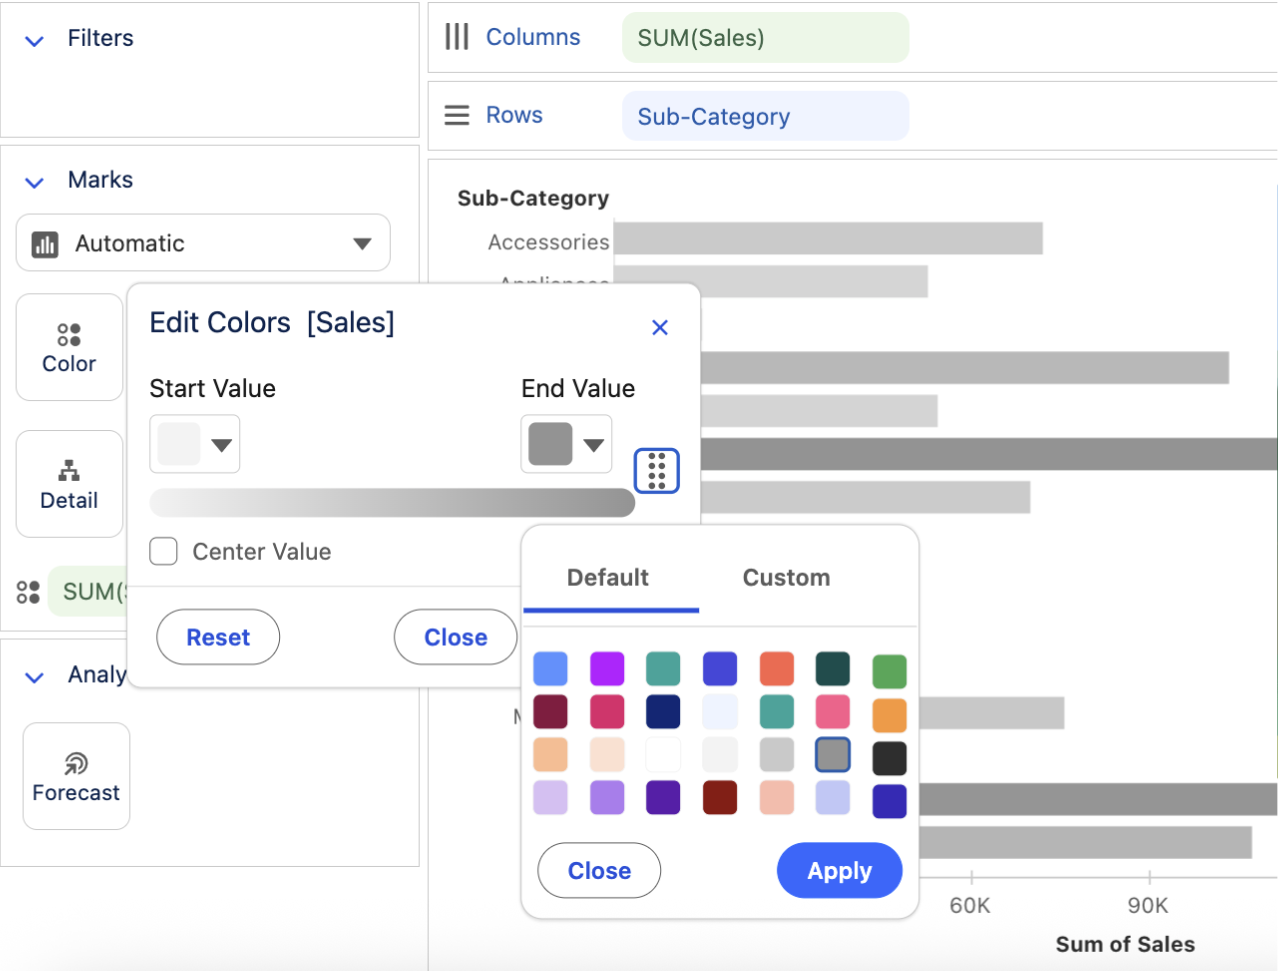
Mejoras en las visualizaciones de Tableau Next
Mejore sus visualizaciones en Tableau Next y analice rápidamente sus datos para detectar tendencias y valores atípicos por medio de colores personalizados. Una vez finalizada su visualización, use un botón para agregarla rápidamente a un dashboard y compartirla de manera más general. Disponible para todos en Tableau Next.
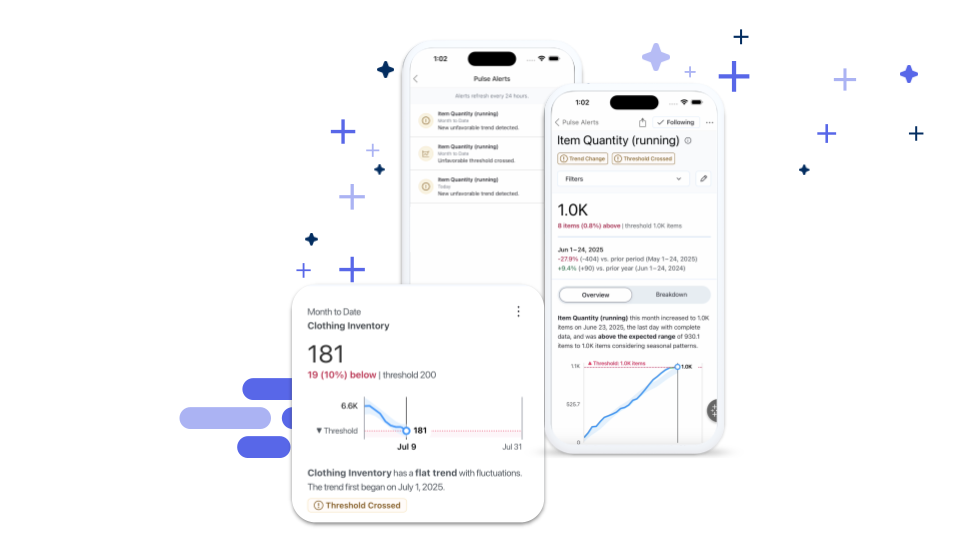
Tableau Pulse: Alertas de umbrales
Sepa en todo momento cuándo sus métricas entran en un intervalo de umbral desfavorable. Ahora, cuando una métrica entra en un intervalo crítico, Tableau Pulse refleja esta condición con alertas que se muestran en la web, el correo electrónico y los dispositivos móviles. Disponible para todos en Tableau Cloud.

Obtenga información interna sobre los lanzamientos de Tableau
Únase a nuestro grupo de usuarios de DataFam Discovery y obtenga información de los administradores de productos de Tableau sobre las nuevas funcionalidades que lanzaremos.
Unirse ahora
Todas las funcionalidades
Agosto
Tableau MCP: OAuth Support
Ensure enterprise-grade governance and security standards while using Tableau MCP. With the support of HTTP transport and OAuth you can centrally host and manage a remote Tableau MCP server that accepts requests from distinct users and respects row-level security policies on your Tableau Server.

Tableau MCP: Tableau Pulse tools support
A new way to integrate Tableau into custom and 3rd party agents and applications. Tableau MCP supports Tableau Pulse tools that make it possible to bring the intelligent and contextual capabilities of Tableau Pulse into 3rd party and custom AI Agents.
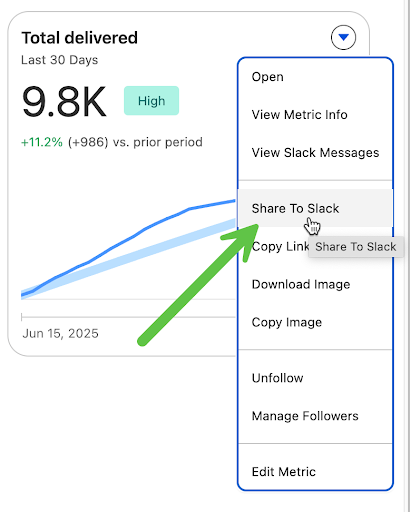
Tableau Next and Slack Integrations
Accelerate team collaboration and decision-making. Seamlessly share insights from Tableau Next directly into Slack, without embedding or copying code, empowering users to instantly act on data and analysts to gain faster feedback for quicker time to value.
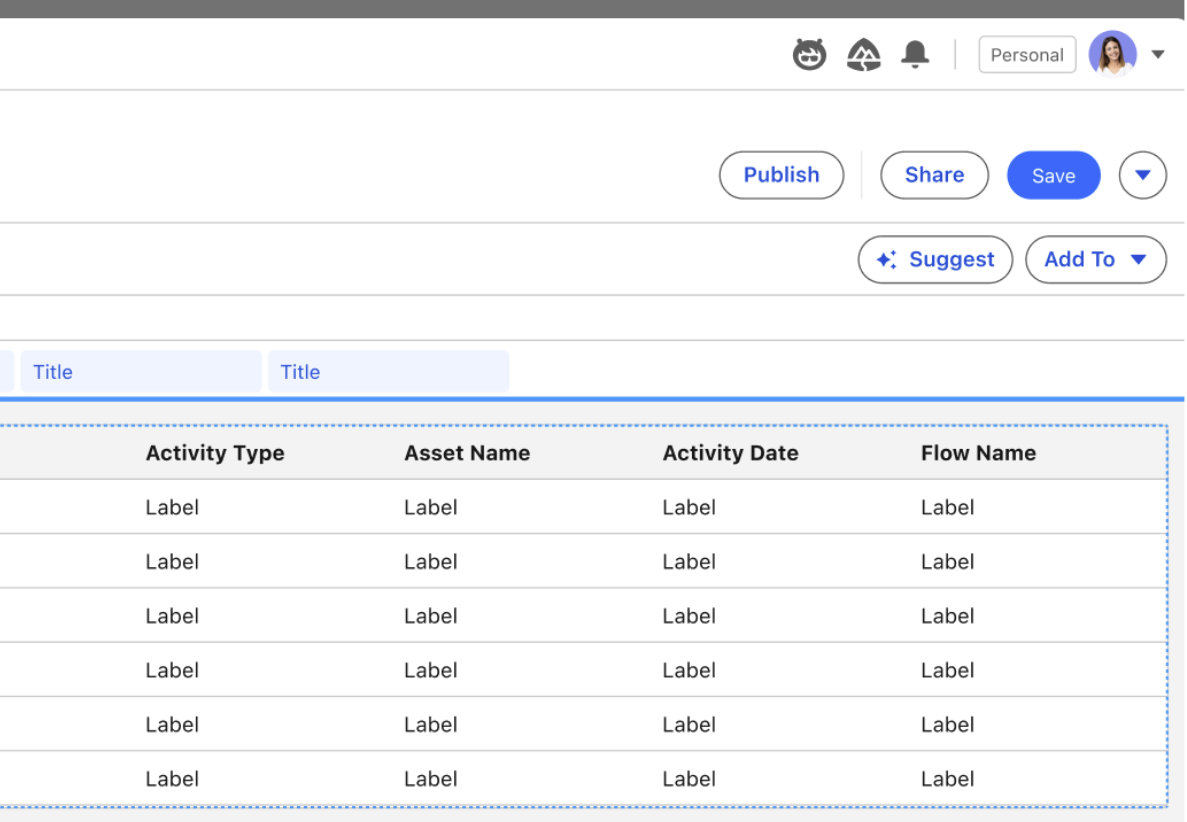
Tableau Next: "Add to" Dashboard from Viz Builder
Easily add a completed visualization to the dashboard of choice in just a couple of clicks, directly from the visualization builder. Speed up dashboard authoring with faster and more user-friendly experience.
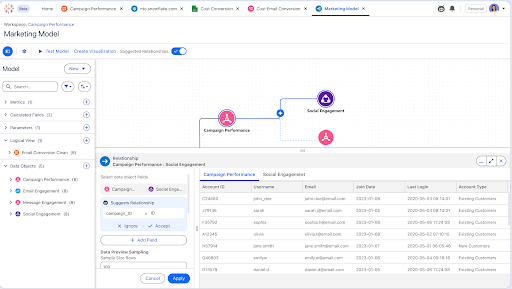
Tableau Next: Data Pro
Data Pro, una funcionalidad de Agentforce, acelera los flujos de trabajo de análisis, como la preparación y el modelado de datos. A corto plazo, Data Pro incluirá funcionalidades de selección de modelado semántico: sugerencias de relaciones y creación de campos calculados.
Data Pro estará disponible en versión beta.
Tableau Next: Define Continuous Colors
Easily distinguish trends, outliers, and patterns by applying custom colors to continuous values in visualizations. This allows for dynamic visualization of trends, like customer sentiment over time, enabling quicker analysis and strategic adjustments.
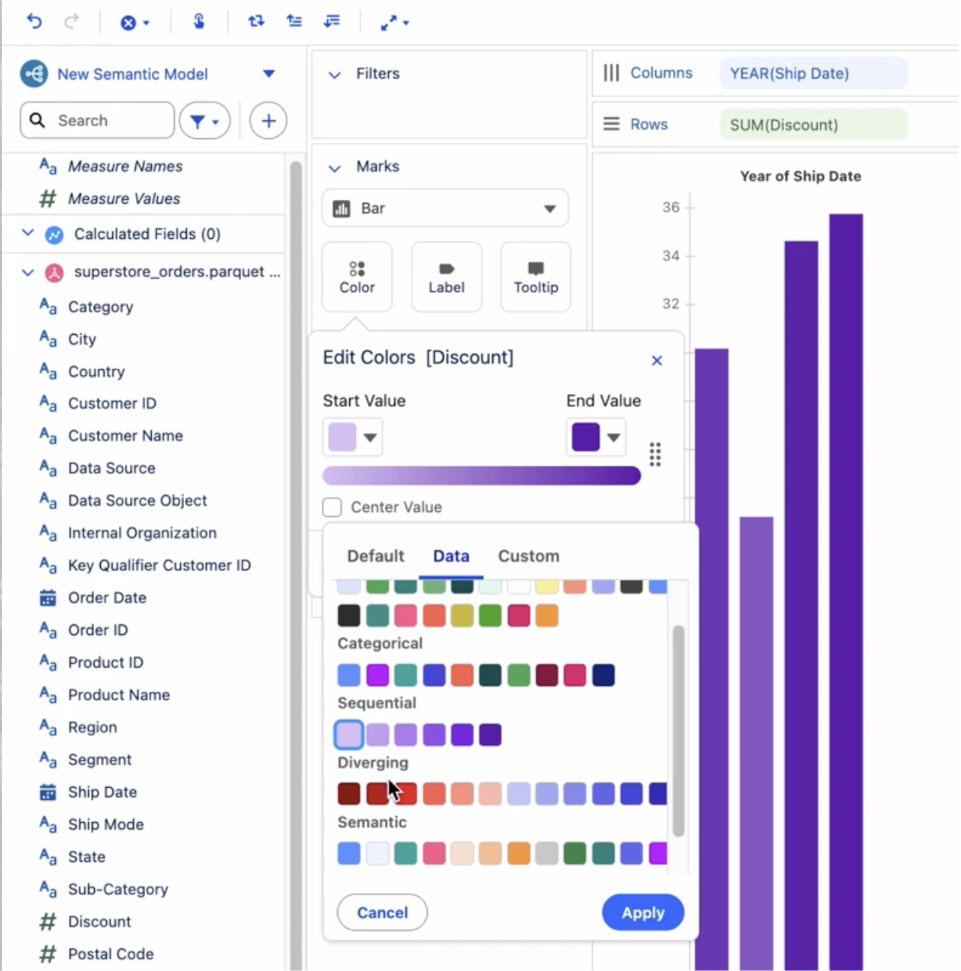
Tableau Next: Enhanced Color Picker
Improve chart readability and speed analysis by easily customizing chart colors. Assign discrete colors to dimensions and continuous gradients to measures to help distinguish data types, gain clearer insights, and follow visualization best practices.
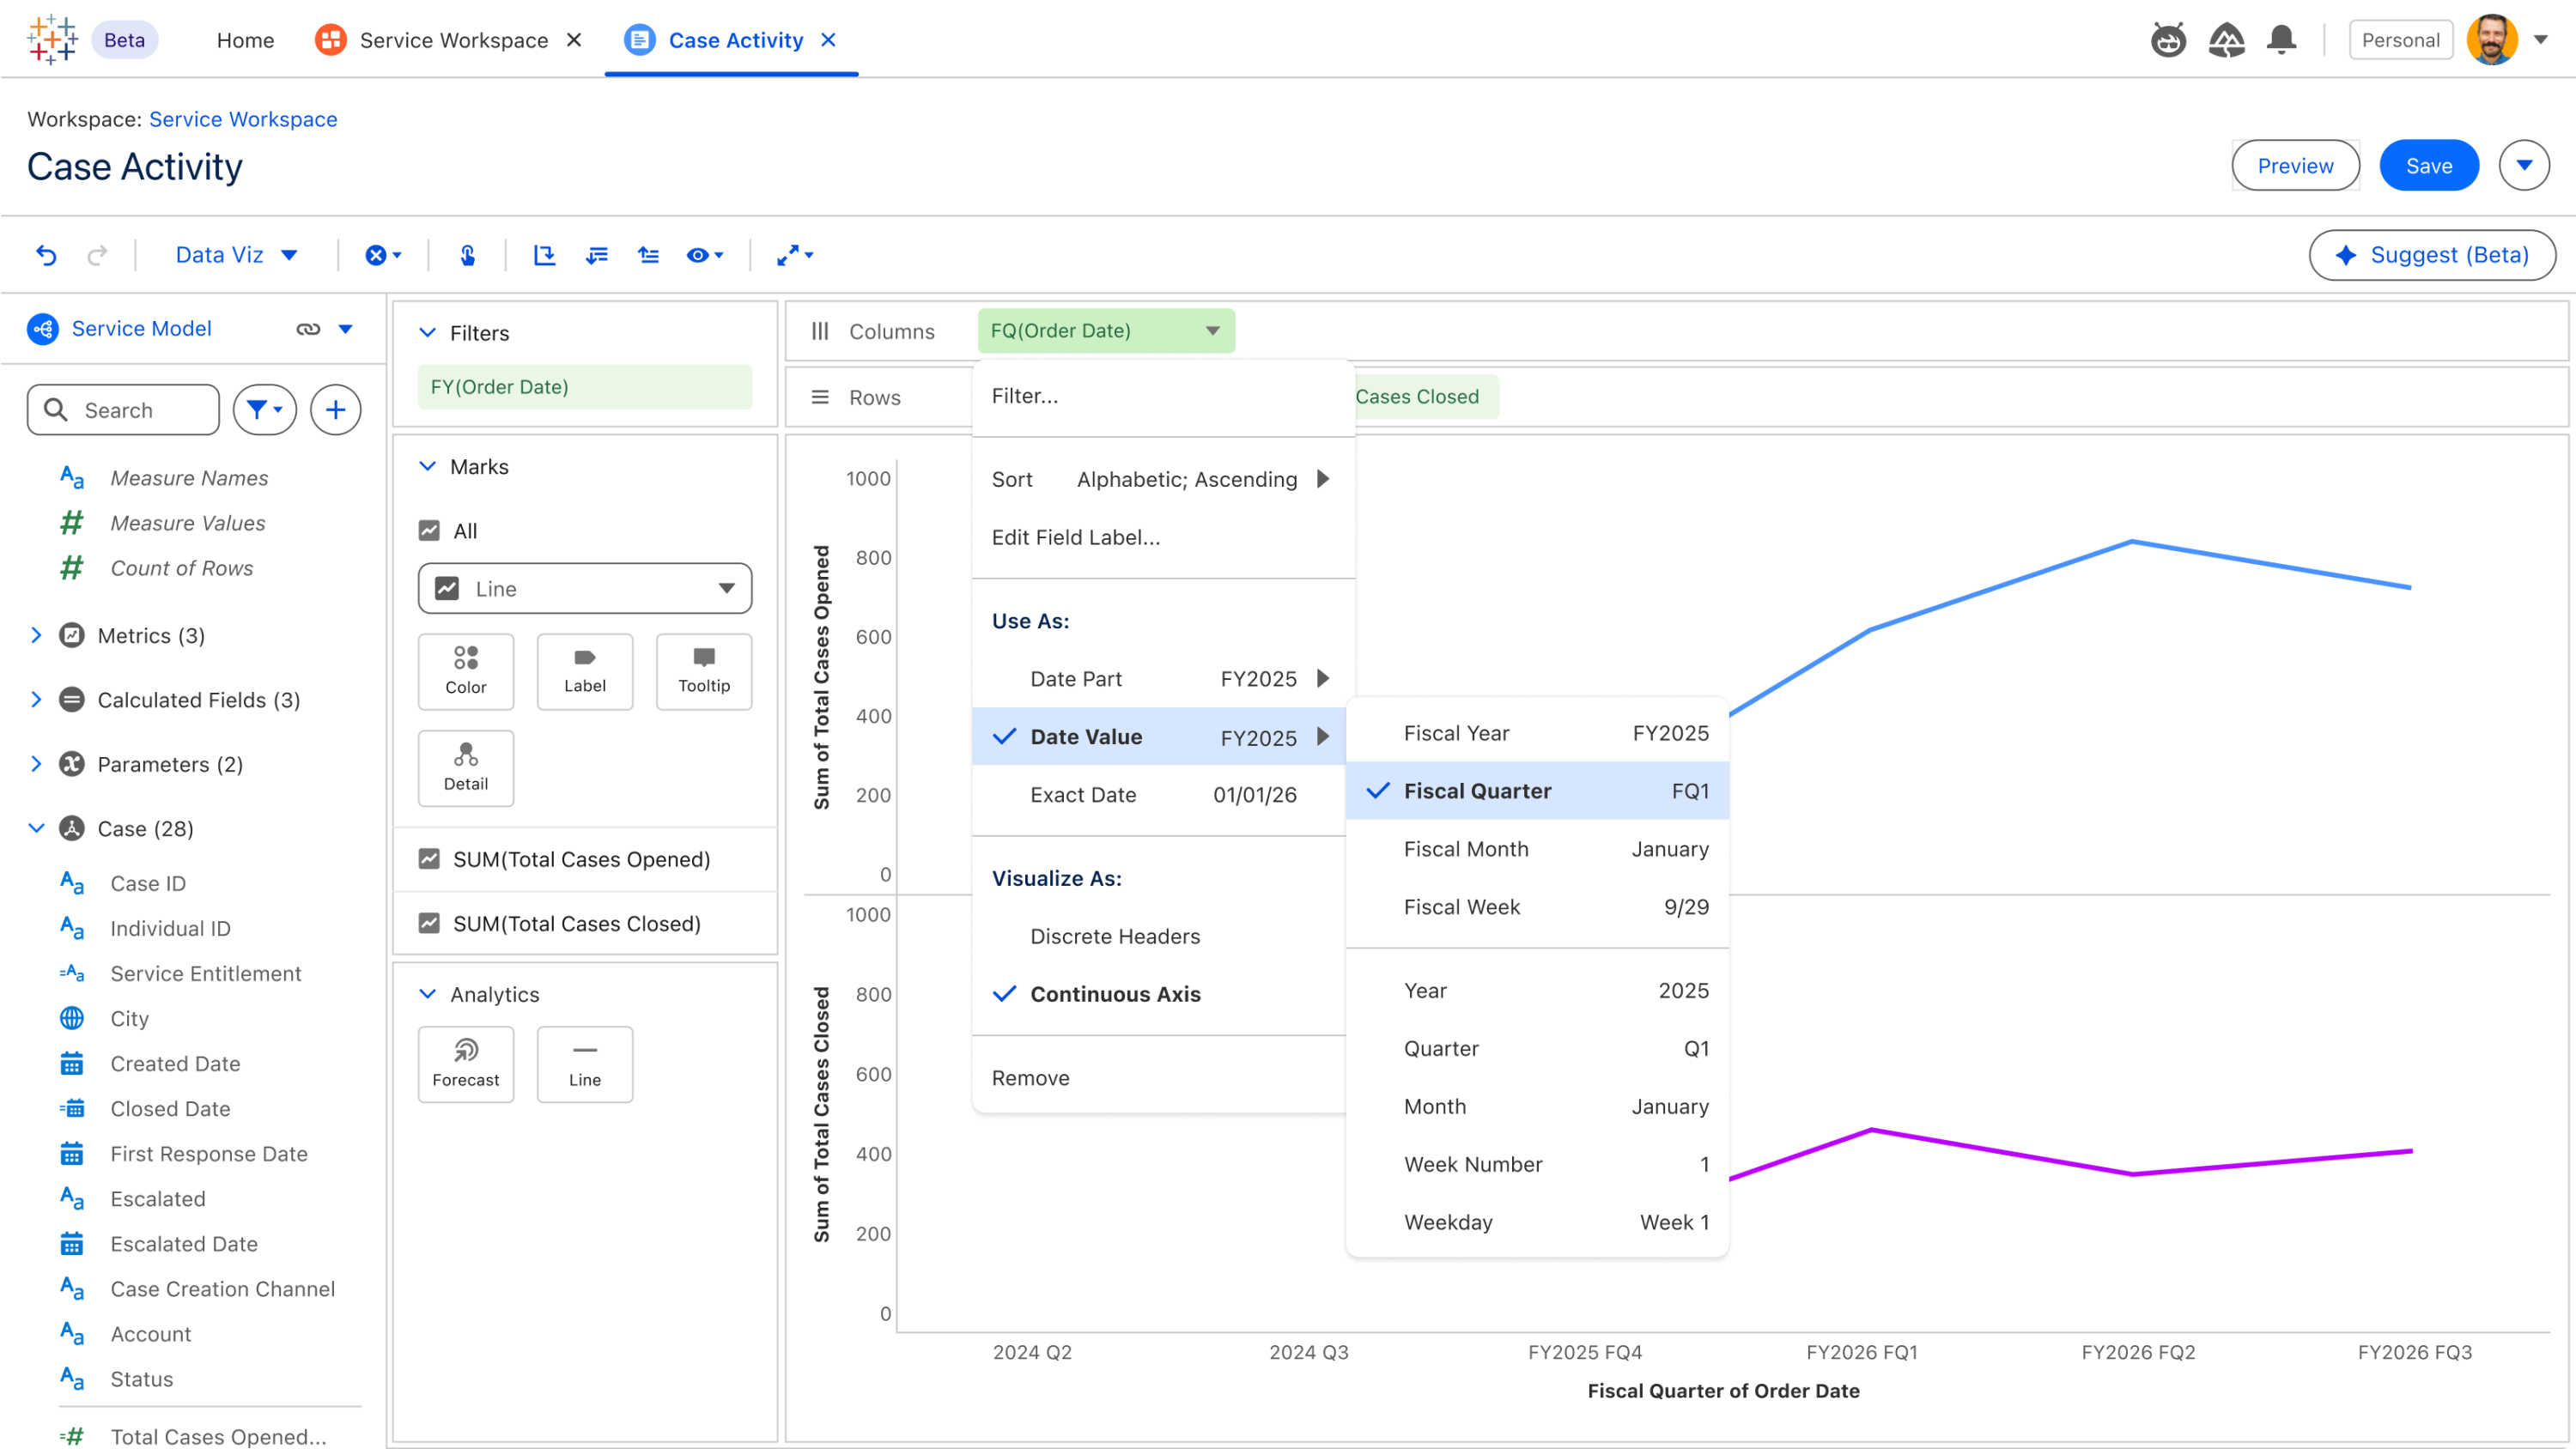
Tableau Next: Fiscal Calendar Support
Gain precise financial insights by leveraging Tableau Semantics' fiscal calendar support, enabling seamless aggregation, filtering, and calculations based on your specific fiscal periods. Group metrics like Sales, Leads, Defect Rates, and Scheduled Deliveries by fiscal timeframes, ensuring insights perfectly align with business reporting for accurate decision-making.
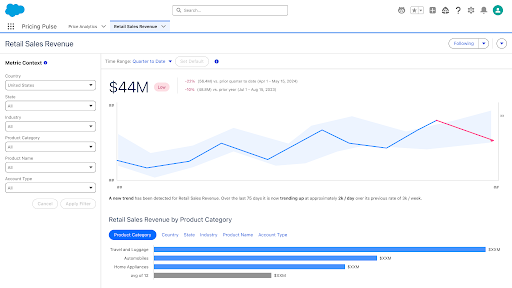
Tableau Next: Metrics Year Over Year Comparison
Instantly understand your business performance relative to prior years. With Year over Year comparisons available by default, effortlessly identify seasonal trends and broader performance shifts at a glance, enabling more meaningful insights into your metrics.
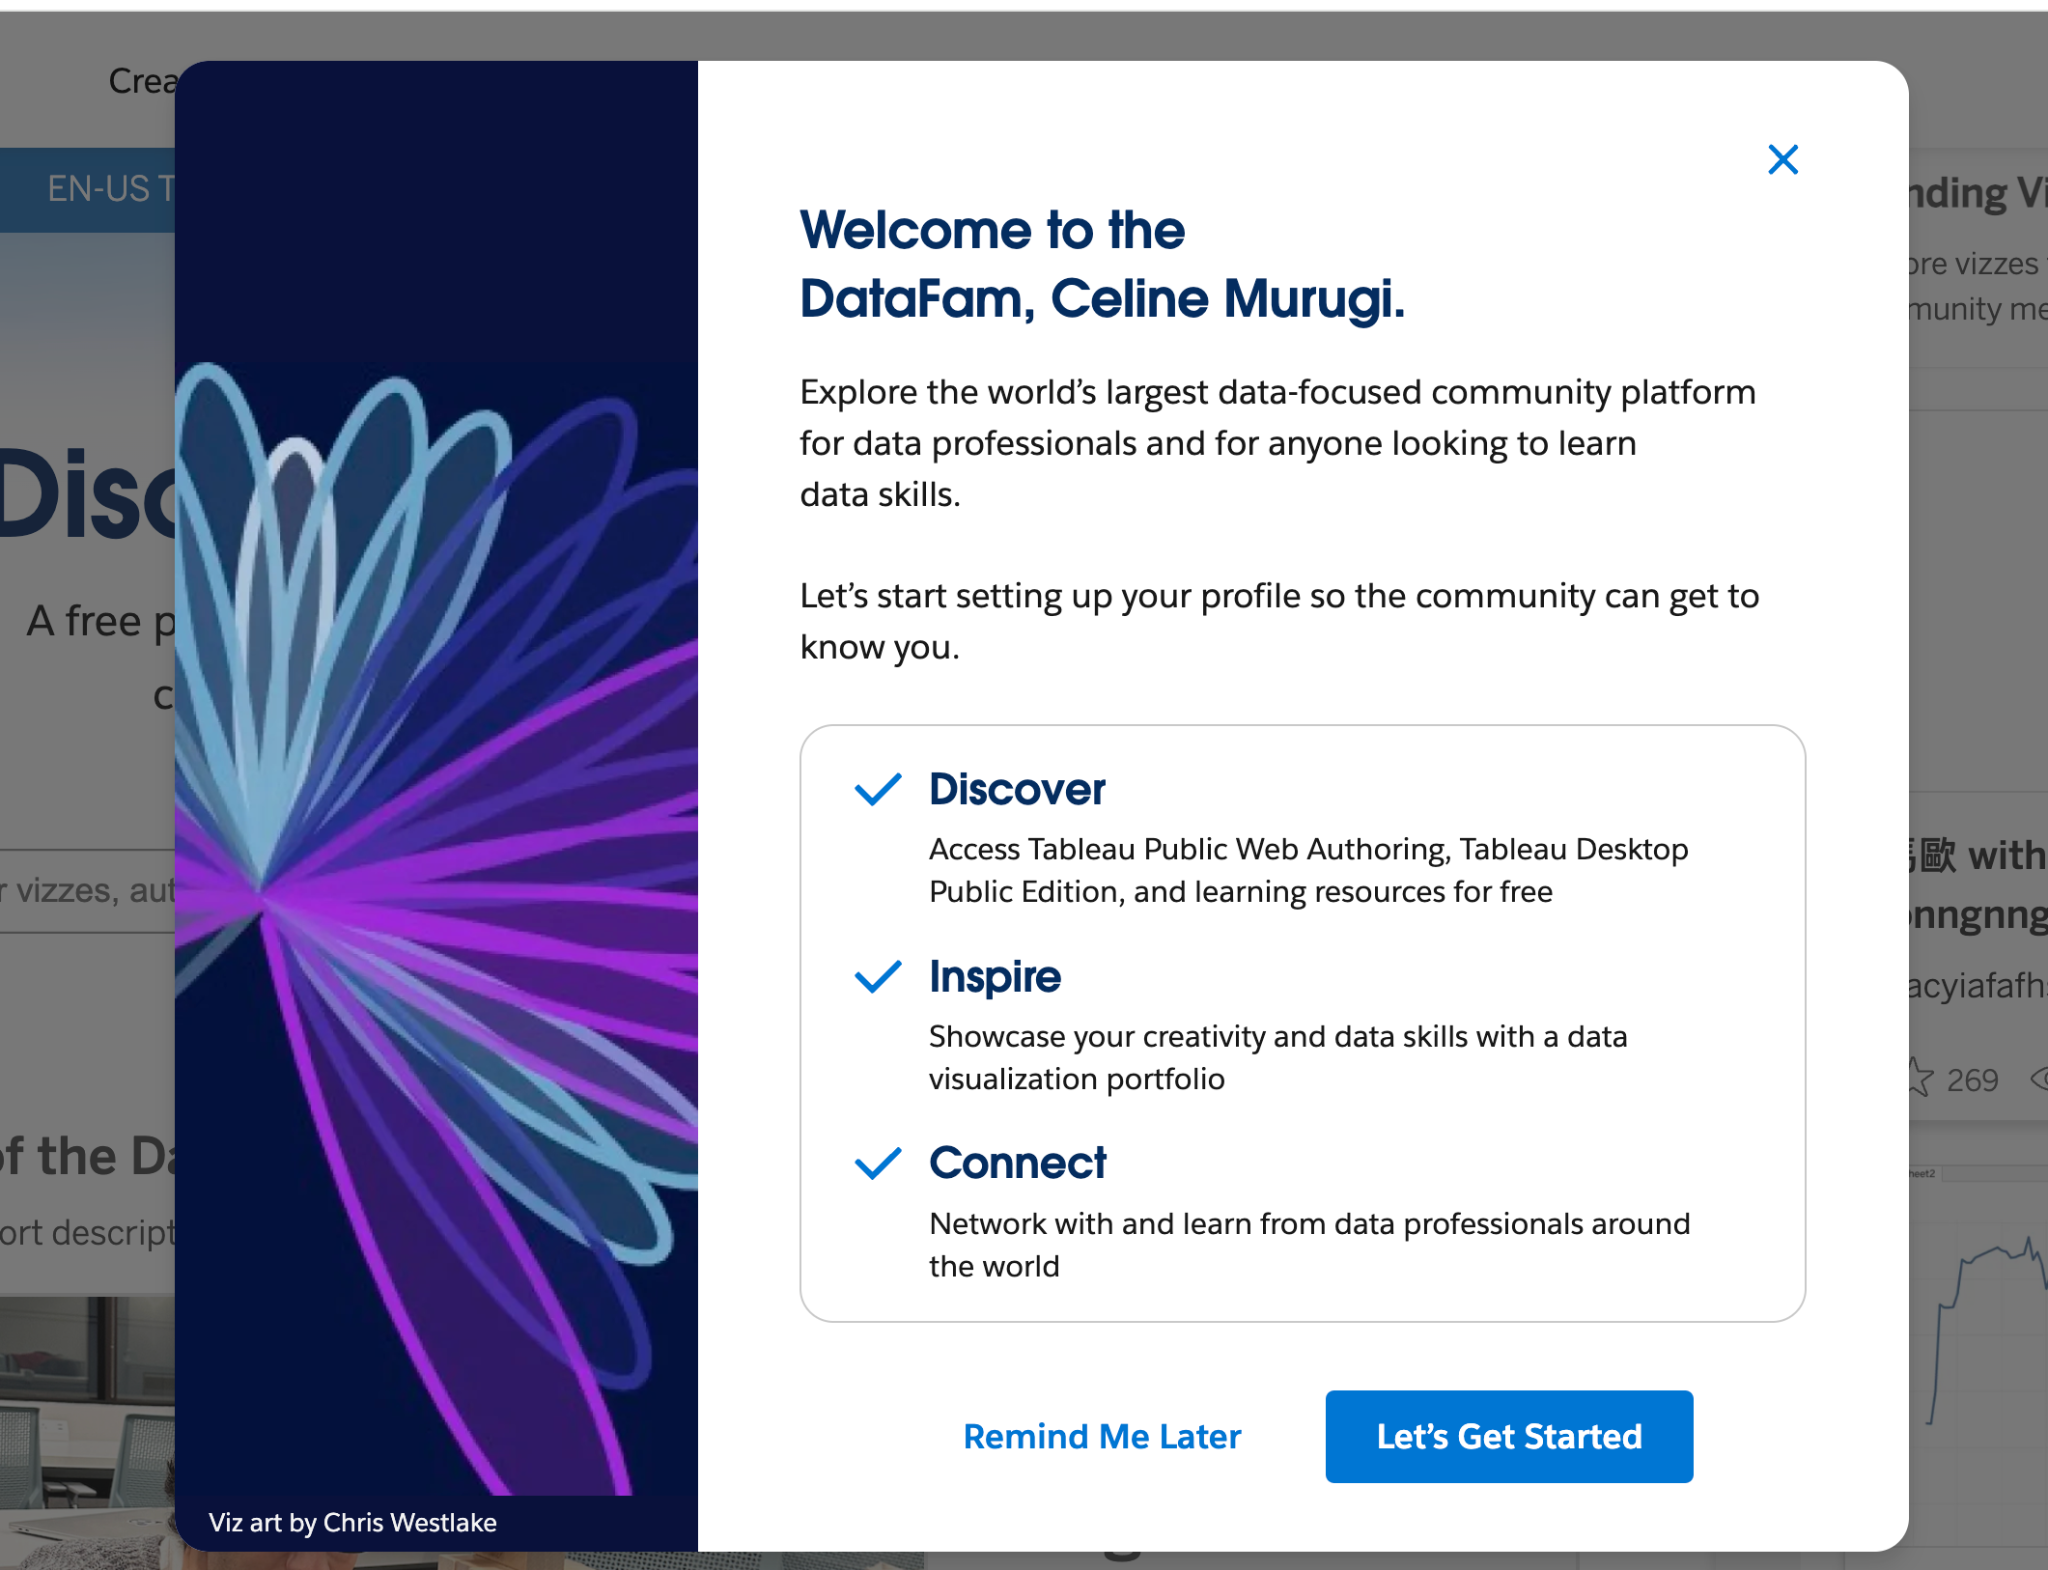
Tableau Public: New Welcome Modal
Discover Tableau Public with ease! At first login, seamlessly explore core functionalities like profile curation and the 'Hire Me' button. Users can dismiss it at will or choose 'Remind Me Later,' opting to postpone the modal to their next session. This intuitive onboarding experience aims to decrease the barrier to entry and help users feel supported.
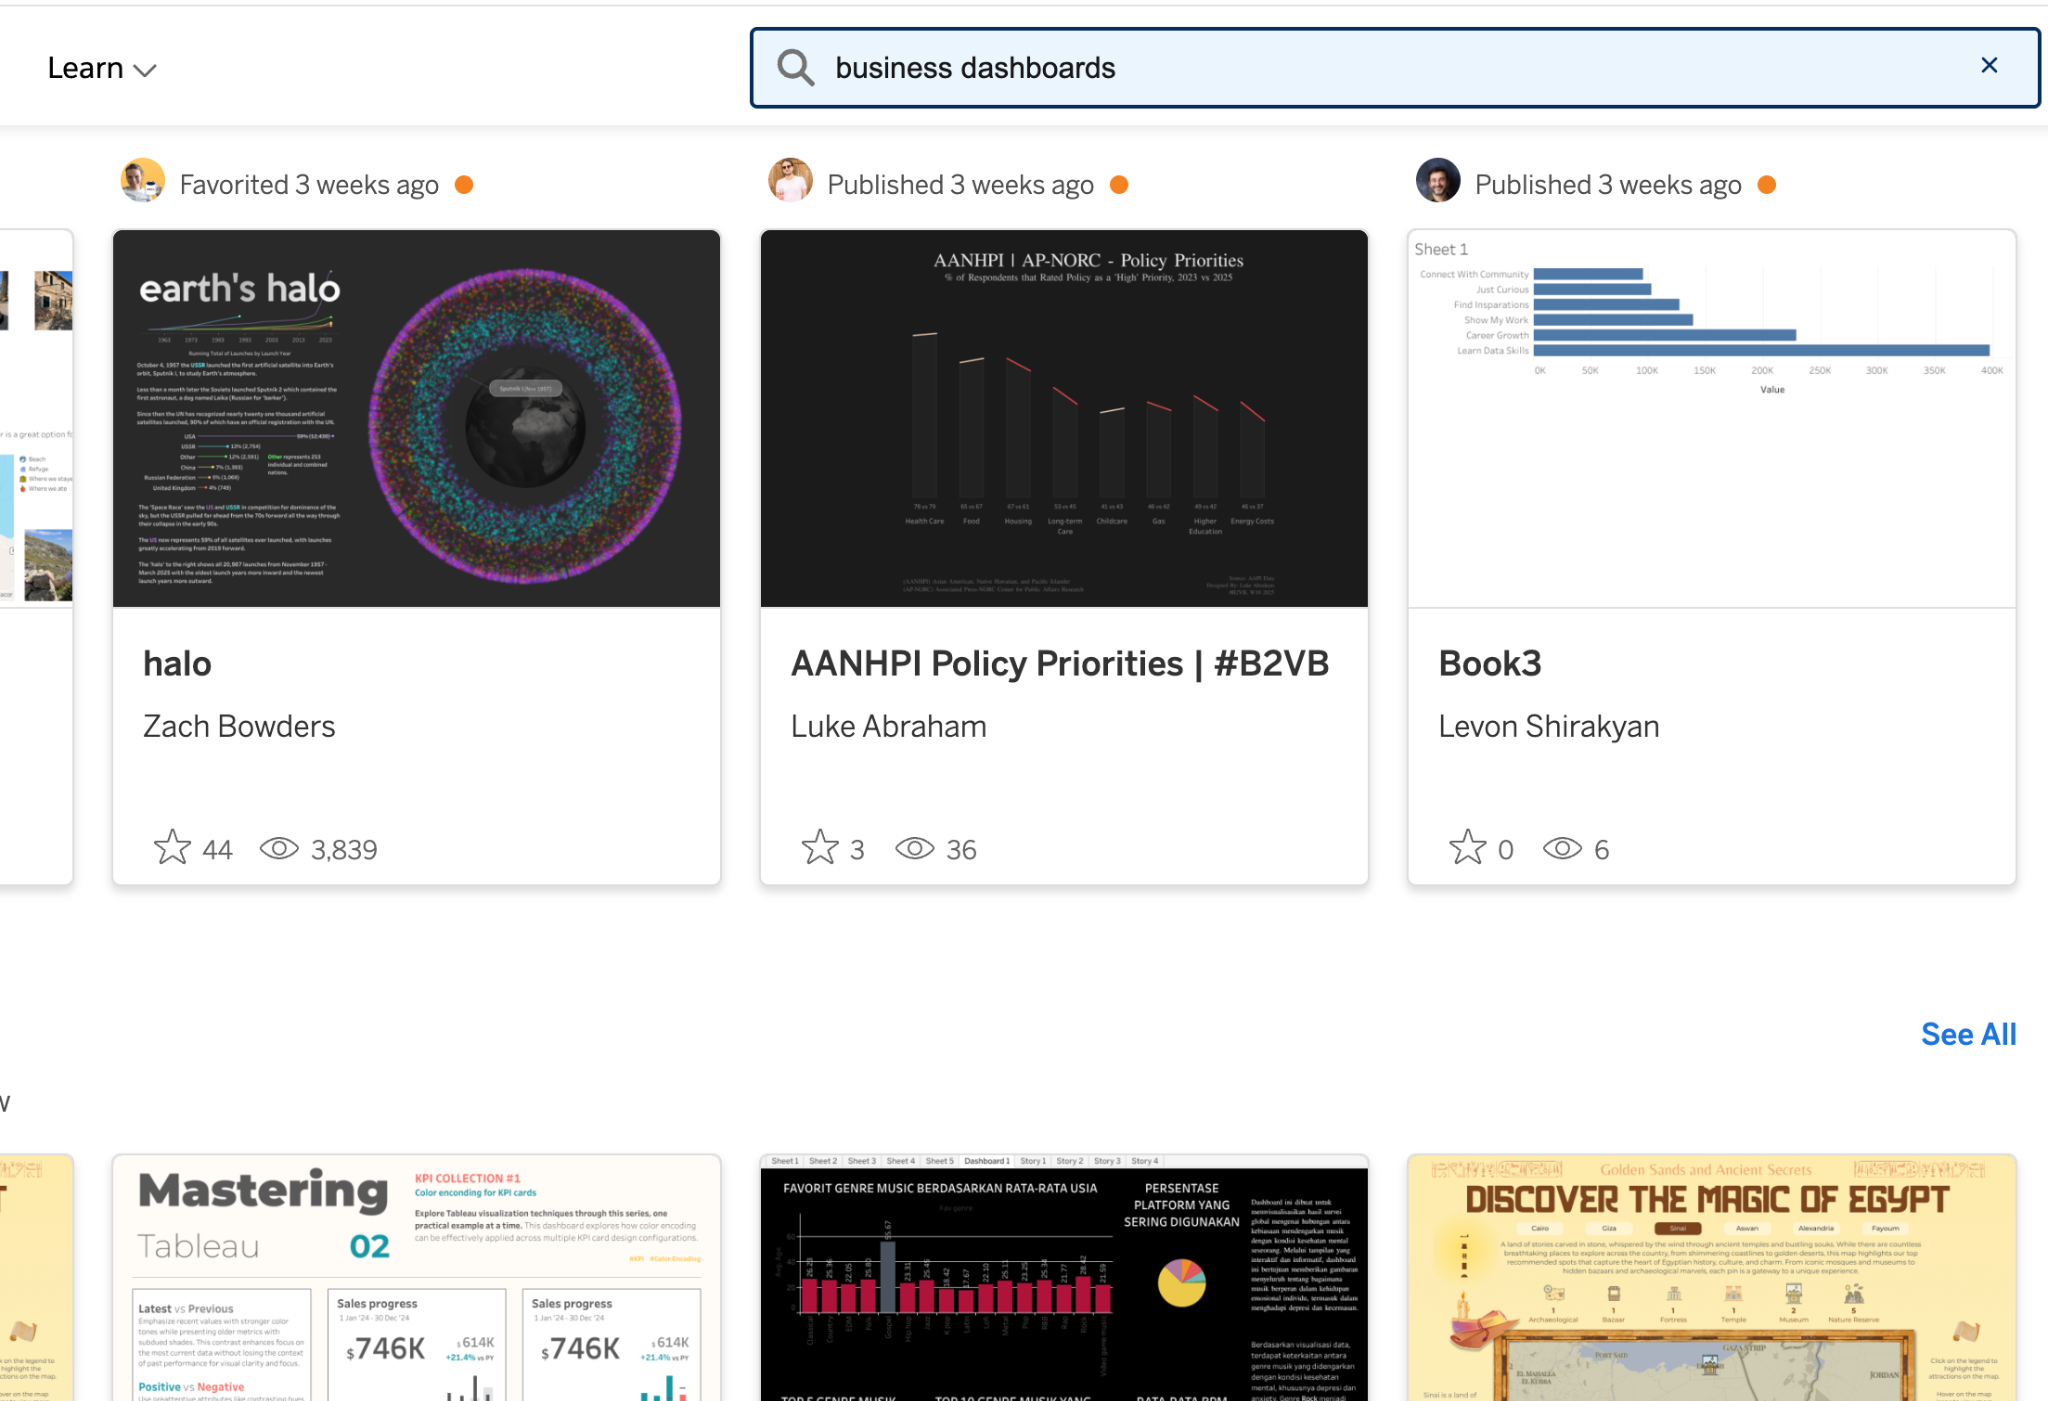
Tableau Public: Search Improvements
Tableau Public's search bar is now more easily accessible by being right at the top of the screen, no matter where you navigate. It's easy to spot, helping you find content quicker and easier so you can browse without distractions.
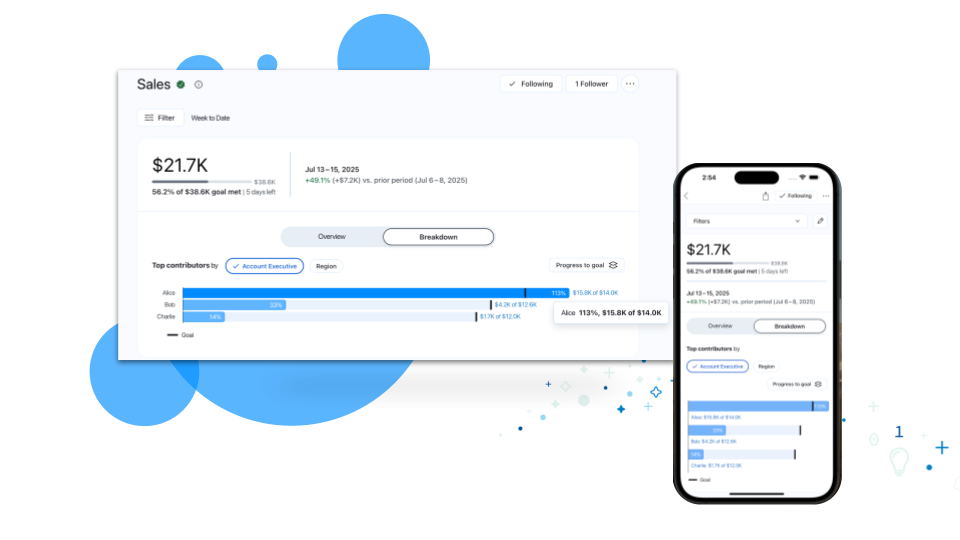
Tableau Pulse: Breakdown Chart Enhancements
Get deeper insights into your metrics. Enhancements to breakdown charts now reveal how specific dimensions are driving your metrics toward goals or thresholds, empowering you to make more informed business decisions.
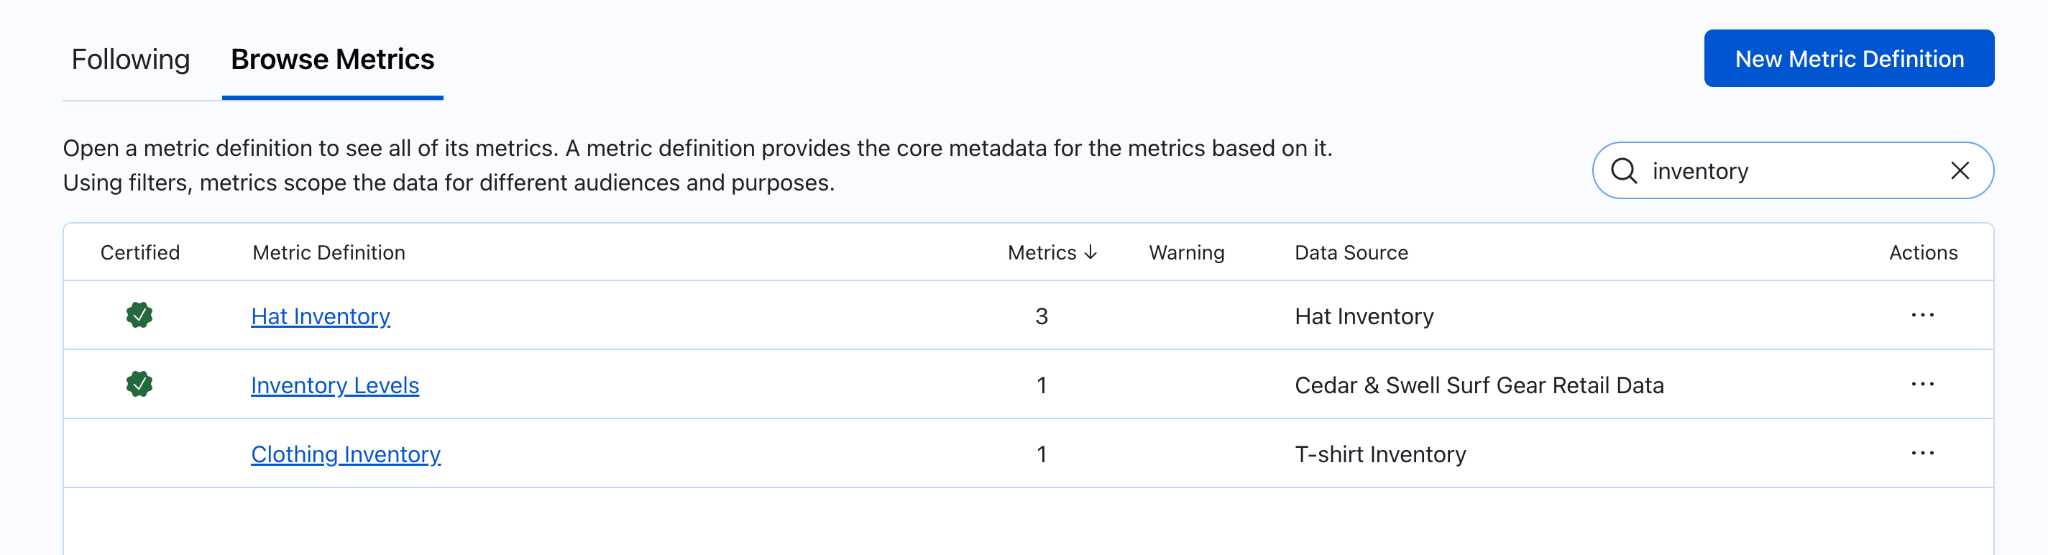
Tableau Pulse: Metric definitions browsing enhancements
Navigate your growing catalog of metric definitions with ease. Enhancements to the Browse Metrics list lets you search, sort by certified status, and even by the number of metrics, ensuring you quickly and easily find the definition you need.

Tableau Pulse: Off-Cycle Slack Alerts
Catch critical insights in Slack. Now, you'll get Slack notifications (up to one per day) for triggered metric alerts, even if you get your digest weekly or monthly.
Tableau Pulse: Threshold Alerts
Stay informed when your metrics cross into an unfavorable threshold range. Now, when a metric enters this critical range, Pulse will reflect this with alerts displayed in web, email, and mobile.

Tableau Pulse: Update User Preferences via API
Ensure every user's Pulse experience is relevant and personalized. Site Admins can now manage user digest preferences, cadences, and homepage layouts via API to guarantee a consistent, tailored experience for everyone.
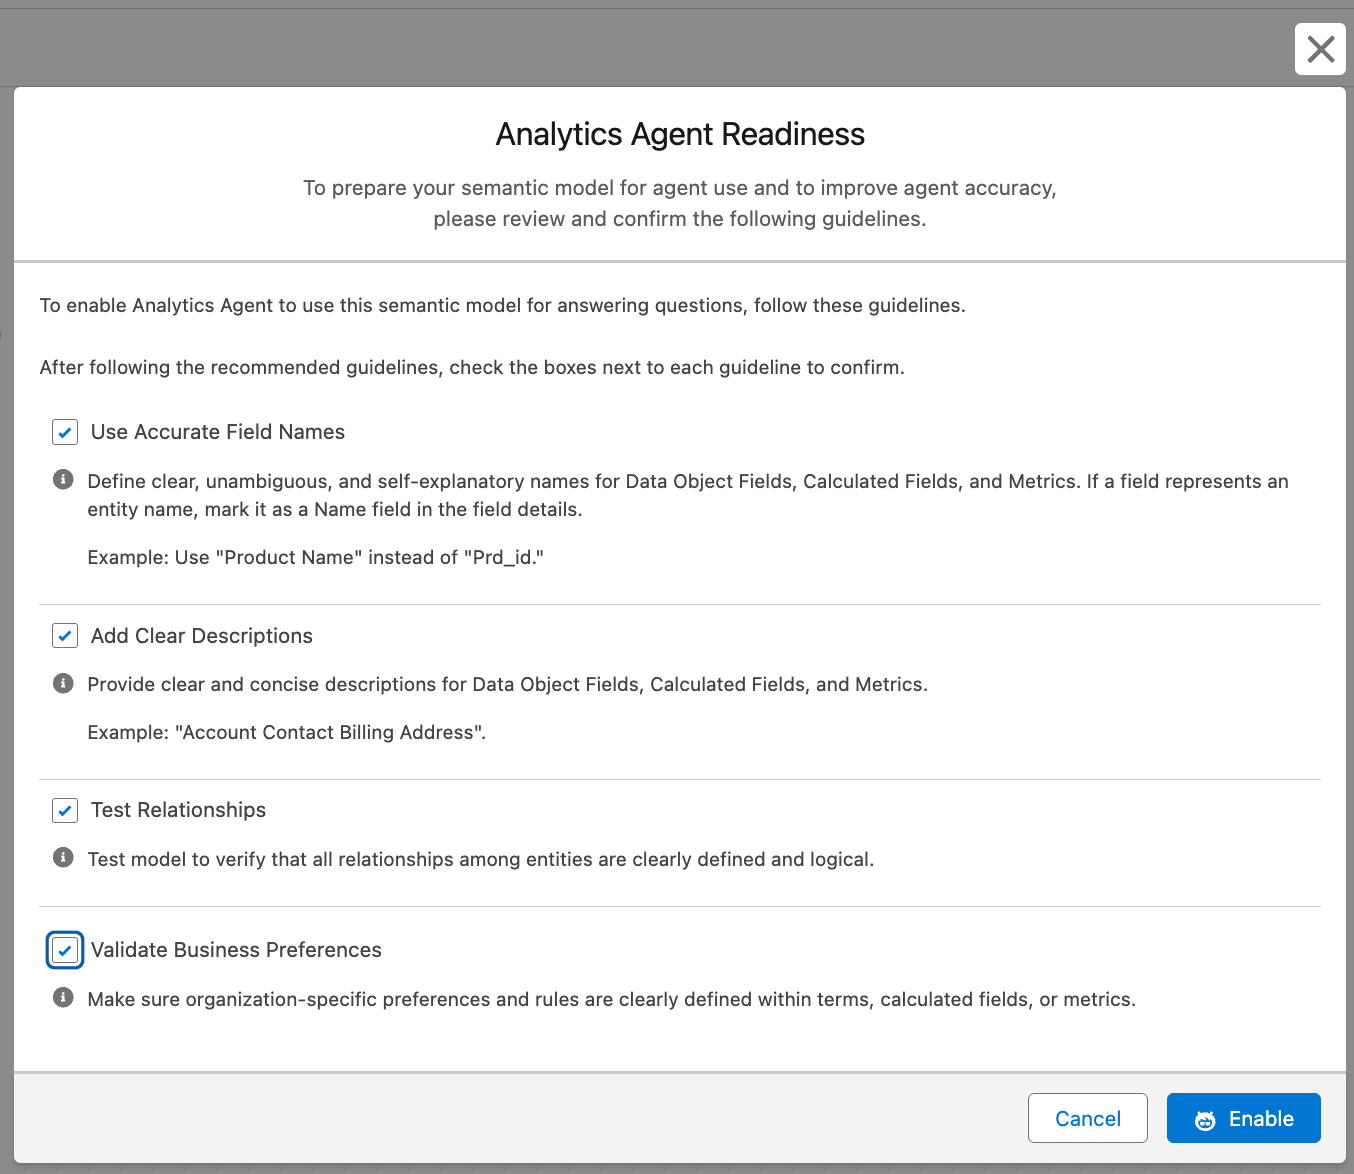
Tableau Semantics: Analytics Agent Readiness
Boost trust and reliability in agent responses by empowering semantic data model creators with a readiness flag, enabling them to control models used for Concierge, ensure alignment with best practices, and deliver accurate insights.
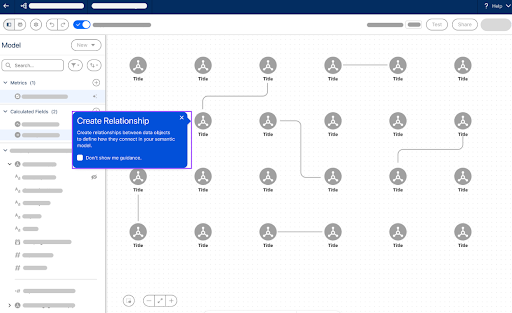
Tableau Semantics: Guided Onboarding
Accelerate your semantic data modeling and time to value with intuitive, step-by-step guidance on building and exploring semantic data models.

Tableau Semantics: Share SDM
Empower agility while maintaining data integrity with secure, easy-to-manage semantic model access. Semantic models are secure by default (owner-accessible only), allowing content owners to use a simple Share button to grant permission-aware access for collaboration viewing, ensuring only approved users see your data.