Time Series Analysis: Definition, Types, Techniques, and When It's Used
Try Tableau for FreeFor as long as we have been recording data, time has been a crucial factor. In time series analysis, time is a significant variable of the data. Times series analysis helps us study our world and learn how we progress within it.
In this article, we'll cover the following items for time series analysis:
What is time series analysis?
Time series analysis is a specific way of analyzing a sequence of data points collected over an interval of time. In time series analysis, analysts record data points at consistent intervals over a set period of time rather than just recording the data points intermittently or randomly. However, this type of analysis is not merely the act of collecting data over time.
What sets time series data apart from other data is that the analysis can show how variables change over time. In other words, time is a crucial variable because it shows how the data adjusts over the course of the data points as well as the final results. It provides an additional source of information and a set order of dependencies between the data.
Time series analysis typically requires a large number of data points to ensure consistency and reliability. An extensive data set ensures you have a representative sample size and that analysis can cut through noisy data. It also ensures that any trends or patterns discovered are not outliers and can account for seasonal variance. Additionally, time series data can be used for forecasting—predicting future data based on historical data.
Why organizations use time series data analysis
Time series analysis helps organizations understand the underlying causes of trends or systemic patterns over time. Using data visualizations, business users can see seasonal trends and dig deeper into why these trends occur. With modern analytics platforms, these visualizations can go far beyond line graphs.
When organizations analyze data over consistent intervals, they can also use time series forecasting to predict the likelihood of future events. Time series forecasting is part of predictive analytics. It can show likely changes in the data, like seasonality or cyclic behavior, which provides a better understanding of data variables and helps forecast better.
For example, Des Moines Public Schools analyzed five years of student achievement data to identify at-risk students and track progress over time. Today’s technology allows us to collect massive amounts of data every day and it’s easier than ever to gather enough consistent data for comprehensive analysis.
Read other examples of the application of time series analysis here.
Time series analysis examples
Time series analysis is used for non-stationary data—things that are constantly fluctuating over time or are affected by time. Industries like finance, retail, and economics frequently use time series analysis because currency and sales are always changing. Stock market analysis is an excellent example of time series analysis in action, especially with automated trading algorithms. Likewise, time series analysis is ideal for forecasting weather changes, helping meteorologists predict everything from tomorrow’s weather report to future years of climate change. Examples of time series analysis in action include:
- Weather data
- Rainfall measurements
- Temperature readings
- Heart rate monitoring (EKG)
- Brain monitoring (EEG)
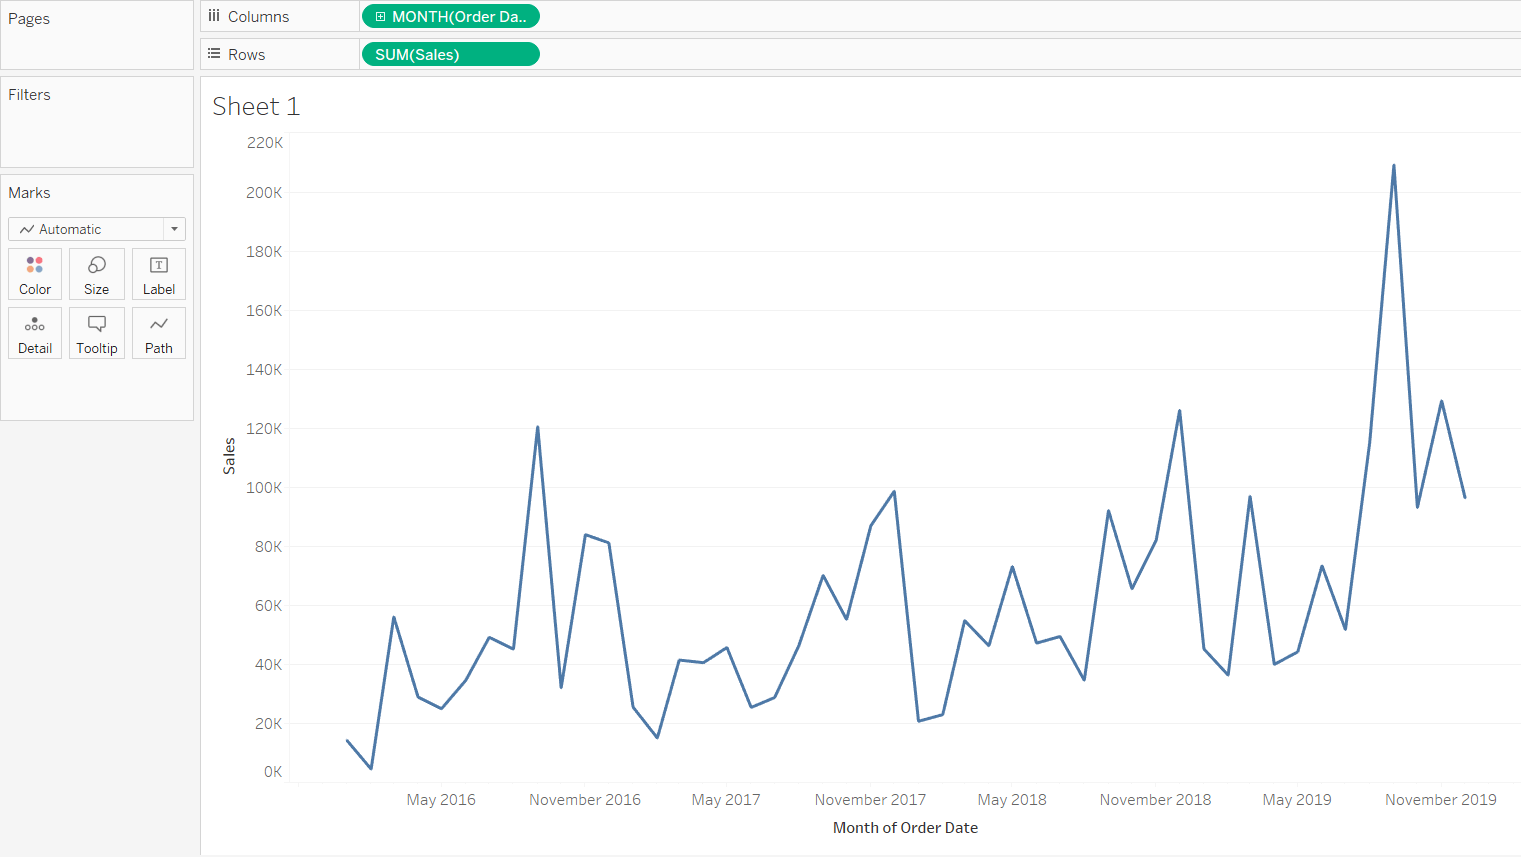
- Quarterly sales
- Stock prices
- Automated stock trading
- Industry forecasts
- Interest rates
Create beautiful visualizations with your data.

Time Series Analysis Types
Because time series analysis includes many categories or variations of data, analysts sometimes must make complex models. However, analysts can’t account for all variances, and they can’t generalize a specific model to every sample. Models that are too complex or that try to do too many things can lead to a lack of fit. Lack of fit or overfitting models lead to those models not distinguishing between random error and true relationships, leaving analysis skewed and forecasts incorrect.
Models of time series analysis include:
- Classification: Identifies and assigns categories to the data.
- Curve fitting: Plots the data along a curve to study the relationships of variables within the data.
- Descriptive analysis: Identifies patterns in time series data, like trends, cycles, or seasonal variation.
- Explanative analysis: Attempts to understand the data and the relationships within it, as well as cause and effect.
- Exploratory analysis: Highlights the main characteristics of the time series data, usually in a visual format.
- Forecasting: Predicts future data. This type is based on historical trends. It uses the historical data as a model for future data, predicting scenarios that could happen along future plot points.
- Intervention analysis: Studies how an event can change the data.
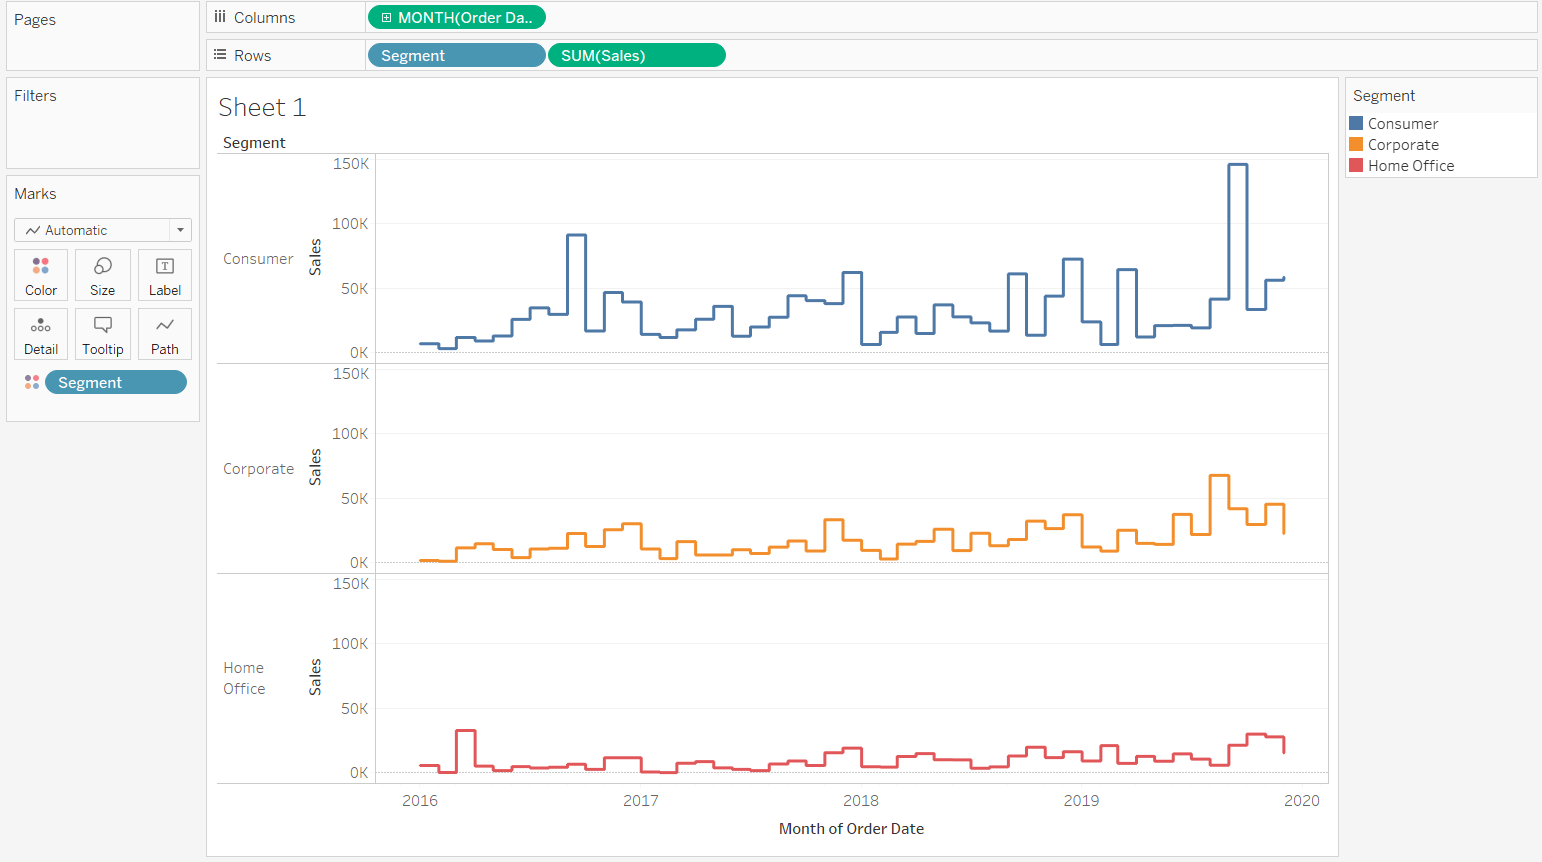
- Segmentation: Splits the data into segments to show the underlying properties of the source information.
Data classification
Further, time series data can be classified into two main categories:
- Stock time series data means measuring attributes at a certain point in time, like a static snapshot of the information as it was.
- Flow time series data means measuring the activity of the attributes over a certain period, which is generally part of the total whole and makes up a portion of the results.
Data variations
In time series data, variations can occur sporadically throughout the data:
- Functional analysis can pick out the patterns and relationships within the data to identify notable events.
- Trend analysis means determining consistent movement in a certain direction. There are two types of trends: deterministic, where we can find the underlying cause, and stochastic, which is random and unexplainable.
- Seasonal variation describes events that occur at specific and regular intervals during the course of a year. Serial dependence occurs when data points close together in time tend to be related.
Time series analysis and forecasting models must define the types of data relevant to answering the business question. Once analysts have chosen the relevant data they want to analyze, they choose what types of analysis and techniques are the best fit.
Important Considerations for Time Series Analysis
While time series data is data collected over time, there are different types of data that describe how and when that time data was recorded. For example:
- Time series data is data that is recorded over consistent intervals of time.
- Cross-sectional data consists of several variables recorded at the same time.
- Pooled data is a combination of both time series data and cross-sectional data.
Time Series Analysis Models and Techniques
Just as there are many types and models, there are also a variety of methods to study data. Here are the three most common.
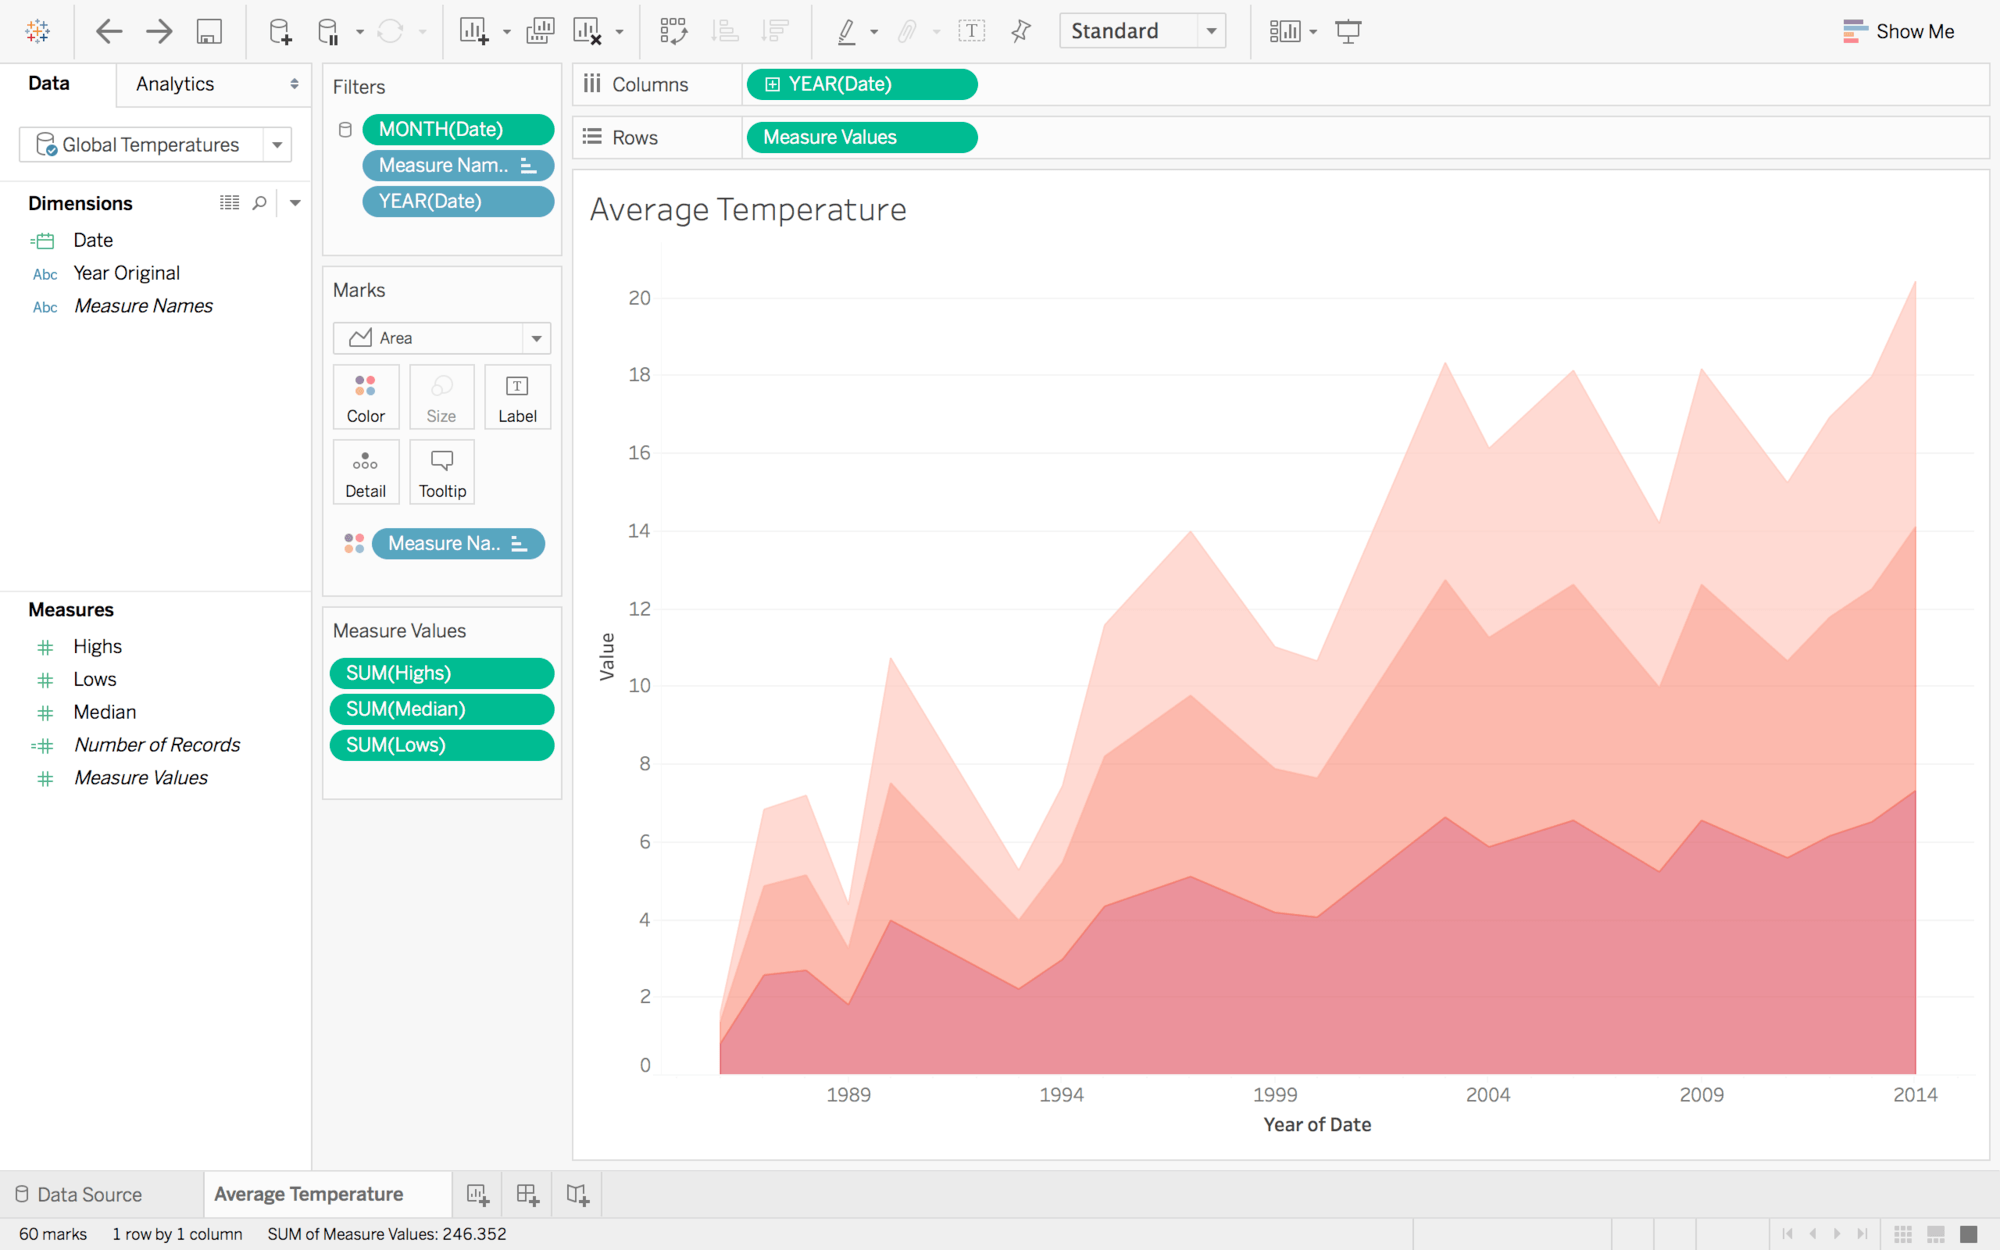
- Box-Jenkins ARIMA models: These univariate models are used to better understand a single time-dependent variable, such as temperature over time, and to predict future data points of variables. These models work on the assumption that the data is stationary. Analysts have to account for and remove as many differences and seasonalities in past data points as they can. Thankfully, the ARIMA model includes terms to account for moving averages, seasonal difference operators, and autoregressive terms within the model.
- Box-Jenkins Multivariate Models: Multivariate models are used to analyze more than one time-dependent variable, such as temperature and humidity, over time.
- Holt-Winters Method: The Holt-Winters method is an exponential smoothing technique. It is designed to predict outcomes, provided that the data points include seasonality.
Books about time series analysis
Time series analysis is not a new study, despite technology making it easier to access. Many of the recommended texts teaching the subject’s fundamental theories and practices have been around for several decades. And the method itself is even older than that. We have been using time series analysis for thousands of years, all the way back to the ancient studies of planetary movement and navigation.
Because of this, there are thousands of books about the study, and some are old and outdated. As such, we created a list of the top books about time series analysis. These are a mix of textbooks and reference guides, and good for beginners through to experts. You’ll find theory, examples, case studies, practices, and more in these books.
Times series analysis and R
The open-source programming language and environment R can complete common time series analysis functions, such as plotting, with just a few keystrokes. More complex functions involve finding seasonal values or irregularities. Time series analysis in Python is also popular for finding trends and forecasting.
Time series analysis is a technical and robust subject, and this guide just scratches the surface. To learn more about the theories and practical applications, check out our time series analysis resources and customer stories.