Parameter actions (now in beta) extend Tableau interactivity: Here’s how and when to use them


Interactivity is at the core of Tableau visual analytics. It means you can get to insights faster and design flexible experiences that your stakeholders can leverage to ask more questions.
In the past, interactivity in Tableau was focused on actions with specific effects. With a Filter Action, you can filter a sheet, while with a Highlight Action, you can highlight marks in the view. But what if you wanted to filter a calculation, or interactively encode a set of marks that match criteria describing your selection? Set actions (released in the 2018.3 Tableau release) gave you the power to visually design a multitude of effects.
Parameter actions, available in Tableau 2019.2 (now in beta), extend this model and empower all Tableau users to visually change a parameter’s value. This opens up even more powerful possibilities to build meaningful visualizations and add interactivity to your work.
What are parameter actions?
Parameters in Tableau are constant values. Constants are key components in many analytics scenarios. They can be used in calculations, act as references in table calculations, and define analytic indicators (like reference lines and bands). You can also use them to quantitatively filter within a single data source or across multiple data sources, optimize live connection queries, and more. Parameter actions add interactivity to all of these scenarios.
How to create a parameter action
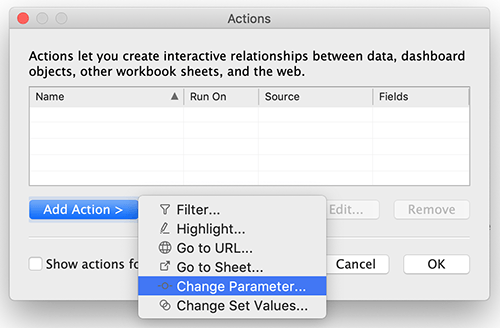
Just like any other action, launch the Actions dialog from the Worksheet or Dashboard toolbar and select the “Change Parameter” option.
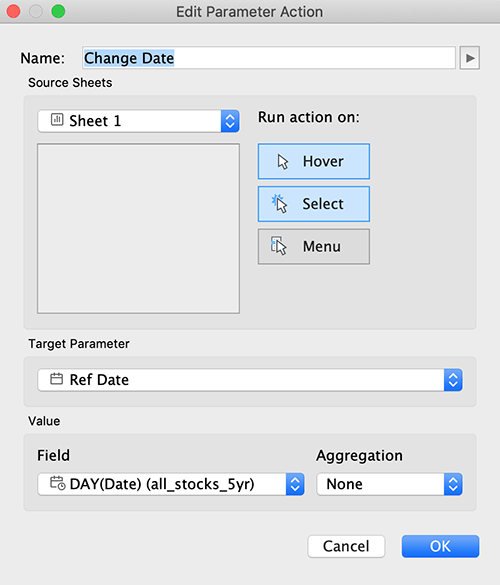
You can pick Source Sheets and a Trigger type, the Target Parameter you want to change, and the Field’s value you want to pass to the parameter. If more than one values are selected in the view, you can optionally choose an aggregation method that returns a single value for the parameter. That’s it.
When to use parameter actions
In this post, we will start by looking at date parameters and how you can leverage the new feature to build interactive index charts, and design powerful Year of Year (YoY) comparison visualizations. We will define numeric parameters and use them to interactively retrieve summary statistics for our selection. We will finally leverage string parameters and design interactive operational reports.
Interactive temporal analysis
% Change based on Reference Date
An index chart is a visualization type that helps you study a set of time series and understand how they have changed with respect to a reference date. This reference date may represent a stock or house purchase date. With parameter actions, you can interactively set the reference date and drive table calculations without leaving the view.
Year-over-Year comparison
In the previous example, we saw how financial stock tickers have changed with respect to a reference purchase date. What if we instead want to deduce the percentage change of all stocks during a specific time period and how these values compare with the percentage changes from the same period in the previous year, quarter, etc.? This isn’t possible with standard filters. Parameter actions provide a lightweight and intuitive means of deriving more insights from your data.
We use two parameter actions, each with a disparate aggregation. One action takes the selection’s minimum date value, while the other action captures the selection’s maximum date value.
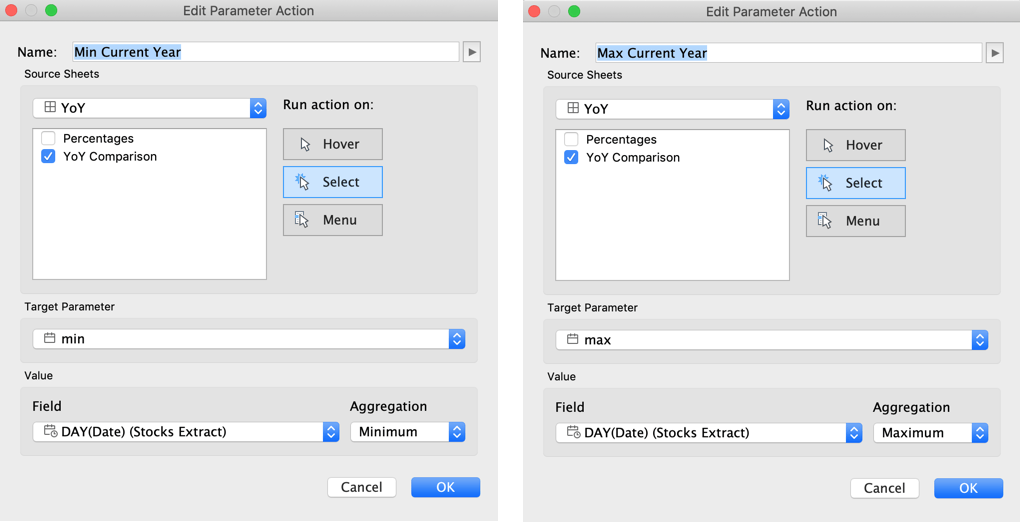
We can then write simple calculations that identify rows in the same period of the previous year and compare the percent changes between the current and the prior year’s window.
Interactive statistical analysis
Contextual summary information
Have you ever wanted to quickly review contextual summary information as you interact with clusters or individual marks in a view? I wrote a blog post earlier this year explaining how you could accomplish this with set actions. The process, however, is cumbersome and involves complex LOD calculations to get the right results. With parameter actions, you need zero calculations to accomplish the intended design. You can store your selection’s average, median and any other metric you care about in separate parameters and use them to drive reference lines in histograms presented in your tooltip.
Interactive spatial analysis
With parameter actions, you can introduce expressive interactivity in spatial visualizations. In the example that follows we use the selected county’s value as the reference parameter and calculate the % difference in smoking rates between the selected county and other counties in the US.
Interactive conditional navigation
Parameter values are not bound to row-level values and as a result, they can leverage the results of pivot operations (i.e. Measure Names) as source fields. This enables you and your viz consumers to navigate dashboards and conditionally unpack measures of interest. In the following example, we are enabling viz interactors to pick between sales and profit year-to-date metrics and see how different attributes (State, Sub-Category, etc.) describe them.
Interactive incremental analysis
In addition to pivot results, Parameter Actions can also leverage the results of calculations as source fields. For example, instead of using the action to replace the value currently assigned to a parameter, you can keep the previously selected values and append new ones to the parameter. This enables a new selection mode in Tableau that does not require holding keyboard keys down to accumulate values of interest. Jonathan Drummey has written an excellent blog post explaining this technique.
Interactive customizability
Analytics indicators
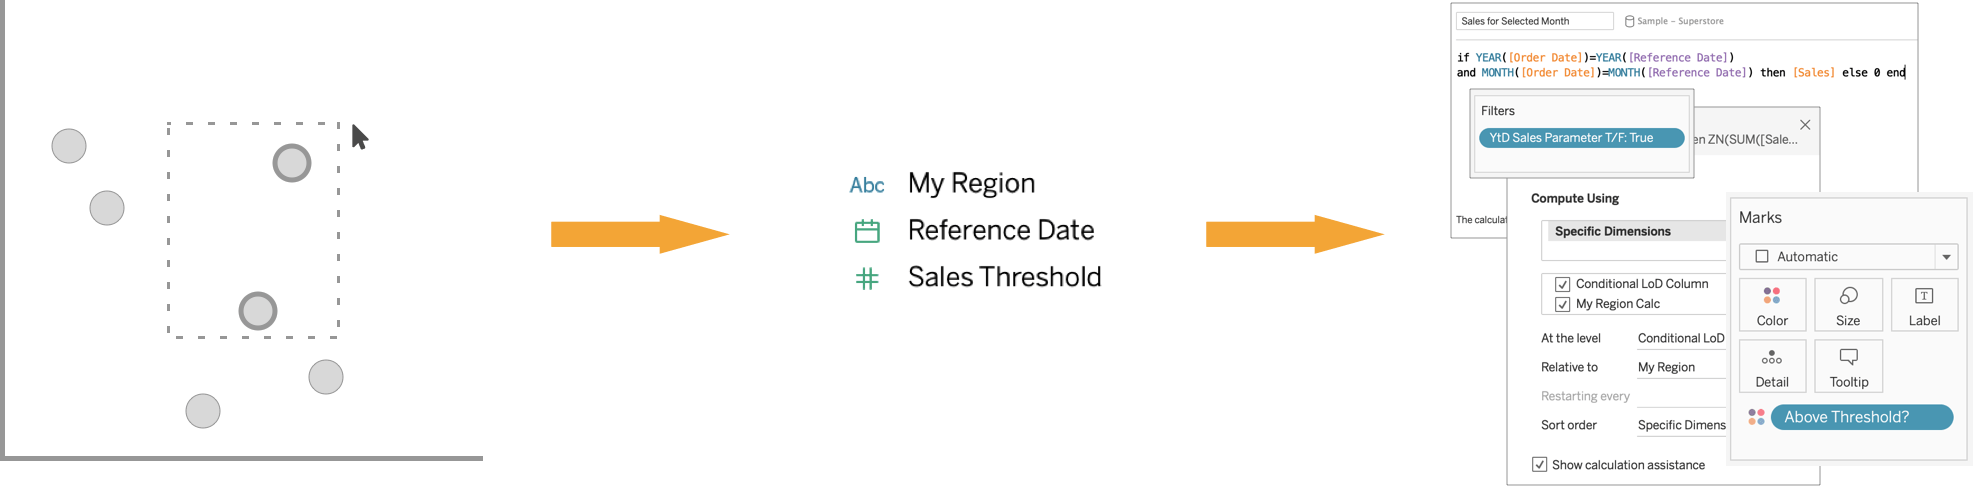
Have you ever wanted to synchronize encoding settings across multiple panes based on a benchmark value? Parameter actions can effortlessly pick up numeric values from the viz and use them in threshold calculations. In the example that follows, we are picking up, among other values, the adjusted close picker value and coloring all marks that are above that number. Two additional parameter actions take care of updating the date and dollar value of the stock in the visualization’s title.
Input controls
Because parameter actions allow you to use the viz as the primary source of interaction with your data, you can use parameter actions to design visualizations that act as customizable input controls for your analysis. In the example that follows we have created a date slider “control” that acts as a parameter action source.

We can also make the control itself update its encoding settings based on the parameter value. Toan Hoang’s example on Twitter is a great example of the feature’s flexibility.
Start creating with parameter actions
Parameter actions are a valuable tool for making analytically powerful, customizable, interactive dashboards with just a few clicks.
To start using parameter actions, get the newest version of Tableau today, and if you’d like to be involved in future beta programs to test new features, please sign up to participate!
Zugehörige Storys

Extend Access to Embedded Tableau Content with On-Demand Access
 22 Juli, 2026

The Tableau+ Bundle with Premium AI, Enterprise Capabilities, and Premier Success
 24 Juni, 2026

What is Tableau Prep?
 30 April, 2026