Meet the Iron Viz 2023 Finalists


We are one week away from Tableau Conference and the ultimate visualization showdown—Iron Viz 2023. Hundreds of data whizzes from around the world competed to take the stage, and the stakes are high for the three finalists as they prepare to race the clock and go dashboard-to-dashboard to be crowned best in viz.
This year's finalists, Brittany Rosenau, Nirosh Perera, and Paul Ross, rose to the top from hundreds of incredible game-themed submissions in the global qualifier round. Now they prepare to battle it out in front of a massive audience of people from across the globe. Who will claim victory, bragging rights, and thousands of dollars in prize money for themselves and a charity of their choice? We can’t wait to see it play out. Let’s get to know our contenders.
Meet the 2023 Iron Viz Finalists
Can you share more about your Tableau Public journey? How did you first hear about Tableau, when did you start using Tableau Public, and what made you keep using it?
Brittany Rosenau: I was introduced to Tableau and Tableau Public through an internal enablement program in 2019. I couldn't believe how easy it was to build the reports needed to see and understand my data compared to the standard in-app reporting. Seeing what was possible with customization on Tableau Public really hooked my curiosity, and I've been a fan ever since.
Nirosh Perera: I was first introduced to Tableau by chance at work. My boss at the time had a Tableau Desktop license, and I was lucky enough to have it assigned to me. I started using Tableau Public soon after, trying a few Makeover Mondays. I have to admit I've not been good at using it regularly, but I really enjoy admiring the Viz of the Day each morning—the talent of the DataFam is insane!
Paul Ross: I became aware of Tableau Public when I looked around for options to build an online viz portfolio in 2022, so not long ago. But what got me really interested in Tableau was discovering #GamesNightViz. I had wanted to build something to explore games on BoardGameGeek.com by selecting player counts and complexity levels. Finding the #GamesNightViz Community Project motivated me to publish my first viz in June 2022, knowing that at least a few people might find it interesting.
What prompted you to join the competition this year?
Brittany Rosenau: I love the Iron Viz competition—especially the slogan “win or learn, you can't lose.” There's a great energy that comes from the community during this time, whether it's from those building vizzes, giving feedback, or cheering on participants. This was my third entry, and I was excited to try things I hadn't before.
Nirosh Perera: I was pretty tentative about joining the competition this year, but my colleagues were adamant that I give it a go and have supported me all the way. As a lover of games in general, whether it be board games, sports, or quizzes, the theme of the qualifying entry was right up my alley.
Paul Ross: The very happy accident that the theme for the Iron Viz Global Qualifier was games. I've long been fascinated by the question, "What game should I try next?" And while my first viz helps answer questions like "What's a good 5-player game of medium difficulty?" I wanted to see if I could generate a universal list of awesome games you should try next, no matter who you are.
Tell us more about your 2023 qualifier entry. Did you know right away what topic you were going to analyze? Did you already have a data set in mind or have to look around? What made you choose this topic?
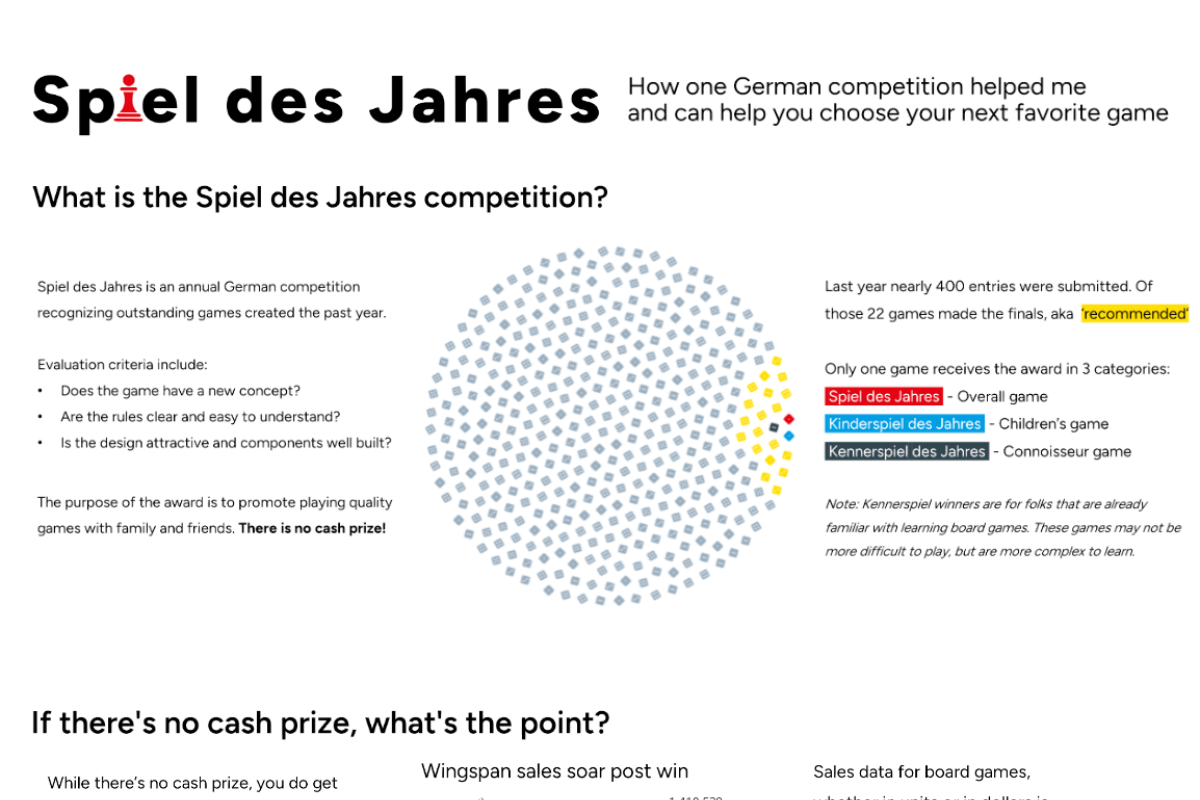
Brittany Rosenau: Initially, I thought I'd pick one game but then broadened it to the Spiel des Jahres board game competition. There wasn't a ready-made data set out there, so there was a lot of cobbling things together from different sources. I chose the topic because I personally bought a few games that won the award and enjoyed playing them with my family.
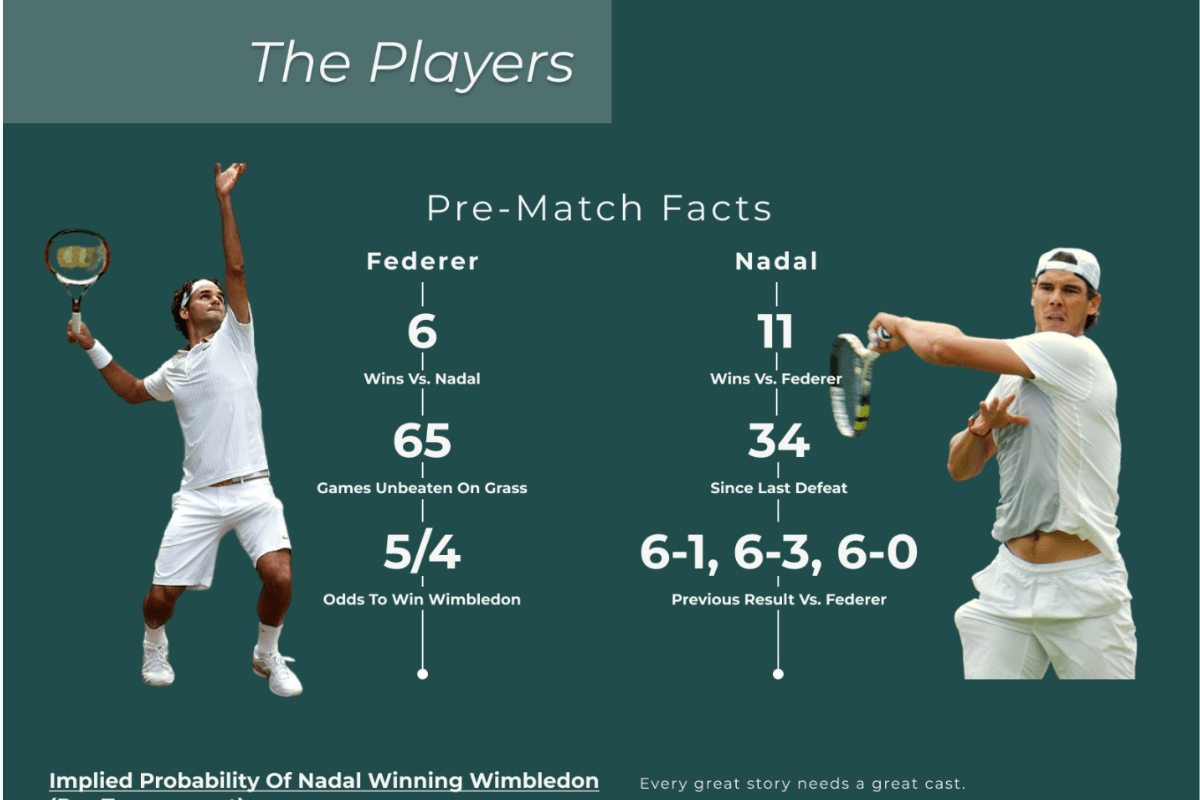
Nirosh Perera: I chose to visualize an iconic tennis match between two game greats because I knew there was an amazing story to tell. What sealed it is that the whole game is on YouTube. In addition to a website that gave some stats, I used the YouTube video to create data points of my own, plotting where the ball landed in key moments of the game. It was a grueling exercise that tested my patience, but it was worth it.
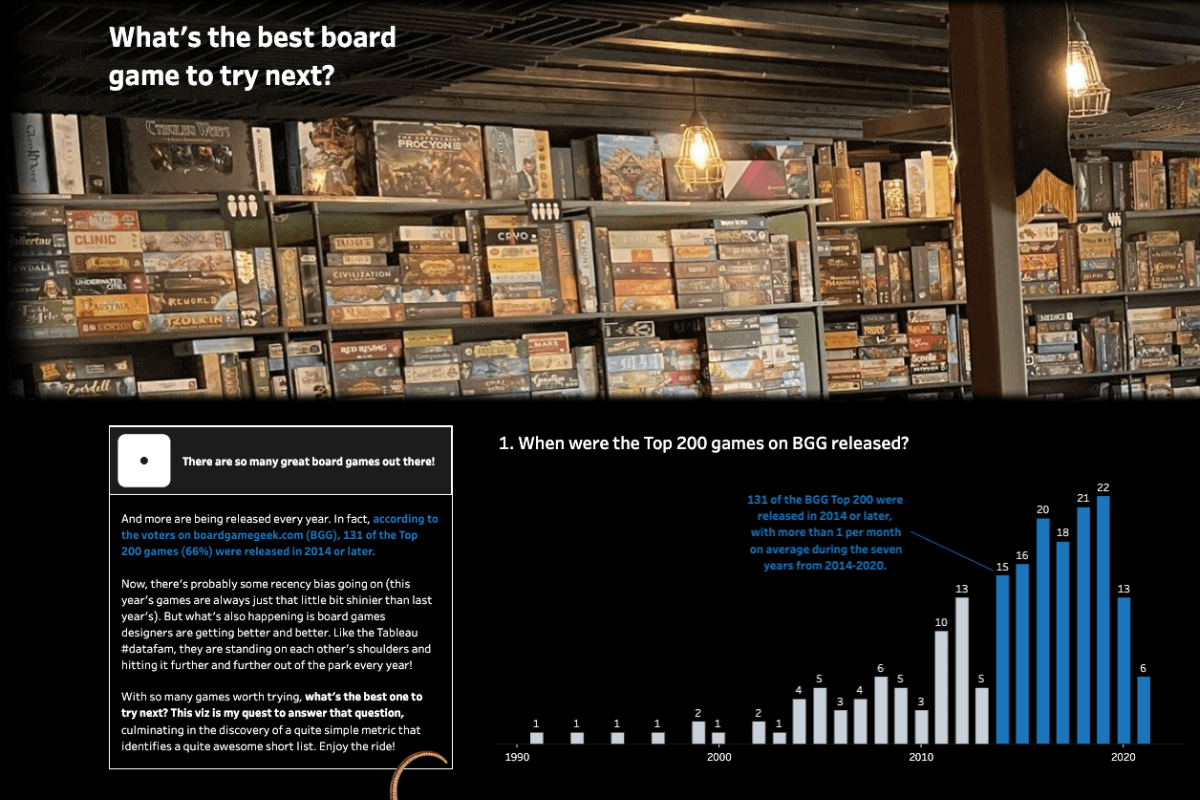
Paul Ross: I had a data set and an explorer viz ready to go. I started playing around with it to try and generate my universal list of awesome games. What if we only look at ratings? (Games too complex.) What if we only look at the vote count? (Games too old.) What if we look at the vote count but divide it by game age? (That looks interesting!)
As for what made me choose this topic, I enjoy introducing friends to new games. And once I saw that such a simple metric generated a fantastic list, I wanted to share it with all the friends I haven't met yet.
Can you share one thing about your visualization you’re proud of? Maybe something you learned while building your viz?
Brittany Rosenau: I'm most proud that it's a viz my family and friends can enjoy and understand without me needing to walk them through anything technical or explain anything about Tableau. I'm also really proud of the pudding charts. Those were new for me, and getting the interactive one to work was challenging.
Nirosh Perera: I'm most proud of the "Tie Break" section of the visualization. As I mentioned, it required me to plot the position of not only the ball but the position of both Federer and Nadal for every shot. I used this data in combination with the Pages Shelf—something I had never used before—to create something that mirrored the tennis match pretty well.
Paul Ross: It would be the combination of many small gaming touches that all contribute to the finished product. The obvious ones are the snakes and ladders, the dice, and the header picture from The Glass Die, a gamer bar in Reno, NV, that I know and love. Even the text boxes look a little bit like Monopoly squares (or at least I think they do) because that was one of my earlier ideas for the "transport mechanism" through the story before the snakes took over.
Speaking of those Monopoly squares, one lesson I learned is that restricting your text to a limited space really forces you to be brutal with your editing (in a good way) to get rid of any needless words that aren't advancing your story.
Has the Tableau Community helped you along your Iron Viz journey to becoming a finalist? In what ways has the DataFam supported you?
Brittany Rosenau: No doubt about it. I likely would not have entered at all if not for the Community. Everything, from the Iron Quest Community Project, tutorials, feedback sessions, and support during the feeder to friends I’ve made along the way, played a big part in previous and especially this year’s entry.
Nirosh Perera: Absolutely. I may not have explicitly asked anyone in the Tableau Community for help, but I find solutions to my Tableau problems pretty much every day within that space. In particular, I would love to give a shout-out to Pablo Gomez, who very deservedly has been made a Tableau Visionary. Pablo was the first person to show me the ropes in Tableau. His incredible skills and the amount of passion he has for data and this community bowled me over. He is a true inspiration.
Paul Ross: Absolutely. A big shout out to Fred Fery and Dave Keys, who organized some extremely enjoyable and educational evenings with the Brisbane Tableau User Group (TUG), and to all my fellow attendees who have been so welcoming. And huge thanks to Sarah Bartlett and her crew of volunteers for offering Iron Viz review calls during the qualifier month. I was lucky enough to have Sarah, Michelle Frayman, and Marc Reid on my call, and it was a fantastic 15-minute masterclass in better dashboard design.
What are you most excited about during the Iron Viz Championships, and what are you doing to prepare for the finals at Tableau Conference 2023?
Brittany Rosenau: I'm most excited to see what suit Andy Cotgreave will be sporting and what my fellow contestants have come up with. Right now, preparation is a lot of research and playing with the data to see what sticks.
Nirosh Perera: I am really looking forward to the experience of being on stage in front of thousands of people. It is a once-in-a-lifetime opportunity. Regarding my preparation, I've been coming to grips with the latest new features in 2023.1, working on speaking in public, and trying to find as many speed hacks in Tableau as possible.
Paul Ross: Being in front of thousands of people will be a once-in-a-lifetime experience. Hopefully, I'll remember to enjoy the ride while I'm up there rather than being terrified into speechlessness. Preparation-wise, I'm just trying to remember to sleep and eat occasionally.
As a finalist, you will receive money to donate to your favorite charity. What nonprofit are you supporting and why?
Brittany Rosenau: I'm supporting The Nature Conservancy. I see a lot of development happening in my area, and it's important that natural spaces are preserved for future generations to enjoy.
Nirosh Perera: I have chosen the charity Habitat for Humanity. I admire the simplicity and ambition of this charity's vision; to ensure everyone in the world has a decent place to live. I take for granted having a roof over my head and complain about having bills to pay, but of course, I am fortunate to have a home. If my donation helps to give someone else in the world a place to live, this will make me really happy.
Paul Ross: Environmental sustainability is important to me, personally, because I love the outdoors, like a lot of Australians. But it's much bigger than that. It's one of the few topics of truly international significance. And that's why I've chosen The Nature Conservancy as my charity. They tackle climate change on a global basis, and the great work they do is becoming increasingly important every day.
What is your favorite visualization of all time and why?
Brittany Rosenau: That's impossible to pick! But one I keep going back to is Gustav Holst - The Planets viz by Neil Richards. It caught my eye because that's one of my favorite works of music, and I could not believe how he visualized it. It really opened my eyes to what was possible with Tableau.
Nirosh Perera: My favorite visualization of all time has to be Hans Rosling's scatter plot comparing fertility rates with life expectancy. His presentation is absolutely incredible and so well thought out. I love its simplicity and, as a consequence, the impact it has. I hope to take inspiration from him in my Iron Viz build.
Paul Ross: The Most Timeless Songs Of All-Time is a long-form viz that begins with the following declaration: "This is a story about proving, with data, that No Diggity by Blackstreet is timeless." And it just gets better from there. It is a glorious topic, close to my heart, with some genuinely fascinating analysis to go along with it.
Where is home, and do you have anyone you want to call out for inspiring or supporting your Iron Viz/data journey?
Brittany Rosenau: I live in sunny central Florida. I'm lucky to have a lot of support. There would be too many folks to list who have been helpful along the way. But I'll shout out Nick Pillsbury, who played a huge role in introducing me to Tableau and has always been a big fan of my work.
Nirosh Perera: I am a Londoner born and bred but have recently moved to a town called Hoddesdon just north of the city. Aside from Pablo Gomez, I would love to call out two of my colleagues, Lydia and Sebastian, who supported me daily during the Iron Viz qualifier. I am so happy they will be in Las Vegas to cheer me on too. Thank you both!
Paul Ross: I live on Queensland's beautiful Gold Coast and would like to thank my lovely partner Tracy for all her support. Without her, it's not an exaggeration to say my Iron Viz entry would never have crossed the finish line. Not only did she order me back to the keyboard on the many occasions I attempted to procrastinate, but she was also tirelessly encouraging whenever I tried the "this is not working, so I'm just going to delete it all" gambit.
What is a fun fact about you? What do you like to do when you aren’t vizzing?
Brittany Rosenau trying new foods at an EPCOT food festival.
Brittany Rosenau: I've really gotten into houseplants the last few years. I've also recently rediscovered the joy of building with Lego and trying new foods. There's something satisfying about having hobbies with a physical product at the end of the day.
Nirosh Perera spending an afternoon golfing.
Nirosh Perera: When I am not vizzing, I will be out doing something active—going for a bike ride or playing football, tennis, or golf.
Paul Ross DJ-ing in Equador.
Paul Ross: I've been lucky enough to live in four countries (which I guess is a fun fact in itself.) But even more fun is the fact that while I was an exchange student in Japan, my classmates invited me to sing in their Bon Jovi cover band in a hall full of hundreds of screaming high school students. All my bandmates were fantastic musicians (it was like singing in front of the actual band.) And luckily for me, they needed someone who could sing in English, so I got the gig. And while I was undoubtedly the weak link in the line-up musically, I'd like to think I made up for it with my enthusiasm. In my spare time, I enjoy board games, pop culture, and the beach, which I try to walk every day, but even better if I have time for a bodysurf.
Get in on the action
Congratulations to our viz-tastic finalists, and thank you to everyone that participated in the qualifier round. Who will claim victory, bragging rights, and thousands of dollars in prize money for themselves and a charity of their choice? It all happens on May 10 at 4 p.m. PDT, and thousands of data enthusiasts worldwide will be watching in person and online. Here's how you can get in on the action:
- Add Iron Viz to your Tableau Conference schedule builder if you’ll be joining in Las Vegas or register for the virtual experience on Salesforce+.
- Challenge yourself (and earn a cool badge) by taking our new Trailhead Quest.
- Get social! Tell us what you're most excited about and who you're rooting for using #IronViz.
- Help choose this year’s Fan Favorite. The judges will determine the champion for this year's competition. We will award a separate Fan Favorite trophy to the contestant chosen by the audience during a global voting window. The Fan Favorite will be announced during The Vizzies Award Show. Text-to-vote numbers and more details will be shared during Iron Viz, so stay tuned.
Zugehörige Storys

DataFam Roundup June 2026

DataFam Roundup May 2026

Iron Viz 2026: Read Between the Data
 28 Mai, 2026