DataFam Roundup: October 30–November 3, 2023


Welcome! Dig into this week's DataFam Roundup—a weekly blog that brings together community content all in one post. As always, we invite you to send us your content—and the DataFam content from your peers that have inspired you! Find the content submission form here.
Community Highlight
To recognize new and consistent Tableau contributors—we’re excited to have a section within the weekly DataFam Roundup called the Tableau Community Highlight. Find out how to get involved.

Tanya Lomskaya, Freelance Journalist
Cyprus
Tanya Lomskaya is a freelance journalist who began using Tableau less than a year ago but is now the recipient of multiple Viz of the Days. Initially, her goal was only to understand how the tool works but once she decided to create some of her first visualizations, she discovered Community Projects. Once she took part in her first #MakeoverMonday, Tanya was hooked!
Tanya began her Tableau journey focused on creative projects but has recently pivoted to explore other ways of vizzing. In one of her newest vizzes, Visualizing Global Art Trade Paths, she incorporated a Python interface to build out her layout, gradient, and sizing. In the future, Tanya plans on continuing to explore the different visual and aesthetic effects that can be achieved when integrating Python code into her Tableau visualizations.
Connect with Tanya on Linkedin, X, and Tableau Public.
DataFam content
Dive into content created by the Tableau Community:
- Andrés Quiroz Sánchez: #DescargaTableauPowerPoint
- Matthew Miller: Postal Codes in Color
-
Steve Wexler, Data Revelations: How many lines are too many?
-
Chris Geatch, Tableau by Chris: Tableau: Using Dates AND Dimensions on the X-Axis.
-
Rajeev Pandey: Row Level Security in Tableau
-
Sean Miller: How to compare Year over Year values in Tableau
-
Sukhmeet Panesar, Data Leadership Collaborative: Should Data Leaders Strive to Replace Themselves?
-
Suresh Martha, Data Leadership Collaborative: 5 Strategies to Navigate AI’s Ethical Landscape
-
Eric Parker: How to Hide Data with a Filter in Tableau (LOOKUP, LAST, FIRST) — OneNumber
-
Deepak Holla, Importance of Right-click in Tableau Desktop
-
Venkatesh lyer, pHData:
-
Megan Menth, pHData: Everything You Need to Know About Parameters in Tableau: Part 1 of 2
-
Jun Yan Yeo: How to Create a 9-Box Employee Rating on Tableau - My Way
Team Tableau
Upcoming events and community participation
-
2024 Iron Viz Qualifiers: Top 10 Results Jan 17, 2024, 9:00 AM (PST) Virtual Event - Find out the top 10 Tableau Public visualizations, including the 3 finalists selected to compete in the 2024 Iron Viz Championship.
-
READY TO SUPERCHARGE YOUR DATA SKILLS? The Information Lab has free, on demand training courses will help you to make sense of your data and take you from zero to data hero. Developed by our industry leading trainers, our expansive courses cover the basics to intermediate levels of Tableau, Alteryx and Tableau Prep! You can take advantage of the whole course or simply choose the modules you need to brush up on your skills. Start your data journey today by simply selecting your training course below.
-
Demystifying the way to learn Data Visualization! Are you looking for a way to learn Data Visualization and feeling lost? We all have been there and I am going to help you understand the fundamentals and look for a way to learn data visualization.
-
Viz Collab: Hello everyone! I’m excited to be opening #VizCollab back up for another round of matches! In the last year I matched around 40 people for some amazing vizzes, including Viz of the Days and a viz that was featured in a local publication. So if you want to find a collaboration partner sign up.
-
Local Community Conferences by the DataFam, for the DataFam: VizIt Berlin
Vizzes
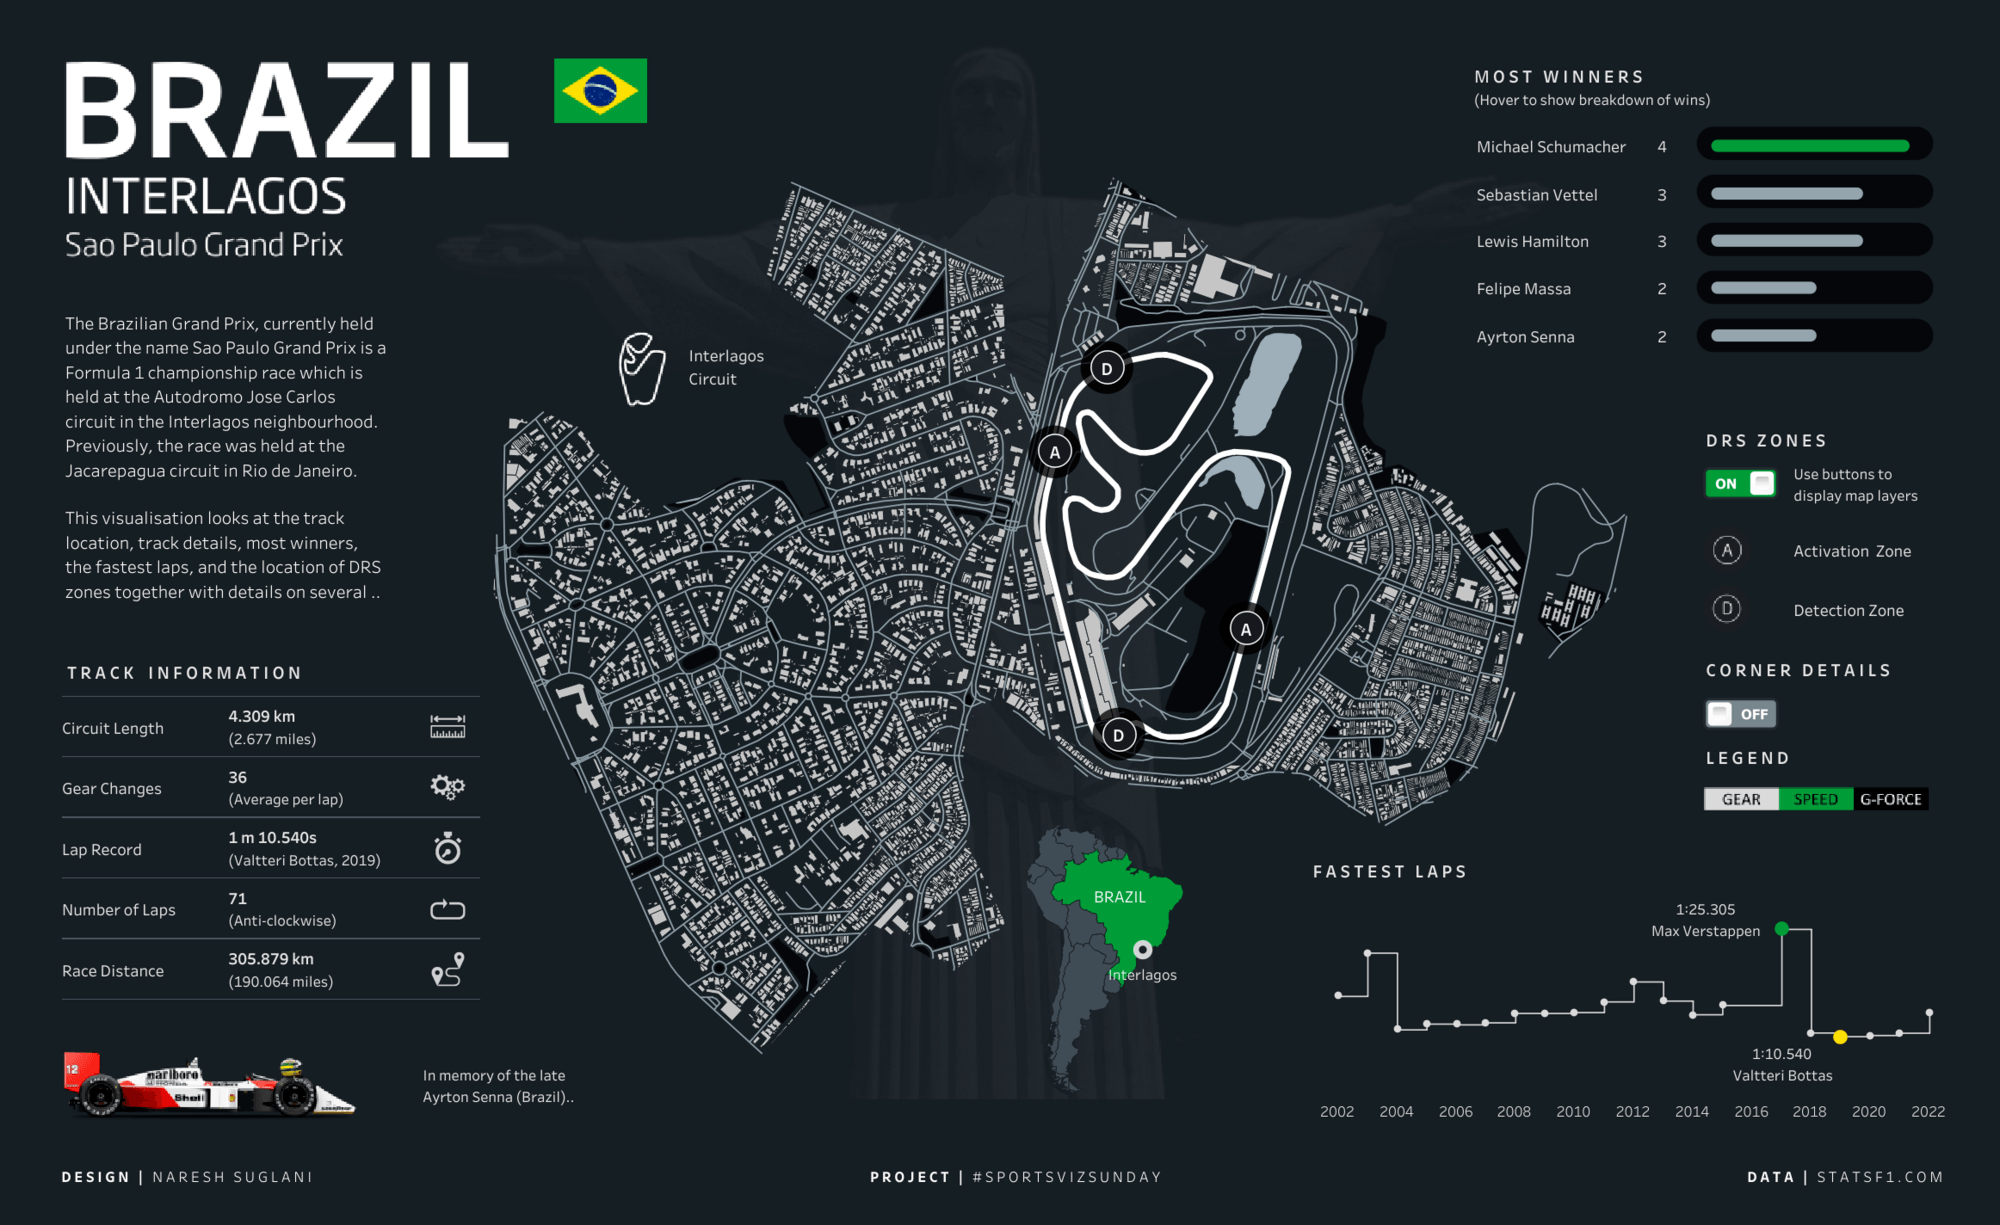
Naresh Suglani: F1 Brazil Grand Prix | Interlagos #F1 , #Formula1
See the latest Viz of the Day, trending vizzes, featured authors, and more on Tableau Public.
Check out some inspirational vizzes created by the community:
-
Samuel Parsons: Life Economics
-
Frans Geurts: The Golden Boy
-
Alexander Mou: Moving Pumpkins on Straight Lines
-
Naresh Suglani: F1 Brazil Grand Prix | Interlagos #F1 , #Formula1
-
Waqar Ahmed Shaikh: Breakdown of Workers' Remittances to Pakistan
Community Projects
Back 2 Viz Basics
A bi-weekly project helping those who are newer in the community and just starting out with Tableau. Not limited just to newbies!
Web: Back 2 Viz Basics
Twitter: #B2VB
Week 20: Build a Map II
Workout Wednesday
Build your skills with a weekly challenge to re-create an interactive data visualization.
Web: Workout Wednesday
Twitter: #WOW2022
Week 44: Prep School Spring Calendar
Makeover Monday
A weekly social data project.
Web: Makeover Monday
Twitter: #MakeoverMonday
Preppin' Data
A weekly challenge to help you learn to prepare data and use Tableau Prep.
Web: Preppin’ Data
Twitter: #PreppinData
Week 43: Best Attendance Awards
DataFam Con
A monthly challenge covering pop culture and fandoms.
Web: DataFam Con
Twitter: #DataFamCon
September 2023: Barbie World!
EduVizzers
A monthly project connecting real education data with real people.
Web: Eduvizzers
November 2023: Scholarship Recipients and Dollars by College Code: Beginning 2009
Games Night Viz
A monthly project focusing on using data from your favorite games.
Web: Games Nights Viz
Twitter: #GamesNightViz
Season 2: Battle of the Strongest
Iron Quest
Practice data sourcing, preparation, and visualization skills in a themed monthly challenge.
Web: Iron Quest
Twitter: #IronQuest
White Space
Storytelling with Data
Practice data visualization and storytelling skills by participating in monthly challenges and exercises.
Web: Storytelling with Data
Twitter: #SWDChallenge
November 2023: create a clever combo chart
Project Health Viz
Uncover new stories by visualizing healthcare data sets provided each month.
Web: Project Health Viz
Twitter: #ProjectHealthViz
June 2023: Funding for Research for Various Conditions and Diseases
Diversity in Data
An initiative centered around diversity, equity & awareness by visualizing provided datasets each month.
Web: Diversity in Data
Twitter: #DiversityinData
May 2023: Mental Health Awareness Month and LGBTQ+ Representation in film
Sports Viz Sunday
Create and share data visualizations using rich, sports-themed data sets in a monthly challenge.
Web: Sports Viz Sunday
Twitter: #SportsVizSunday
Viz for Social Good
Volunteer to design data visualizations that help nonprofits harness the power of data for social change.
Web: Viz for Social Good
Twitter: #VizforSocialGood
Oct 19—Nov 23, 2023: Physicalizing Data for a Better World
Real World Fake Data
Create business dashboards using provided data sets for various industries and departments.
Web: Real World Fake Data
Twitter: #RWFD
Session 5: Diversity Score Card
Data Plus Music
A monthly project visualizing the data behind the music we love!
Web: Data Plus Music
Twitter: #DataPlusMusic
Zugehörige Storys

DataFam Roundup June 2026

DataFam Roundup May 2026

Iron Viz 2026: Read Between the Data
 28 Mai, 2026