Best of Tableau Web: March 2022


To mark the five-year publish anniversary of my book, The Big Book of Dashboards, we’re celebrating on Chart Chat (sign up here), and I also thought it a good time to look at how members of the Tableau Community are talking about dashboards these days.
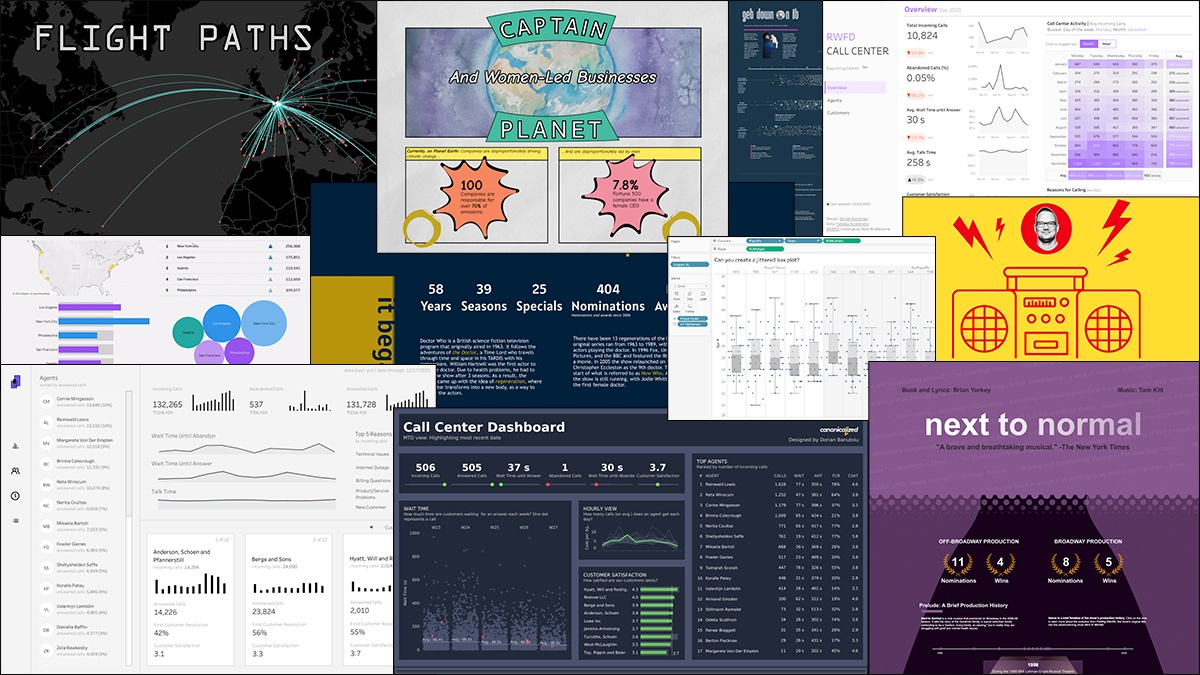
First of all, I must direct you to Mark Bradbourne’s Real World Fake Data project. Every two weeks he provides a dashboard and the data behind it. Your job: Rebuild it. I am so inspired by the submissions, as seen in his Call Center recap, for example.
One trend I’ve noticed is more people using design tools to enhance their dashboards. Jacqui Moore outlines the pros and cons of this approach, with some advice on how to use design tools. One aspect Jacqui focuses on is using these tools for prototyping—a topic that Rafael Simancas from Playfair Data further explores in his deep dive on Figma.
The power of Tableau has increased significantly since my book was published, and it’s now possible to build much more powerful data-driven dashboards. Sena Sevval Inan from Biztory blogs about how she uses parameters and calculated fields to build dynamic dashboards.
I also take inspiration from the trends we see in the Iron Viz competition, and I want to thank the judges who worked so hard to assess the results. What does it take? Christina Gorga reflected on her experience as a judge. An Iron Viz entry isn’t the same as a business dashboard, but there are always tricks you can reuse in your dashboard work: for example, Christina calls out the carefully crafted tooltips and text objects she saw.
Speaking of Iron Viz, I’m very excited that we’ll be back with a live, in-person Iron Viz at Tableau Conference in Las Vegas in May. I hope to see you there, whether you attend virtually or in person!
With that, enjoy Best of the Tableau Web with tips, tricks, inspiration and more produced by the Tableau community. For updates throughout the month, follow me on Twitter and LinkedIn, and check out the list of blogs I follow for Best of the Tableau Web. If you don’t see yours on the list, I invite you to add it here.
Calculations
- Top 10 Functions in Tableau You Need to Know
Anthony B. Smoak
Code
- Creating Flight Paths in Tableau
Marc Reid, datavis.blog
- How to Remove Unwanted Values (e.g. Nulls) from Tableau Filters
Eric Parker, OneNumber
- Build a Selected vs. Comparison Date Period Filter in Tableau
Eric Parker, OneNumber
Formatting, Design, Storytelling
- How to Create Better Dashboard Layout Designs with Figma
Rafael Simancas, Playfair Data
- Techniques for Disabling the Default Highlighting in Tableau
Brian Moore, Do Mo(o)re with Data
- Filtering Partial Date Period in Tableau
Alexander Mou, Vizible Difference
Inspiration
- Real World Fake Data, Season 2, Starts Now!
Mark Bradbourne, Sons of Hierarchies
- Real World Fake Data – Season 2
Mark Bradbourne, Sons of Hierarchies
- RWFD Season 2 – Call Center Recap
Mark Bradbourne, Sons of Hierarchies
- Telling a Story with Your Data
Nicole Klassen
- 29 Colour Palettes
CJ Mayes
- What Does Being A Tableau Visionary Mean To Me
Adam Mico
- Iron Quest – Music Firsts
Sarah Bartlett, Sarah Loves Data
- Tableau Tips - Volume 21: Forecast Tips
Jeffrey Shaffer, Data Plus Science
- It Depends: Using design tools in your dashboard design process
Jacqui Moore, Do Mo(o)re with Data
Iron Viz
- The View Behind the Curtain: My Experience as a 2022 Iron Viz Judge
Christina Poulin Gorga
Prep
- 2022 Week 12 - Solution
Carl Allchin, Preppin’ Data
Set and Parameter Actions
- New uses cases for parameter actions – Rativiz
Annabelle Rincon, Rativiz
Tips and Tricks
- Can you create a jittered box plot?
Donna Coles, Donna + DataViz
- How to Make Your Dashboard More Interactive with Dynamic Dimensions
Sena Sevval Inan, Biztory
- How to Create an Alternative to a Merimekko Chart
Andy Kriebel, VizWiz
- The 5 "out-of-the box easiest ways to drill down in Tableau"
Steve Adams
- Ten Tiny Tableau Tips Pt. 2
Autumn Battani, Make It Make Sense
- Six Steps to Troubleshooting Tableau Dashboards
Nicole Klassen, Mighty Kanary
- Reference Lines And Other Helpful Month Over Month Visuals
Dawn Harrington, Tech Tips Girl
- Tableau Workbook Optimiser: New in Tableau 2022.1
Tim Ngwena, Tableau Tim
Visualizations
View last month’s Viz of the Day on Tableau Public gallery.
Zugehörige Storys
DataFam Roundup July 2026

DataFam Roundup June 2026
