As March comes to an end, let's have a look at what people have been blogging about this month. I'd like to thank all of those who are out there, blogging about Tableau. Whether it's innovating new ways to use the software or applying it to real data, we're hugely grateful! February was short, but it didn't stop our community producing lots of great content. Here is the collection of what's been happening on the web in the last month. Didn't have time to look for blog content in Jamuary? No worries: we do it for you. Here is the collection of what our customers had to say about Tableau last month. Here's the belated round up of December's blogging activity. If you follow me on Twitter (@acotgreave) you'll find these as I find them. If you published an interesting blog post in December and it's not here, get in touch on twitter and I'll subscribe to your blog. At the end of each month, I will pull together a collection of links to the most relevant, innovative and interesting Tableau-related content I come across, inspired by Andy Kirk's monthly visualisation round ups.Alle Storys
Unleashing the Tableau Data Server
 3 Mai, 2013

Expanding beyond 16 columns without header concatenation

Pushing the boundaries with the JavaScript API: An interview with Michael Kovner
 1 Mai, 2013

Tableau + Cloudera Impala: Bring Your Hadoop Data To Life!
 30 April, 2013

Let's talk about sets

Introducing the Customer Speakers for TCC London -- Part 2
 12 April, 2013

Best of the Tableau Web: March 2013
 27 März, 2013
Best of the Tableau Web: February 2013
4 März, 2013
Best of the Tableau Web: January 2013
13 Februar, 2013
Best of the Tableau Web: December 2012
11 Januar, 2013

Using Analytics in the Pharmaceutical Industry
21 Dezember, 2012
Best of the Tableau Web: November 2012
29 November, 2012
Data
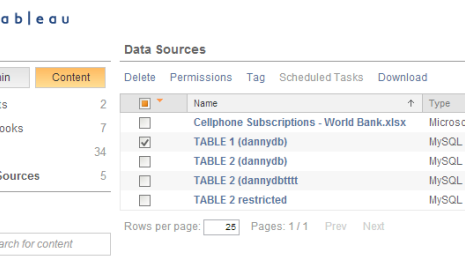
Tableau Server has many built in features to promote data exploration, collaboration, and security. The Data Server is arguably the most powerful of these tools but is commonly overlooked and underutilized. Answer these questions to see how the Data Server can save you time and increase productivity.
• Are you struggling to manage and update many large extracts while removing duplicates?
• Do you want to refresh your extracts once and automatically update your workbooks?
• Do you want to provide centralized management of your metadata? The ability to author a calculation once and share it with everyone, creating a standardized definition for each field?
• Are you tired of having to deploy database drivers on each users local machines?
• Do you want to simplify how your users access data stored in your databases?
If you found yourself replying 'yes' to any of these questions, then it’s time to unleash the Data Server.
Visualizations
Header Concatenation: This was a new problem for me.
Heck, it was a new word for me up until recently.
Janet Shen, one of the incredible Viz Magicians from Tableau Professional Services sent me a great "How To" guide for overriding our default settings and I couldn't wait to share it. The useful content is ALL her. The silliness is all me. Hope you find this as helpful as I did!
Click inside to get the step-by-step tutorial.
Developer
The release of the JavaScript API as part of Tableau's 8.0 launch has opened up an entire world of possibilities for people wanting to integrate Tableau visualizations within their existing business applications. Since I myself am not an familiar with JavaScript even in the slightest, I decided to sit down with someone from Tableau who is and get their perspective on how big a game changer this API really is. Fortunately for me (unfortunately for him) Michael Kovner, Tableau Product Consultant and JavaScript dabbler, sits close enough for me to harass on a near daily basis.
Data
Today, our friends at Cloudera have formally launched their SQL-on-hadoop offering called "Impala". Did you know that Tableau was one of the first ISVs to support Impala?
Data
Sets have been an evolving part of Tableau Desktop and that remains true in 8.0. Our New Features page offers an excellent overview of the new possibilities available to you using sets in 8.0.
With this blog post, I wanted to get a little deeper into two ways that sets can help you make your data more meaningful and useful in dynamic ways: adding sets to hierarchies and using sets in calculations.
Tableau Community
Earlier this week, you met the first half of our customer speakers for TCC London. Today, we're excited to announce the rest of them. Read on to "meet" the second half of the TCC London customer speakers.
Best of Tableau Web
Best of Tableau Web
Best of Tableau Web
Best of Tableau Web
Tableau
This week, we launched a new pharmaceutical solutions page to show off some of Tableau's use cases for pharmaceutical analytics, pharmaceutical sales and physician marketing.
Best of Tableau Web