Last year, KJ Kim met Royce Ho through a Viz Competition called the Data Stories of Singapore 2018, where he won first prize with this visualization on Singapore’s Early Education Landscape. Almost six months after the competition, KJ caught up with Royce to hear about his Tableau story and how his exposure led him to new opportunities, like an internship with Sephora.Alle Storys

Usability is the most satisfying design puzzle to solve
 10 Juli, 2019

Data visualization resources for analysts of all skill levels
 9 Juli, 2019

Federal Data Strategy should be a work in progress, by design
 8 Juli, 2019

Generation Data: Data competition opens doors for Singapore student
 3 Juli, 2019
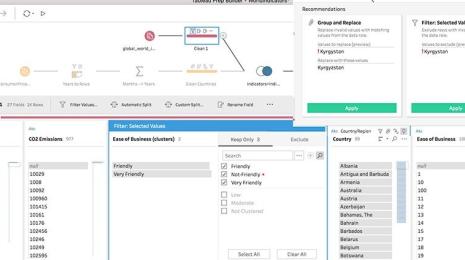
Neu in Tableau Prep Builder: Visuelles Filtern und verbesserte Datenstandardisierung
 2 Juli, 2019
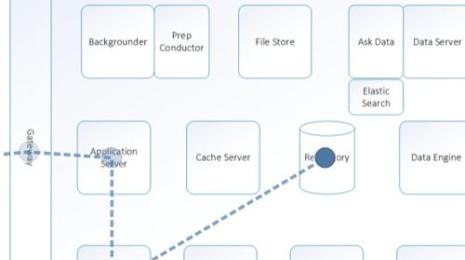
How to become a Tableau Server process expert
 1 Juli, 2019
Erklär die Daten, Tableau Catalog und Project McKinley jetzt als Betaversion
 28 Juni, 2019

Second winner announced for Iron Viz TCE
 27 Juni, 2019
Beyond the hook: Building information experiences for attention and engagement
26 Juni, 2019

How to make the Federal Data Strategy succeed
25 Juni, 2019

Iron Viz at TC Europe struck a chord with music data
 21 Juni, 2019
How to combine PostGIS and Tableau to unleash more spatial goodness in your analysis
Data
Tableau Zen Masters, Mike Cisneros and Lilach Manheim, share why usability is the most satisfying design puzzle to solve.
Visualizations
Looking for data viz resources? Use this list to explore best practices, get inspired by data viz podcasts, and dig into words of wisdom from the Tableau community.
Data
We know that Blueprint’s approach to analytics can succeed in the federal government so we’ve proposed incorporating tenets from Blueprint into the Federal Data Strategy Action Plan. Steven J. Spano summarizes four areas of proposed changes that will help federal agencies carry out their missions and be more data-driven.
Academic
Product
Das Vorbereiten von Daten für die Analyse erfordert häufig das Einrichten von Filtern, das Duplizieren von Feldern oder das Standardisieren von Werten – fehleranfällige Aufgaben, für die oft komplexe Berechnungen notwendig sind. In der neuesten Version von Tableau Prep Builder (2019.2.3) haben wir den entsprechenden Workflow wesentlich vereinfacht.
Enterprise
Get a look under the hood at Tableau Server processes and apply this knowledge to optimize Tableau Server performance for your organization as you configure and scale your deployment.
Product
Tableau 2019.3 Beta: Ab sofort verfügbar und mit jeder Menge neuer Funktionen zum Ausprobieren – von Erklär die Daten über Tableau Catalog bis zu Project McKinley. Nicht verpassen!
Tableau Community
We are happy to announce that Anna Dzikowska joins Simon Stusak as a winner of 2019 Iron Viz Europe.
Visualizations
Every audience’s interaction with an information experience begins with choice. Zen Masters, Lilach and Mike explore what factors influence choice.
Data
The Office of Management and Budget just released a draft, one-year action plan for a comprehensive federal governmentwide directive on data. Steven J. Spano explains what it will take to make the new Federal Data Strategy stick.
Visualizations
Iron Viz Europe is the ultimate data showdown where data rockstars from across Europe compete live on stage with the same data set to determine who will be crowned the European champion. This year, Anna Dzikowska (Poland), Simon Stusak (Germany), and Tristan Schouten (Netherlands) went head-to-head in a viz battle for the ages. Check out the vizzes and discover who rose above the rest.
Data
20 Juni, 2019
How to use PostgreSQL and its spatial extension, PostGIS, in combination with Tableau to add spatial data to your analysis.