Announced at Tableau Conference Europe—Explain Data, Project McKinley and Tableau Catalog will be available in the Tableau 2019.3 beta, coming soon!Alle Storys

Announcing the 2nd Iron Viz global qualifier—join the ultimate data competition
 20 Juni, 2019

Vier Möglichkeiten zur Ermittlung von Warnsignalen für Korruption mithilfe von Data Analytics
 19 Juni, 2019

Kicking off Tableau Conference Europe with a Blueprint for data culture, platform innovations, and more
 18 Juni, 2019
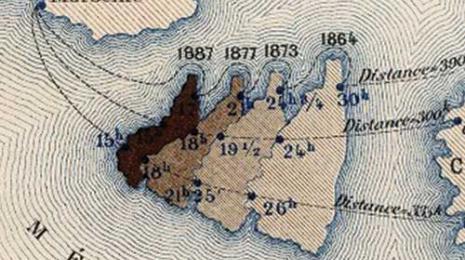
Design secrets we can learn from historic visualizations
 17 Juni, 2019

Das Projekt Data + Music verrät Geheimnisse hinter unseren Lieblingsliedern
 13 Juni, 2019
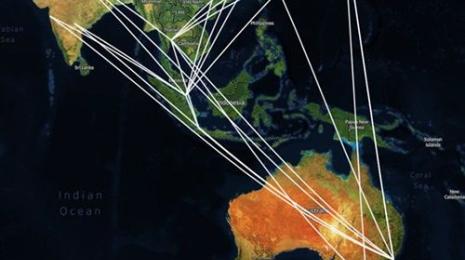
Problemlose Analysen georäumlicher Daten mit zwei neuen räumlichen Funktionen: MakePoint und MakeLine
 13 Juni, 2019
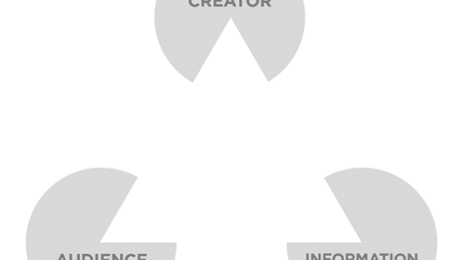
Creating, not designing: The four goals of every information experience
 13 Juni, 2019

Nominations are now open for 2019 Tableau Ambassadors, Introducing Student Ambassadors!
 11 Juni, 2019

Tableau Community, Meet Salesforce and the Trailblazers
 10 Juni, 2019
Salesforce unterzeichnet die endgültige Vereinbarung zur Übernahme von Tableau
 10 Juni, 2019

Rock your first hackathon!
 7 Juni, 2019
Tableau Public
Enterprise
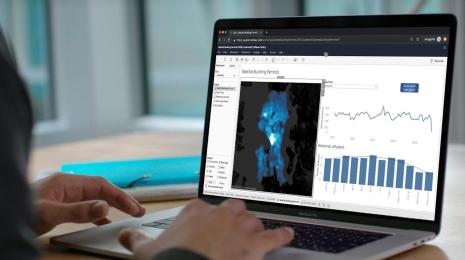
Bei der Entwicklung von verbindlichen Maßnahmen für Compliance-Programme müssen Unternehmen auch eine entsprechende Überwachung und Auditierung sowie eine fortlaufende Evaluierung der Effektivität des laufenden Programms festlegen, damit Verstöße gegen den Foreign Corrupt Practices Act (FCPA) von 1977 auch wirklich verhindert werden. Für die internen Revisions- und Auditteams, die mit der Überwachung und der Auditierung betraut sind, ist Data Analytics ein wichtiges Tool zur Verbesserung der Wirksamkeit von Compliance-Programmen. Durch Nutzung der Tableau-Analytics-Plattform zur Ermittlung von Risikofaktoren und von Designplattformen zur Kennzeichnung von Unregelmäßigkeiten sowie durch Versenden proaktiver Benachrichtigungen kann Ihr Compliance-Programm ganz auf die frühzeitige Aufdeckung und Verhinderung von Korruption ausgerichtet werden.

Tableau Conference
Visualizations
RJ Andrews discusses design secrets we can learn from eight historic visualizations that have stood the test of time.
Tableau Community
Vorhang auf für Data + Music von Tableau, ein Projekt der Tableau-Community, das die Verbindungen zwischen Daten und unserer Lieblingsmusik als Datenvisualisierungen darstellt.
Visualizations
Für alle, die Standortdaten verstehen und räumliche Muster erkennen möchten, führt Tableau zwei neue räumliche Funktionen ein, mit denen Standortdaten einfacher denn je analysiert werden können.
Visualizations
Guest bloggers Lilach Manheim and Mike Cisneros explain four goals behind a dataviz design philosophy that will help you create more meaningful information experiences and outcomes.
Tableau Community
Nominations are now open for 2019 Tableau Ambassadors! Learn about the types of data heroes we are looking for and how to nominate someone today. Submit nominations between June 11 and July 12, 2019.
Tableau Community
We have big news to share, Tableau has entered into an agreement to be acquired by Salesforce.
Tableau
Tableau hat eine Vereinbarung zur Übernahme durch Salesforce abgeschlossen. Durch diese Vereinbarung schließen sich die Nr. 1 im Kundenbeziehungsmanagement und die Nr. 1 im Bereich von Analytics-Plattformen zu einer dauerhaften Verbindung zusammen.
Developer
Hackathons can be intimidating—especially if it’s your first one. In this post, I’m going to share tips and tricks that will prepare you for your first hackathon.