In this month’s Best of the Tableau Web, Andy Cotgreave shares the blogs he loves from January. Dive in to get inspired, learn new tips and tricks, and more.Alle Storys

Ensuring health and safety for our community
 4 März, 2020
Neu in Tableau Prep Builder: Dauerhafte Serveranmeldung, einfachere Bereinigung für Datenfelder und Unterstützung neuer Connectors

How I presented data on disabilities to a U.S. Ambassador to the United Nations
What’s new for #DataDev: Extensions on Tableau Public, Webhooks, API updates, and more!
 28 Februar, 2020
Unlock scalability with login-based license management—without keys
 27 Februar, 2020

Value series: Measuring and adding value go hand in hand with modern analytics
 26 Februar, 2020
Neu in Tableau Prep: Unterstützung für visuelle LOD- und Analytics-Funktionen
 25 Februar, 2020


Jetzt in Tableau verfügbar: Dynamische Parameter, Animation von Visualisierungen, Umkreisberechnungen und vieles mehr
 24 Februar, 2020

How I built an internal training program at Just Eat in six weeks
 20 Februar, 2020

Tableau Conference Europe speaker applications are now open
 18 Februar, 2020
Best of the Tableau Web: New features and growth opportunities
 14 Februar, 2020
COVID-19
Over the past few weeks, we have been closely monitoring the evolving situation with the spread of coronavirus (COVID-19) to ensure we are taking every precaution to look after our community and everyone in the Tableau #DataFam.
Product
3 März, 2020
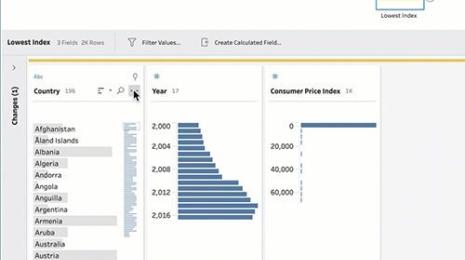
Die Tableau Prep-Version vom März 2020 ermöglicht schnellere Bereinigungen für Datumsfelder, unterstützt den Cloudera Impala-Connector und erlaubt die dauerhafte Serveranmeldung, sodass Sie sich nicht bei jedem Öffnen von Tableau Prep Builder neu anmelden müssen.
Visualizations
2 März, 2020
On the International Day of Persons with Disabilities, Nick Hara was given two minutes to advocate for people with disabilities using data visualization. In this post, Nick shares the process behind the dashboard along with his learnings.
Developer
Every month, the Tableau #DataDev team hosts Sprint Demos for the members of the Developer Program. February Sprint Demos included extensions for Tableau Public, and updates for Webhooks, Extensions API, and JavaScript API.
Product
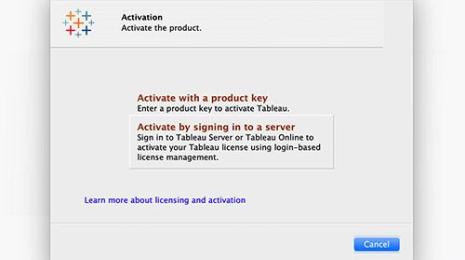
We're excited to introduce a new way to license Tableau—no product keys required. Login-based license management (LBLM) allows Creators to activate Tableau Desktop or Tableau Prep by simply logging in to these products with their Tableau Server or Tableau Online credentials.
Data
Check out these important factors for building activities into your modern analytics program that encourage stronger returns on your investment. With these approaches ingrained in your analytics strategy, you’ll add measurable value to your users and deployment faster.
Product
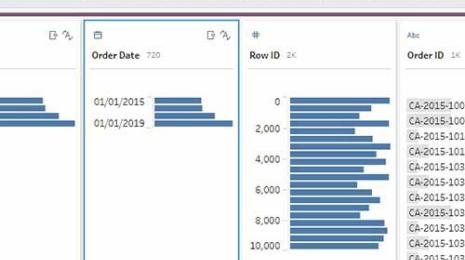
In der neuesten Version von Tableau Prep Builder (2020.1.3) werden LOD-Berechnungen (Level of Detail) unterstützt, die Aggregationen wesentlich vereinfachen. Neu sind auch die Funktionen „Rang“ und „Zeilennummer“ – damit lassen sich Daten noch umfangreicher bereinigen und umformatieren.

Product
Wir stellen vor: Tableau 2020.1 – dynamische Parameter, Animation von Visualisierungen, Umkreisberechnungen und vieles mehr.
Data Skills
Building a training program at any company can be a huge effort. Data Visualisation lead at U.K. food and delivery service, JUST EAT, shares how he built the DataChefs program in just six weeks, with tips on how to build a curriculum, secure executive sponsorship, and scale a program beyond its conception.
Tableau Community
Apply to become a customer speaker and share your insights with thousands of other data enthusiasts. Selected from a diverse span of industries, use cases, and organisations, we welcome the highest calibre customer speakers to TC Europe.
Best of Tableau Web