This month, Andy Cotgreave reflects on contributions from the Tableau community as a whole and shares his favorite community-made content from December. Welcome to Part Three of our four-part blog series, Better Government with Data Analytics. In this blog, we’re going to take a closer look at how adopting a thoughtful approach to data analytics leads to success. We're sharing part two of our four-part blog series, Better Government with Data Analytics. Dive deeper in part two as we share three focus areas to help you drive a higher level of data literacy. By leveraging Tableau and Alation together, business analysts at MercadoLibre can start an analysis with a query in Alation and seamlessly continue the analysis in Tableau. The integrated solution gives MercadoLibre users the confidence to find data they need for analysis—even if it lives outside Tableau Server—and understand how to best apply it to their analysis.Alle Storys

Best of the Tableau Web: Reflections, predictions, and plans
 27 Januar, 2020
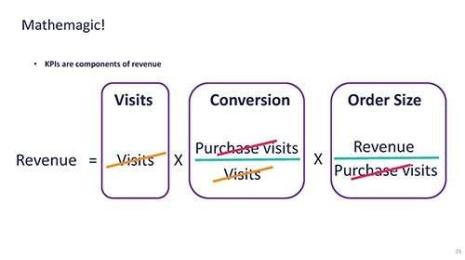
Five TC sessions to improve your marketing analytics
 24 Januar, 2020
Better Government with Data Analytics: Analytics is a team sport
 22 Januar, 2020

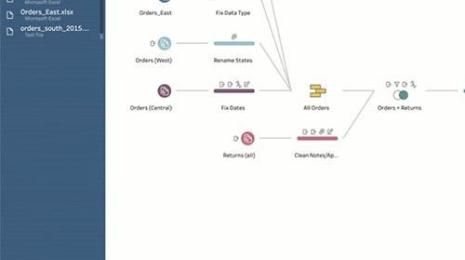
Tackling Nest thermostat data with Tableau Prep
 21 Januar, 2020
Value series: Time to reevaluate how you measure the value of your analytics
 16 Januar, 2020

Better Government with Data Analytics: Three ways to build data literacy in your organization
15 Januar, 2020
Neu in Tableau Prep Builder: Aufbereitung als Massenvorgang und verbesserte Kompatibilität mit Tableau Server
 14 Januar, 2020
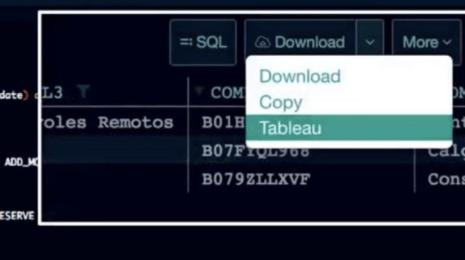
MercadoLibre grows governed, self-service analytics with Alation and Tableau
 13 Januar, 2020

Better government with data analytics: hats, cattle, and analytics
8 Januar, 2020

Navigating New York with the “City of Women” Map
 6 Januar, 2020
Level up your finance analytics skills with resources from TC19
 2 Januar, 2020

And the winner of the Student Viz Assignment Contest is...
 23 Dezember, 2019
Best of Tableau Web
Data
We’ve done the work of finding helpful and relevant marketing-related TC sessions for you. Here are recaps of a few of these sessions from customers like GoDaddy, Lending Tree, FICO, among others, and from us at Tableau, sharing the recording and highlighting ideas you’ll want to replicate at your own company.
Data
Tableau Zen Master Joshua Milligan walks you through how he used Tableau Prep 2019.4 to connect directly to Nest thermostat data he captured in Google sheets.
Data
Time to reevaluate how you measure the value of your analytics. Establishing the right metrics to track value will not only help you prove your analytics investment, but identify areas to focus attention and increase its value.
Product
Im Folgenden finden Sie Informationen zu den Neuerungen in Tableau Prep Builder. Aufbereitung als Massenvorgang, Hervorhebung von Verbindungen und verbesserte Kompatibilität mit Tableau Server.
Data Skills
Data
Welcome to Part One of our four-part blog series, Better Government with Data Analytics. This series is for state, local, and education data rock stars who are interested in gaining deeper insights about how to leverage data to improve results, and build a culture of analytics within their organizations.
Visualizations
A chat with map co-creator Joshua Jelly-Schapiro about the process of creating “City of Women” and how maps help us see places in new ways.
Data
A variety of finance experts took the stage at Tableau Conference 2019 (TC19) to address challenges facing finance analytics. Read on for key takeaways from these finance-focused sessions and apply them in your own organizations. Bookmark these sessions, watch (and re-watch) them throughout the year.
Data Skills
With entries from 13 countries for our 2nd Round of our Student Viz Assignment Contest, it wasn't an easy decision to pick a winner! From entries across the world including George Mason University (US), Nanyang Technological University (SG), The University of Waterloo (CA) and EDHEC (FR), we picked three winning vizzes. Our winners were chosen based on their creativity, analytical depth, beauty and design, and their overall impact on the judges. Our winners will receive some coveted Tableau swag from us for their brilliant work!
So without further ado, the winners for our Round 2 2019 Student Viz Assignment Contest are: