As part of the Tableau Developer Program, we host monthly Sprint Demos, where members of the engineering team demo what they have been working on for our developer community. This month, we had product managers and engineers from the Advanced Analytics, Connector SDK, and Hyper API teams. Hello, Tableau community! Welcome to Andy's February round up of the best content being produced by you, the Tableau community.Alle Storys
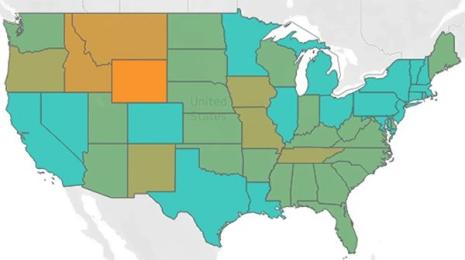
Flattening the curve: How well is your county doing coronavirus social distancing?
 30 März, 2020
Analytics extensions connections, Connection Dialog v2 for Connector SDK, and Hyper API monthly updates
 30 März, 2020

Visualizing COVID-19: A discussion on the “flatten the curve” visualization and responsible data use
 27 März, 2020

Coronavirus Data Hub FAQ: What you should know about our COVID-19 dataset
 26 März, 2020

Challenge your #DataDev skills and take advantage of your sandbox site with the Tableau Developer Program
26 März, 2020

Rising to the challenge: How this Seattle nonprofit is making a difference during the COVID-19 outbreak
 20 März, 2020
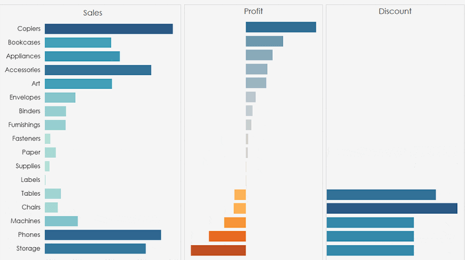
The benefits of animating your data visualisations
19 März, 2020

How to accurately translate analytics requests into dashboards, sheets, stories and more
 19 März, 2020
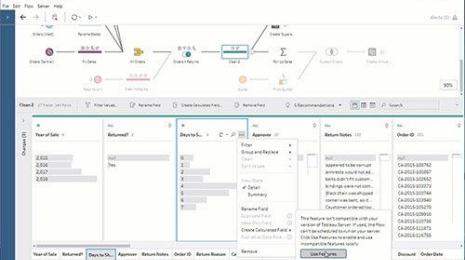
Building compatible flows for Tableau Prep Conductor
 18 März, 2020
An open letter to our customers
 17 März, 2020

Best of the Tableau web: Data culture and business transformation
17 März, 2020
COVID-19
The coronavirus is spreading quickly through the United States, and many elected officials across the country are reacting with policies designed to slow the transmission of the pandemic, otherwise known as “flattening the curve.”
Developer
COVID-19
In this post, we’ll cover these three topics, along with links for further reading. Watch the full Chart Chat to learn more.
COVID-19
We've pulled together a Coronavirus Data Hub FAQ. Learn how to familiarize yourself with the data before you start your analysis.
Developer
One of the biggest benefits of joining Tableau’s Developer Program is a free, personal developer site. In this blog post, we’ll give you some tips for making the most of your Tableau sandbox site.
COVID-19
As the COVID-19 outbreak progresses, Tableau Foundation is doing its part to support communities and organizations affected by the crisis. We recognize that we have a role to play as a funder with deep roots in Seattle and communities across the world, and with strong partnerships with our grantee organizations. These are unprecedented times, and we are working to respond swiftly and thoughtfully to evolving needs.
Visualizations
Could making the decision to animate your data visualisations be the way forward for your organisation?
Data Skills
Both analysts and citizen data analysts are faced with requests for information on a regular basis—from our colleagues, our bosses, or our clients. Sam Priddy shows you how to systematically break down these requests and organize them in a way that allows you to take action—to create analyses that accurately address the initial request with the least amount of back-and-forth possible.
Product
With Tableau Prep Conductor, part of the Data Management Add-On, you can schedule flows on Tableau Server or Tableau Online, so everyone in your organization is using the most up-to-date data available.
COVID-19
We at Tableau are holding those who are fighting this illness and those who have already suffered losses very closely in our hearts.
Best of Tableau Web