Learn about Metrics for Tableau—Optimized for mobile, track all your KPIs from various dashboards at a glance, all in one place—anytime, anywhere. Learn tips and tricks for using relationships, new data modeling capabilities in Tableau, for more flexible analysis. Welcome back to another recap of our livestream series, If Data Could Talk! This episode features host Andy Cotgreave, Technical Evangelist at Tableau, and special guest Cole Nussbaumer Knaflic, CEO and Founder of Storytelling with Data. A broad consensus is that COVID-19 will drive digital transformation in the public sector. During the 2020 Government Summit, speakers from Veteran Health Administration, Southwest Texas Regional Advisory Council, and FEMA discuss new processes, new technologies and innovations, and most importantly, a new mindset on decision making in the midst of crisis.Alle Storys

Truncating the Y-Axis: Threat or Menace?
 1 Juni, 2020
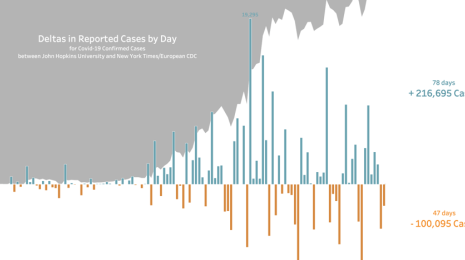
8 changes to the COVID-19 data set
 29 Mai, 2020

Developer Platform updates: Hyper API and JavaScript API
 29 Mai, 2020

Three ways to make your COVID-19 dashboards more accessible to people with disabilities
 28 Mai, 2020
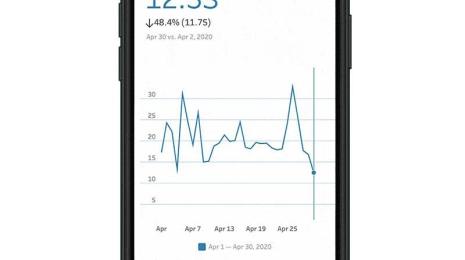
Metrics, headlines for your data
 28 Mai, 2020

Best of the Tableau Web: Collaboration time
 27 Mai, 2020

Relationships, part 2: Tips and Tricks
 27 Mai, 2020

If Data Could Talk: Data Literacy Starts with Kids
 26 Mai, 2020
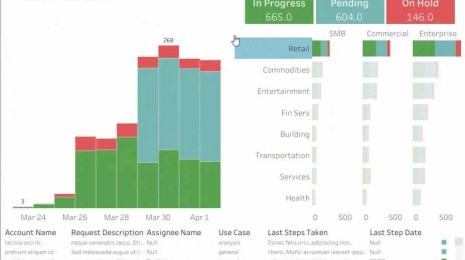
Vier Schritte zur Nutzung von Daten in Ihrem betrieblichen Kontinuitätsplan für COVID-19
26 Mai, 2020


A student’s guide to Tableau and the Desktop Specialist exam
 22 Mai, 2020
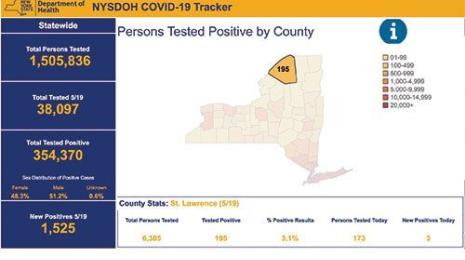
What we can learn from the public sector’s response to COVID-19
 21 Mai, 2020
Engineering
Learn why it's important to avoid any scenario where the visual difference shown in your chart becomes disconnected from the actual difference in the data.
COVID-19
Last week, we began to make our customers and community aware that changes were coming to the COVID-19 case data stream Tableau has been hosting on the Coronavirus (COVID-19) Data Hub. Read about the changes in our latest blog post.
Developer
Each month, our Developer Program delights its members by showcasing the latest projects from our developer platform and tools engineers. In May, we highlighted updates from the JavaScript API, Hyper API, and the REST API teams. Let’s dive into what we showed.
Tableau Public
Product
Tableau Community
Hello, Tableau community! Welcome to Andy's April round-up of the best content being produced by you, the Tableau community.
Product
Data Skills
COVID-19
In diesem Blog geben wir Ihnen ein vierteiliges Konzept an die Hand, das Ihnen vermittelt, wie Sie Daten und Analytics nutzen können, während Sie sich auf neue Arten der Betriebstätigkeiten umstellen. Anhand von Beispielen aus unserem Webinar „Tableau on Tableau: Leading Through Change“ zeigen wir, wie Tableau-Teams aus den Bereichen Marketing, Vertrieb, Finanzen etc. Lösungen entwickelt haben, um auf die Krise zu reagieren und unsere Ressourcen besser zu verwalten.

Data
Christine Rietmann created a blog series "Becoming a Tableau Desktop Specialist,” dedicated to documenting her journey to being certified.
COVID-19