Relationships, part 2: Tips and Tricks
Learn tips and tricks for using relationships, new data modeling capabilities in Tableau, for more flexible analysis.


The relationships feature in Tableau 2020.2 introduced new data modeling capabilities, making it easier to combine multiple tables for analysis. If you haven’t already, read our previous post to get an introduction to relationships. We covered two types of new semantics—rules that Tableau follows—to combine data from multiple related tables:
- Smart Aggregations: Measures automatically aggregate to the level of detail of their source (pre-join) table. This differs from joins, where measures forget their source and adopt the level of detail of the post-join table.
- Contextual Joins: Unmatched values are handled individually per viz, so a single relationship simultaneously supports all join types. The promise of relationships (and what allows you to generate any join type) is that all records from measure tables are always retained.
This post covers tips and tricks for working with relationships. We’ll cover two topics:
- Filters
- Hiding unmatched nulls
- Optimizing performance
- Row-level calculations
- Understanding constants in a multi-table world
- Counting a row in a calculation across tables
A quick note before we dive deeper: The examples that follow are all built on a bookstore dataset. If you’d like to follow along in Tableau Desktop, you can download the workbook here.
Filters
Tip: Unmatched nulls in a viz appear in filters

All books have authors, while only some books are published. An unmatched null appears in the publisher filter for unpublished books.
Trick: Hide “Null” in an interactive filter
You may want to keep the filter tidy by excluding “Null” as an option in the list, while still including the nulls in your analysis when “All” is selected on the filter. Since a filter inherits its domain from the corresponding viz, you can accomplish this by showing the filter from a sheet that does not have any unmatched nulls.
Tip: Only measures introduce unmatched nulls into filters
A promise of relationships is that unmatched measure values will never be dropped when combining multiple tables. Consequently, adding a measure from another table into a viz can introduce unmatched nulls and therefore cause “Null” to appear in filters.
Adding dimensions from other tables won’t expand the domain of a filter unless show empty rows or columns is on.
Trick: Improve query performance of dashboard filters
You can optimise query performance by adding filters to a dashboard from sheets that have no unmatched nulls. A simple way to guarantee this is to show filters from vizzes that don’t combine any tables. This ensures that the query populating the list of values in the filter has no joins.
As an example, if we show the publisher filter from a viz that only has a measure from the Publisher table, there are no joins in the filter domain query.
In contrast, if we show the publisher filter from a viz that has a measure from the Editions table, the filter gets its values from a query that joins Publishers and Editions. Here, the absence of “Null” means that all editions are published, not that the join was culled. Improving the filter’s query performance is therefore achieved by creating the filter from a sheet without a join.
Other ways to optimise filter queries include showing dashboard filters from vizzes where one of the following is true:
- All measures are from the same table as the filtering field, OR
- All measures are from tables whose records exist in the table with the filtering field. (That is, “All Records Match” in the referential integrity settings from the tables with the measures to the table with the filtering field.)
Since the number of worksheets also impacts performance, this nuance could be important for highly complex dashboards.
Row-level calculations
Tip: Constants adopt the level of detail of their calculation
Before relationships, a data source had a single level of detail. All constant calculations had that level of detail. For example SUM(1) returned the total number of records in the table.
In a multi-table data source with relationships, there are many levels of detail. A constant calculation such as SUM(1) has its own level of detail, essentially a single row, and returns “1”.
If a constant is used in a calculation that contains a field, the constant adopts the level of detail of that field’s table.
For example, the following calculation, if summed in the view, counts the number of fiction books (because the genre field is from the Book table).
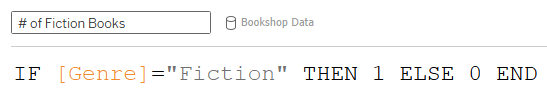
Because the level of detail of this calculation is Book, it is placed accordingly in the Data pane.
Trick: Change the level of detail of a constant with a non-null true condition from a more granular table
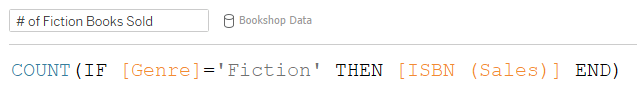
In addition to the # of Fiction Books, suppose we wanted to calculate the # of Fiction Books Sold. While Harry Potter and the Philosopher’s Stone is a single book, it’s sold 120 copies. The cardinality of this relationship is many sales for one book.
We can calculate # of Fiction Books Sold by adding the condition ISBN (Sales) = ISBN (Sales) to the previous calculation.
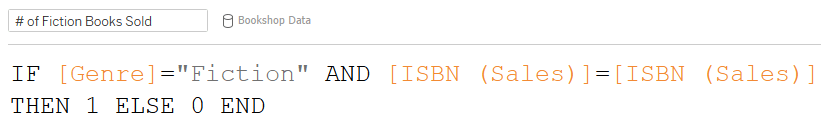
While this condition doesn’t change the value of the column since it is always true, it changes the level of detail of the calculation.
Because of the one-to-many relationship between Books and Sales, the level of detail of the joined table is Sales. Since the constant adopts the level of detail of the joined table, the meaning of “1” changes from a book to a book sold.
Note that cross-table row-level calculations are not grouped with any table in the Data pane.
A row-level calculation across tables generates a row-level join, which can impact performance. Make sure the correct cardinality is set in the Performance Options of the relationship.
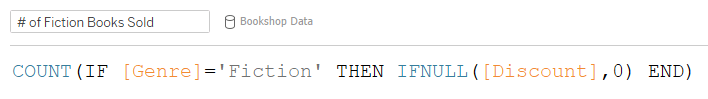
Trick: Simplify the formula by counting a non-null field
An equivalent and simpler calculation for # of Fiction Books Sold is to count a non-null field in the Sales table for all fiction sales.
Since ISBN is a large string field, it may be more efficient to count a non-null numeric field instead.
Tip: Count a row in a higher granularity table with a primary key
In addition to # of Fiction Books Sold, suppose you want to calculate the # of Fiction Authors.
There are many books for one author, so a row-level calculation across Book and Author is at the level of detail of Book.
The previous example uses a count aggregation of any non-null field to count a row in the “many” table of a one-to-many relationship. Counting a row in the “one” table requires a distinct count aggregation on a non-null unique identifier (known as a primary key).
This may sound scary, but don’t worry—it’s identical to the calculation you would write if the tables were joined.
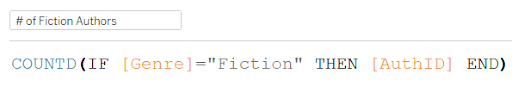
This field must use a COUNTD aggregation since there are multiple books per author. COUNT would count every instance of the author ID, which is the number of fiction books.
Tip: Row-level calculations across tables use inner joins
Suppose you wanted to calculate the number of unpublished books. You may try to calculate this following the same template as the previous calculation, but with a null check condition on Editions. (If the BookID from the Edition table is null, ISNULL will identify that and the nulls will be replaced by the Book ID from the Book table.)
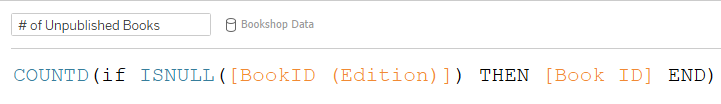
This returns 0 because calculations across tables use inner joins—the upshot of which is that any books without editions are dropped by the inner join—and therefore aren’t present to be counted by this row-level calculation.
Trick: Use an LoD expression to keep unmatched nulls in cross-table calculations
While a row-level calculation across tables doesn’t belong to any table, you can bring a calculation into a specific table with a level of detail expression. This ensures that the calculation has the same set of records as its table, allowing you to preserve unmatched nulls that are dropped in row-level calculations.
Think of the following LoD expression as the Book table reaching into the Edition table to grab the number of editions for each book. If there are no editions for the book, we know that it’s an unpublished book. Because the LoD expression is at the Book level of detail, “1” counts an unpublished book.
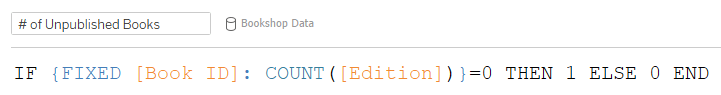
Notice that this calculation is grouped with Book in the Data pane.
Summary
Relationships enable easier analysis across tables with smart aggregations, and more flexible analysis with contextual joins. Internalizing a couple key aspects of relationships will help you understand the tips and tricks shown here so you don’t have to memorize them.
- All records from measure tables are always retained. This can help you optimise the display and performance of filters.
- A row can represent many different things, now that data sources support multiple tables at different levels of detail. This means constants and row level calculations can have multiple levels of detail.
If you’re ready to try relationships, upgrade to Tableau 2020.2 today! If you missed our previous introduction, you can catch up by reading part 1. Stay tuned for the next post on answering questions with relationships.
Zugehörige Storys

Extend Access to Embedded Tableau Content with On-Demand Access
 22 Juli, 2026

The Tableau+ Bundle with Premium AI, Enterprise Capabilities, and Premier Success
 24 Juni, 2026

What is Tableau Prep?
 30 April, 2026