Hello, Tableau community! Welcome to Andy's March round up of the best content being produced by you, the Tableau community.Alle Storys
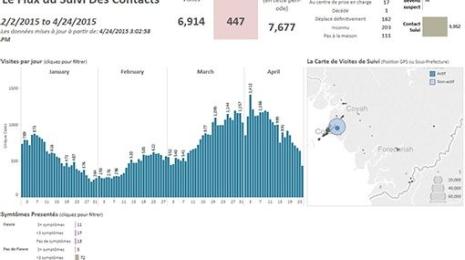
Beispiele für Nachverfolgung und Nutzung von Analytics: Erkenntnisse aus der datengesteuerten Bekämpfung von Ebola und Malaria
 28 April, 2020

What you need to know about COVID-19 data and rural America
 28 April, 2020
Learn how organizations are visualizing and sharing Coronavirus data
 27 April, 2020
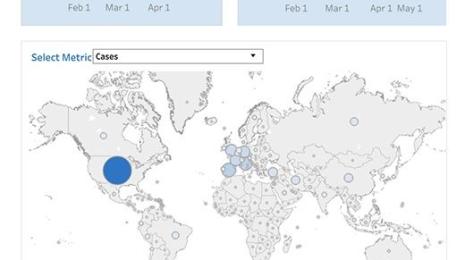
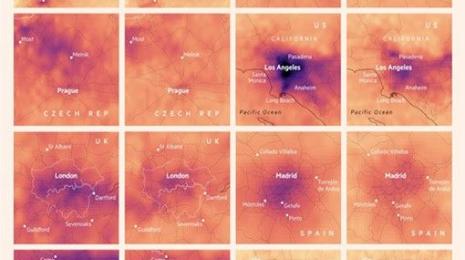
If Data Could Talk: Mapping COVID-19 Data
 24 April, 2020
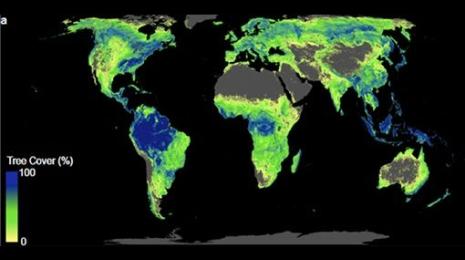
Umweltbewusstes Management wird nach COVID-19 gefragter sein denn je. Hier erfahren Sie, wie Sie sich darauf vorbereiten können.
23 April, 2020
So kann eine Datenkultur in Krisenzeiten verbinden
 23 April, 2020

Best of the Tableau web: Celebrating tips and tricks
 22 April, 2020

More spatial data power in Tableau: Connect to Esri and Oracle
 21 April, 2020
The most interesting data vizzes on COVID-19 we've seen in the media so far
 20 April, 2020
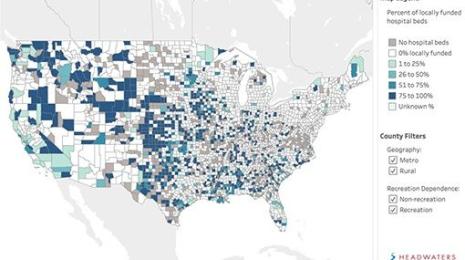
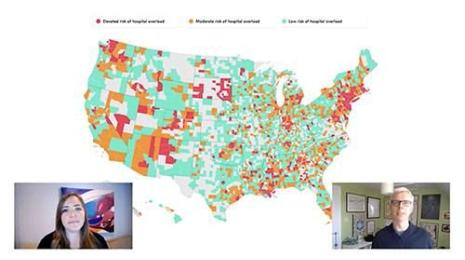
How vulnerable are health care systems in rural recreation communities?
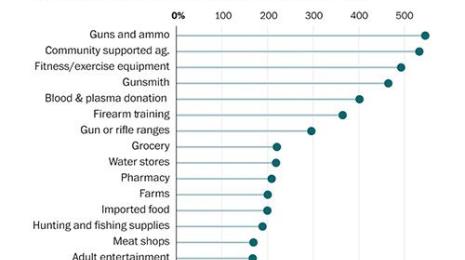
If Data Could Talk: How Covid-19 is transforming consumer patterns
16 April, 2020

IT’s role in shaping a Data Culture: It starts with trust and a people-first mindset
 16 April, 2020
COVID-19
Bei jeder Pandemie beruht die Kontrolle und letztendliche Bekämpfung der Verbreitung solcher Seuchen in erster Linie auf zwei sehr einfachen Gedanken: Jeder mögliche Kontakt mit infizierten Personen soll aufgespürt und die Informationen sollen schneller als die Verbreitung der Erkrankung bereitgestellt werden.
COVID-19
To understand the differences between the way COVID-19 is playing out in rural communities—and how demographics, data collection, and reporting are impacting our understanding of the data—I talked with Bryn Bird MPH, a public health professional with a concentration in epidemiology and rural health policy advocate based in Granville Township, Ohio, where she also serves as a local elected trustee.
COVID-19
As the world attempts to understand the impacts of Coronavirus (COVID-19), publicly sharing data and analysis on a quickly-evolving situation has become an urgent priority for many. Organizations are working as fast as they can to meet an increased need for public communication, transparency, and trustworthy information. Governments specifically have a heightened responsibility to serve as a source of truth. Over the past few months, many organizations and governments have used Tableau Public as a platform for accomplishing this.
Data Skills
Welcome back to another recap of our livestream series, If Data Could Talk! This episode features co-hosts Andy Cotgreave and Amanda Makulec, along with special guest William Watkins, Senior Solution Engineer at Tableau.
COVID-19
In nur wenigen Monaten hat COVID-19 die Welt verändert. Während das neuartige Coronavirus sich ausbreitete, blieben die Menschen zuhause und übten sich in Social Distancing, während zahlreiche Geschäfte den Betrieb einstellten und die Weltwirtschaft zum Stillstand kam.
COVID-19
In einer Krise sind Daten eine wichtige Ressource, um die nächsten Schritte bezüglich der Geschäftstätigkeiten zu bestimmen. Doch der entscheidende Faktor sind die Menschen, die die Daten analysieren und Ihre Reaktion Gestalt annehmen lassen. Jackie Yeaney, EVP of Marketing bei Tableau, zeigt Ihnen anhand der Ergebnisse einer aktuellen IDC-Marktstudie, wie Sie in Krisenzeiten Menschen mit Daten zusammenführen können.
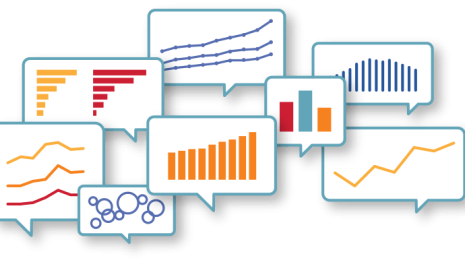
Best of Tableau Web
Product
Tableau 2020.2 brings geospatial data analysis enhancements—connect to Esri ArcGIS Server/Online feature data, plus native support for spatial data from Oracle.
COVID-19
The spread of COVID-19 around the world has set off a spike of interest in data visualizations. Everyone wants to see and understand how case counts are rising, what kind of impact the virus might have on themselves and their community, and what role they can play in slowing the spread.
COVID-19
17 April, 2020
In mid-March, the outlines of the risks from COVID-19—uncertain just days earlier—became starkly clear as thousands of tourists descended on the recreation hub that is Moab, Utah. The community has only three critical care beds and visitors were flocking from metro areas and Colorado resorts where clusters of infections had already appeared.
Data Skills
Welcome back to another recap of our livestream series, If Data Could Talk! Each episode, data experts from the community share resources you can read, watch, or listen to around the topic of data literacy. This episode features co-hosts Andy Cotgreave and Amanda Makulec, along with special guest Chantilly Jaggernauth, VP of Visualization and Training at Lovelytics.
Data
Learn how IT can leverage and enable the change to a Data Culture within an organization. Trust in the data and a change in mindset around how people work with information and disseminate it to others.