
Tableau Ambassadors
Community Leaders who create opportunities for connection, growth, and inspiration
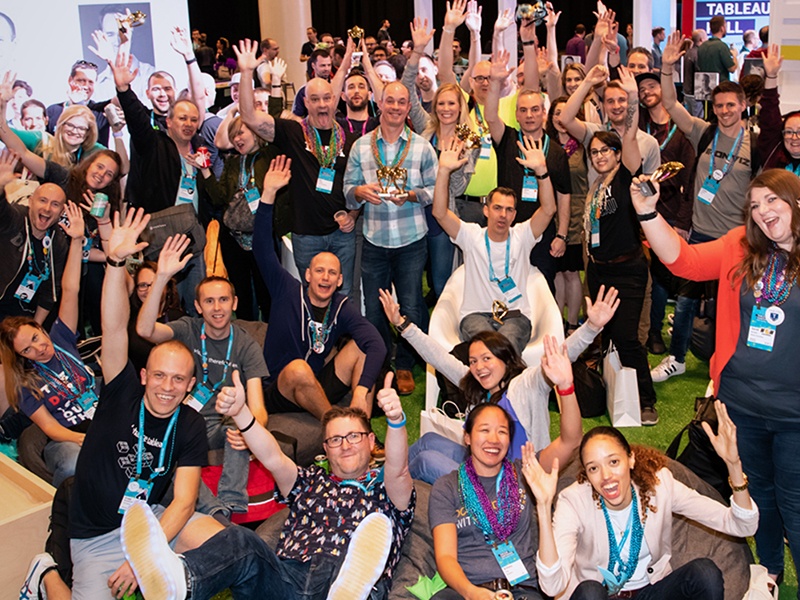
RAVI MISTRY, TABLEAU PUBLIC AMBASSADOR
Tableau Ambassadors embody the spirit of the community
Tableau Ambassadors teach and share while fostering a positive and supportive space within the community. They give credit where credit is due, and prioritize inclusivity in everything they do. They shine the spotlight on new voices, innovative ideas, and make the communities around them better. Tableau Ambassadors include leaders from across in the DataFam, including CRM Analytics, DataDev, Students, and Teachers.
What it takes to be a Tableau Ambassador
Lead and evangelize with kindness and respect
Engage with others and highlight diverse voices and perspectives.
Nurture creative and technical growth
Lead by example and teach by your actions.
Be accessible and amplify connection
Encourage inclusive behavior within the community.
BECOME A TABLEAU AMBASSADOR
2026 Tableau Ambassador Applications and Nominations are closed. Sign up to be notified when applications open again in 2027.
Sign up
The 2026-2027 Tableau Ambassadors include 357 individuals, representing 48 countries, and 4 global regions.

Abdelaziz Mahjoub
Opens in a new window Opens in a new window Opens in a new window
Social Accounts
Slack ProfileOpens in a new window Tableau PublicOpens in a new window LinkedInOpens in a new window
Languages
Arabic, English
Talk to me about...
- Data Visualization Principles of Design and Best Practices
- anything Tableau
- Viz Extensions
Abdelaziz is a 5x Tableau Ambassador, the first selected from MENA region, and the founder of KLIMN, a Tableau practice and partner. Across nearly a decade of enterprise BI delivery, he has designed dashboards that teams adopt and return to daily, including one that has passed 20k internal views. Through KLIMN, he builds Tableau extensions engineered from the ground up to flow right-to-left, something native charts do not do, with Arabic and Hijri calendar support. He leads Cairo Tableau User Group and has trained, mentored, and guided more than 1,000 professionals around the world.

Abhinav Garg
Social Accounts
Languages
English, Hindi
Talk to me about...
- Tableau Next
- AI in CRM Analytics
- CRM Analytics Future Roadmap
I'm a Salesforce CRM Analytics Architect with 14+ years of experience designing dashboards, Recipes, and integrating external data sources like Snowflake and BigQuery. Five Salesforce certifications and 14+ projects later, I still specialise in the same thing: turning complex, messy requirements into insights people can actually act on. Outside of client work, I mentor young professionals stepping into the field and enjoy chasing data-driven solutions for everyday problems. Great data architecture lays the foundation. Impactful visualization tells the story. I like building both.

Ada Xu
Social Accounts
LinkedInOpens in a new window TrailblazerOpens in a new window BlogOpens in a new window
Languages
Chinese, English
Talk to me about...
- Analytics (TabNext, Data 360, Agentforce)
- Fitness & Health
- Travel
Technology keeps changing, and AI is accelerating the pace. That’s what makes this such an exciting time to work with CRM Analytics: new possibilities keep emerging, but the real value still comes from how we use them. I’ve spent years designing data experiences—asking the question behind the requirement, finding the story hidden in the numbers, and turning it into something people can use. Now a four-time CRM Analytics Ambassador, I’m exploring where analytics, AI, creativity, and human judgment meet. Still asking too many questions—and convinced the best work starts with a good one.

Adrian Zinovei
Opens in a new window Opens in a new window
Social Accounts
Tableau PublicOpens in a new window LinkedInOpens in a new window TrailblazerOpens in a new window
Languages
English, French, Romanian, Russian
Talk to me about...
- Business Dashboards
- Tableau Next
- Agentic Analytics
Adrian Zinovei is a Tableau Visionary and long-time Tableau Ambassador with more than 20 years of experience in BI and analytics. He is passionate about data visualization, Tableau, AI, and helping the community turn data into meaningful insights. Adrian is also a Toronto Tableau User Group co-leader, speaker, and active contributor to the global Tableau community.

Agata Ketterick
Opens in a new window Opens in a new window Opens in a new window
Social Accounts
Slack ProfileOpens in a new window Tableau PublicOpens in a new window LinkedInOpens in a new window
Languages
English
Talk to me about...
- User experience and design
- Community projects and portfolio building
- Tableau calculations
Agata Ketterick is a data strategist who came to strategy through a love of data visualization. After years of building dashboards and helping teams communicate with data through Tableau, she now focuses on the bigger picture: connecting data, people, and business priorities to solve the right problems. A 6x Tableau Ambassador and 12x Viz of the Day recipient, Agata has been part of the Tableau community since 2017 and co-leads the Tableau Public and Northern New England Tableau User Groups. She’s passionate about sharing what she’s learned and helping others turn data into action.

Agata Mężyńska
Opens in a new window Opens in a new window Opens in a new window
Social Accounts
Slack ProfileOpens in a new window Tableau PublicOpens in a new window LinkedInOpens in a new window TrailblazerOpens in a new window
Languages
English, German, Polish, Russian
Talk to me about...
- Any Tableau puzzle or challenge
- Data storytelling
- Any complex idea that needs to be explained in simple words
Agata Mężyńska, aka “Wróżka Tableau” (The Tableau Fairy), is a data visualization expert, Tableau consultant and trainer with 9+ years of Tableau experience and over 20 years in data storytelling. Fascinated by color theory, storytelling, and making complex ideas clear and accessible, she combines technical expertise with curiosity and a passion for sharing knowledge. Her career has taken her from journalism and economic analysis to business intelligence. A lifelong learner and avid reader, she also loves playing guitar and, above all, being a wife and mother of two.

Ai Sugiyama(杉山 愛)
Opens in a new window Opens in a new window
Social Accounts
Slack ProfileOpens in a new window Tableau PublicOpens in a new window X ProfileOpens in a new window BlogOpens in a new window
Languages
Japanese
Talk to me about...
- No Datafam, No Life.
- Tableau arts
- DATA Saber
I’ve continued the "#1日1Tableau" challenge (creating daily vizzes) for nearly four years, with over 1,400 creations. While I was once shy and didn't see the value of community, joining it transformed my life. Now, I want to help others experience that same growth. The DATA Saber program especially changed my life, so I actively create opportunities to spread it—aiming for 10,000 Sabers by 2030. I'm also passionate about boosting our newly revamped "Japan Tableau Community Star" to spotlight contributors and empower more Datafam.

Ai Takano
Opens in a new window Opens in a new window
Social Accounts
Tableau PublicOpens in a new window LinkedInOpens in a new window X ProfileOpens in a new window
Languages
English, Japanese
Talk to me about...
- Tableau Prep
Ai Takano has been using Tableau for four years and became a DATA Saber in 2023 through Chubu-Connect, a regional initiative to promote data culture in central Japan. Through active engagement with the Tableau Community, Ai has gained knowledge and skills not available internally at her company. Discovering the power of Tableau Prep greatly expanded her ability to leverage data, and she believes data preparation will be an essential skill in the age of AI. She is passionate about sharing the value and joy of data preparation with others.

Ajay Vishnu Addala
Opens in a new window Opens in a new window Opens in a new window
Social Accounts
Slack ProfileOpens in a new window Tableau PublicOpens in a new window LinkedInOpens in a new window TrailblazerOpens in a new window GithubOpens in a new window X ProfileOpens in a new window YouTubeOpens in a new window
Languages
English, Hindi, Telugu
Talk to me about...
- Dashboard Design & UI/UX
- Tableau Next & AI
- Tableau Community & Public Speaking
I love all things data, design, and Tableau! I’m happiest when I’m sketching dashboard ideas, experimenting with new ways to tell stories with data, or geeking out over a cool viz. The Tableau Community has been a huge part of my journey, from co-leading the Philadelphia TUG to speaking, learning, and making friends across the DataFam. Outside of data, you’ll probably find me talking football, traveling, hiking, or sketching!

Akane Okamoto
Opens in a new window Opens in a new window
Social Accounts
Slack ProfileOpens in a new window Tableau PublicOpens in a new window X ProfileOpens in a new window BlogOpens in a new window
Languages
Japanese
Talk to me about...
- Design
- Storytelling
- Art
Akane works in business development at a telecom group company. Earning Japan's DATA Saber certification in March 2024 sparked her passion for Tableau as a BI tool. She grows her skills through challenges like Workout Wednesday, Makeover Monday, and Back to Viz Basics, sharing Workout Wednesday walkthroughs on her blog "#私の場合" to support newcomers. She enters numerous viz contests to spread the joy and depth of data visualization, and organizes in-person meetups as a Kansai Tableau User Group (KTUG) leader, valuing real-world community connection.

Alex Waleczek
Opens in a new window Opens in a new window Opens in a new window
Social Accounts
Slack ProfileOpens in a new window Tableau PublicOpens in a new window LinkedInOpens in a new window TrailblazerOpens in a new window BlogOpens in a new window
Languages
English, German
Talk to me about...
- Lego
- Bouldering
- Data Engineering
Alex started using Tableau in 2015 after moving to New Zealand and quickly realised the potential for it to be more than just an enterprise reporting tool. Since then, Alex has been part of the Tableau community, hosting the Auckland TUG for 10 years, running community projects and organising virtual and in-person events. These days he works as a freelance consultant, helping businesses to get more value out of their data.

Alice McKnight
Opens in a new window Opens in a new window
Alice McKnight is a analytics consultant, specializing in dashboard development by helping clients turn complex data into practical, actionable insights. She credits the Tableau community in her continuing growth as an analyst.

Alina Cristea
Opens in a new window Opens in a new window Opens in a new window
Social Accounts
Slack ProfileOpens in a new window Tableau PublicOpens in a new window LinkedInOpens in a new window
Languages
English, Romanian
Talk to me about...
- gathering requirements
- guided analytics
- building an internal Tableau community
Alina is the Analytics Lead at Randstad, where she champions analytics best practices and fosters a thriving Tableau creator community. Previously, Alina was an analytics consultant at Tableau, where she discovered her passion for visual analytics and training others. In February 2023, she began co-leading the London TUG. She actively engages with Tableau customers, sharing insights on community involvement and encouraging participation in activities that drive engagement. Outside of work, she enjoys tennis, hiking, and baking.

Ally W
Opens in a new window Opens in a new window Opens in a new window
Social Accounts
Slack ProfileOpens in a new window Tableau PublicOpens in a new window LinkedInOpens in a new window X ProfileOpens in a new window
Languages
English
Talk to me about...
- Design
- Community building
- Collaboration
Allison Wright has been a part of the #DataFam since 2020. She graduated from the Millennials and Data program (#MAD4), is a former "Tableau Public Featured Author", was a member of the 2022 "Tableau Next" cohort and is a co-moderator for "Women in Dataviz". She continues to advocate for inclusivity and representation in the greater data community.

Amy Wu
Opens in a new window Opens in a new window
Social Accounts
Tableau PublicOpens in a new window LinkedInOpens in a new window X ProfileOpens in a new window
Languages
English
Talk to me about...
- Coding
- Co-leading User Groups
- Co-leading a Community Group
Amy Wu is a data geek whose favorite toy was a Little Professor calculator. These days, Amy works as a Performance Specialist at JLL, helping companies turn their vision into compelling dashboards and make data-driven decisions. Amy is a 4x Tableau Ambassador. She is a 2x Viz of the Day recipient and achieved JLL Tableau Rockstar status. Amy also co-founded Eduvizzers, a community data group committed to transforming educational datasets into outstanding visualizations. In her spare time, she enjoys kayaking, taking daily walks with her husband, and travelling internationally.

Anastasiya Kuznetsova
Opens in a new window Opens in a new window Opens in a new window
Social Accounts
Slack ProfileOpens in a new window Tableau PublicOpens in a new window LinkedInOpens in a new window X ProfileOpens in a new window BlogOpens in a new window
Languages
English, Russian
Talk to me about...
- BI Governance
- Data Visualization
- Formula 1
I’m a BI Team Lead and Data Visualization Specialist with over eight years of experience. I’ve built more than 400 dashboards and taught data visualization to over 10,000 students through open and university courses. I currently lead BI at Nebius, driving Tableau strategy, governance, and company-wide adoption.

Andrés Quiroz
Opens in a new window Opens in a new window Opens in a new window
Social Accounts
Slack ProfileOpens in a new window Tableau PublicOpens in a new window LinkedInOpens in a new window GithubOpens in a new window YouTubeOpens in a new window
Languages
Spanish
Talk to me about...
- Tableau Prep (calculated fields & automation for macOS & Windows)
- SQL Queries with PostgreSQL
- Tableau Desktop & Dashboard Design
Andrés is a Data Expert at the Regional Governments & Municipalities Division of the Office of the Comptroller General of Chile. Specialized in Tableau and SQL Server, he drives data culture within the community. Beyond data, he is a football fan who collects jerseys, loves grilling, and enjoys spending time with his dog, Queency.

Andy Holt
Opens in a new window Opens in a new window Opens in a new window
Social Accounts
Slack ProfileOpens in a new window Tableau PublicOpens in a new window LinkedInOpens in a new window TrailblazerOpens in a new window
Languages
English
Talk to me about...
- Data Visualisation Best Practise
- Parameters
- Dashboard interactivity
I’ve been using Tableau since around 2010 or 2011, starting with v6 or v7, and have worked both in-house and as a consultant across a wide range of industries. I’m passionate about using Tableau to turn complexity into clarity, designing purposeful solutions that help people make better decisions more efficiently. I also love sharing what I’ve learned through User Groups, industry events and mentoring, helping others build their Tableau skills and confidence. I was previously an Accredited Trainer, teaching Desktop I & II, and enjoy finding ways to make complex concepts accessible.

Andy Kriebel
Opens in a new window Opens in a new window
Social Accounts
Tableau PublicOpens in a new window LinkedInOpens in a new window YouTubeOpens in a new window BlogOpens in a new window
Languages
English, German
Talk to me about...
- calculations
- Map layers
- containers
Andy Kriebel is the founder of Next-Level Tableau, the world's premier Tableau training membership. He's a data visualization expert, master trainer, one of DataIQ's Top 100 Most Influential People in Data and a member of the Tableau Visionary Hall of Fame. Over the last 2 decades, Andy has helped thousands of people develop great careers in data by sharing tips, tricks, and insights on data visualization, data analysis and Tableau on his YouTube channel, blog, and LinkedIn. 10 of Andy’s trainees have gone on to become Tableau Visionaries, the highest distinction a Tableau user can receive.

Angela Henderson
Opens in a new window Opens in a new window Opens in a new window
Social Accounts
Slack ProfileOpens in a new window Tableau PublicOpens in a new window LinkedInOpens in a new window TrailblazerOpens in a new window
Languages
English
Talk to me about...
- Mentoring others on bridging the gap between messy business problems and clean dashboard design.
- Relaunching and scaling user groups to build a more engaged data community.
- Empowering career switchers and beginners with the confidence and data literacy needed to thrive.
I’m a data leader who loves turning messy business problems into clear, intuitive Tableau experiences. My design style uses shapes, interactivity, dynamic labels, intentional layout, and guided visual cues to make the story easier to follow for each stakeholder: what’s happening, why it matters, and what to do next. I’m passionate about mentoring beginners and career switchers, building community, and helping people feel more confident using data to solve real problems. For me, great dashboards should feel less like static reports and more like experiences that guide people toward action.

Anirudh
Opens in a new window Opens in a new window
Social Accounts
Slack ProfileOpens in a new window LinkedInOpens in a new window GithubOpens in a new window
Languages
Dutch, English, Hindi, Tamil
Talk to me about...
- Tableau extensions
- Tableau APIs
- LLMs, Machine learning, Tableau next
Anirudh Somadas is a Developer at Apps for Tableau, with a passion for data visualisation, analytics, and exploring new technology. His current work focuses on Tableau, AI etc., where he enjoys experimenting with new ways to make data more accessible, interactive, and engaging. He loves learning, building, and sharing ideas with the Tableau community, and is always curious about how technology can create better data experiences. He is also interested in maps, geospatial data, and satellite image processing. Outside of data and AI, Anirudh enjoys cycling and travelling

Ankur Napa
Opens in a new window Opens in a new window Opens in a new window
Social Accounts
Slack ProfileOpens in a new window Tableau PublicOpens in a new window LinkedInOpens in a new window GithubOpens in a new window YouTubeOpens in a new window
Languages
English, German, Hindi, Punjabi, Urdu
Talk to me about...
- Gen AI + Tableau
- Tableau Server
- Tableau Prep
A Beer Brewer turned data and AI/GenAI professional who’s driving digital transformation across the beer, food, and beverage industry. With the precision of a brewer and the mindset of a data engineer, Ankur blends Tableau, Azure, and Generative AI to turn complex operational data into meaningful insights. His work helps breweries and F&B brands become more sustainable, efficient, and truly data-driven. Also co-lead of the Bangalore Tableau User Group and the Newbie Tableau User Group, fostering data community growth and lea

Ann Pregler
Opens in a new window Opens in a new window
Social Accounts
Tableau PublicOpens in a new window LinkedInOpens in a new window BlogOpens in a new window
Languages
English
Talk to me about...
- Data Viz Design
- Dynamic Zone Visibility
- Iron Viz
Ann Pregler is a Tableau Ambassador and 2026 Iron Viz Champion. She works as a Senior Data Analyst at BECU, where she uses data to improve the experiences of colleagues and members. She specializes in building Tableau visualizations that transform complex data into clear insights. Her favorite part of data visualization is untangling messy datasets and creating practical, intuitive tools that help people understand what’s happening and make better decisions.

Ann Stolzman
Opens in a new window Opens in a new window Opens in a new window
Social Accounts
Slack ProfileOpens in a new window Tableau PublicOpens in a new window LinkedInOpens in a new window TrailblazerOpens in a new window X ProfileOpens in a new window
Languages
English
Talk to me about...
- What do YOU want to talk about?
- Data & Analytics
- Map Layers
I've been using Tableau for over 13 years, at work & for fun, & I continue to evangelize the use of data visualization overall, & help people upskill in Tableau. With Tableau (and other viz tools), I have visualized corporate sales strategy, cybersecurity, licensing, and automotive service operations as it relates to customers and demand. There are no limits! I love delivering valuable insights to those who need it, mentoring those who want to learn data visualization, effective design, methods of ensuring data is accessible to everyone who needs it, and bringing women in data together

Anna Clara Gatti
Opens in a new window Opens in a new window Opens in a new window
Social Accounts
Slack ProfileOpens in a new window Tableau PublicOpens in a new window LinkedInOpens in a new window
Languages
English, Italian
Talk to me about...
- Dashboard Design
- Data Art
- Food & Cooking
Anna Clara Gatti is a data analyst specializing in visualization at Lightcast, where she works with labour market and skills data, turning complex datasets into clear and engaging visualizations. With a background in demographic and social statistics, she is fascinated by how data can reveal something about people, work, and society. Tableau and the #DataFam have been part of her journey for many years, inspiring her to explore these themes, learn from others, experiment with new ways to look at data, and find the visual approach that makes a story click, sometimes in unexpected ways.

Annabelle Rincon
Opens in a new window Opens in a new window
Social Accounts
Tableau PublicOpens in a new window LinkedInOpens in a new window TrailblazerOpens in a new window YouTubeOpens in a new window BlogOpens in a new window
Languages
English, French, German, Spanish
Talk to me about...
- Tableau Desktop
- Tableau Server
- Enablement
Annabelle Rincon is a data and analytics leader with 15+ years of experience driving data-driven transformation and leading international teams. A long-standing member of the Tableau community, she is a multiple-time Tableau Visionary and Ambassador, and co-leads the Analytics Tableau User Group. She is passionate about making data more accessible, engaging, and useful—and helping the people working with it thrive.

Ansula Jain
Opens in a new window Opens in a new window
Social Accounts
Tableau PublicOpens in a new window LinkedInOpens in a new window X ProfileOpens in a new window YouTubeOpens in a new window
Languages
English, Gujarati, Hindi
Talk to me about...
- Tableau + AI
- Tableau LOD and calculations and how to create charts
- Tableau server + integration with Salesforce
Hey Data vizard I am someone who loves raw numbers and turns them into meaningful stories through powerful dashboards. With over a 13+years of experience in data visualization, I specialize in turning complex business problems into opportunities by crafting insightful, user-friendly solutions that empower decision-making. With AI all around I am focused on navigating how AI will transform Data Viz. I also run a YouTube channel called Techianshi, where I share tutorials, tips, and strategies around data visualization, helping professionals and data enthusiasts. Connect with Me

Anubha Gupta
Opens in a new window Opens in a new window
Social Accounts
Tableau PublicOpens in a new window LinkedInOpens in a new window TrailblazerOpens in a new window
Languages
English, Hindi
Talk to me about...
- New features in Tableau
- Map Layers
- How to handle big data in tableau dashboards
Senior Tableau Developer and Data Consultant with 18+ years in BI and analytics across financial services, telecom, and real estate. Started as a Reporting Analyst rebuilding the same Excel reports every week, then found Tableau and never looked back — building dashboards people could explore themselves instead of waiting on me. That shift, from producing reports to building tools, has shaped my career, including some consulting along the way. Outside work I read, paint, cook, tend houseplants, and dabble in crafts — the same instinct of turning something raw into something worth sharing.

Arshi Saleh
Opens in a new window Opens in a new window Opens in a new window
Social Accounts
Slack ProfileOpens in a new window Tableau PublicOpens in a new window LinkedInOpens in a new window
Languages
English, Hindi
Talk to me about...
- Tableau spatial functions
- Tableau Tips & Tricks
- Dashboard Design
Arshi is a Freelance Tableau Developer and Data Visual Designer based in Mumbai, India. She started her Tableau journey in 2021, has received two #VOTDs and won the second place in the Women in Analytics Data Visualization Competition (2025). She is a co-lead for Bengaluru Tableau User Group and Community & Events Coordinator for DVS Geospatial Interest Group. She loves using storytelling as a medium to share social issues and start conversations for change.

Arty Smith
Opens in a new window Opens in a new window
Arty Smith is an AP Statistics and Data Science teacher at Kent Denver School, where he helps students use data to investigate meaningful real-world questions and tell compelling stories. A three-time Tableau Ambassador, Arty uses Tableau extensively in the classroom, empowering students to explore complex datasets, build engaging visualizations, and communicate insights to authentic audiences. He is also the founder of the Gambling Awareness Initiative, where he uses data and visualization to help young people better understand risk and probability.

Bill Chen
Opens in a new window Opens in a new window Opens in a new window
Social Accounts
Slack ProfileOpens in a new window Tableau PublicOpens in a new window LinkedInOpens in a new window X ProfileOpens in a new window
Languages
Chinese, English
Talk to me about...
- Business Optimization
- Data Visualization & Tableau
- Aviation & Flight Operations
I lead Cruise Performance within EVA Air’s Flight Operations Division, using data visualization to turn complex aviation data into insights for business optimization and better decisions. Within my organization, I drive Tableau training and promote self-service analytics and practical AI adoption. Beyond work, I co-founded and co-lead the Taiwan Tableau User Group, co-authored two books on Tableau and data analytics, and speak and mentor across professional communities, university clubs, and businesses. As a Tableau Ambassador, I enjoy helping others discover new possibilities through data.

Blake Feiza
Opens in a new window Opens in a new window Opens in a new window
Social Accounts
Slack ProfileOpens in a new window Tableau PublicOpens in a new window LinkedInOpens in a new window GithubOpens in a new window X ProfileOpens in a new window YouTubeOpens in a new window BlogOpens in a new window
Languages
English
Talk to me about...
- Tableau Map Layer Hacks
- Data Art
- Running/Music/Video Games
Blake Feiza works in BI at a tech company and is based in Austin, Texas, where Tableau carries most of his day. He co-leads the Retail & Consumer Goods Tableau User Group, co-leads the Makeover Monday project and hosts weekly Makeover Monday livestreams, and at TC26 he led Makeover Monday Live and presented on Map Layers. He also writes at Feiza Data, an all-things-data blog he runs with his brother Ethan, showing how things get built instead of just what got built. Tableau taught him the community is the best part of the tool.

Bo McCready
Opens in a new window Opens in a new window Opens in a new window
Social Accounts
Slack ProfileOpens in a new window Tableau PublicOpens in a new window LinkedInOpens in a new window X ProfileOpens in a new window BlogOpens in a new window
Languages
English
Bo is a Tableau Visionary, Iron Viz champion, and data scientist based in Austin, TX. Bo earned his Ph.D. from the University of Wisconsin and worked in urban education, most recently as Director of Research and Director of Analytics for two large school districts, before transitioning to the technology sector. He has been using Tableau since 2012 and has received Viz of the Day on Tableau Public 15 times. He and his wife operate Pie Chart Press, a small independent screen printing operation where they design and hand-screen shirts and posters.

Brad Fair
Opens in a new window Opens in a new window
Social Accounts
Slack ProfileOpens in a new window LinkedInOpens in a new window GithubOpens in a new window BlogOpens in a new window
Languages
English
Talk to me about...
- Tableau Server and Cloud
- DataDev and APIs
- AI and Agents
Brad Fair is the Principal Solutions Architect at High Performance Technologies, where he helps companies strengthen their analytics infrastructure through managed services, support, and migration projects. A longtime contributor to the Tableau development community, he builds tools that make Tableau easier, faster, and more scalable—efforts that even influenced the development of Tableau’s Resource Monitoring Tool. Guided by a simple philosophy that technology should make people’s lives easier, not harder, Brad is always ready to lend a hand.

Brandon Ohlaug
Opens in a new window Opens in a new window Opens in a new window
Social Accounts
Slack ProfileOpens in a new window Tableau PublicOpens in a new window LinkedInOpens in a new window TrailblazerOpens in a new window
Languages
English
Talk to me about...
- Community and Learning
- Tableau and AI
Brandon is passionate about helping people amplify their data and analytics skills. He believes learning should be fun and brings this to life by creating engaging programs while leading his company’s Tableau Center of Excellence. Born and raised in Iowa, Brandon started a local TUG and later launched the Automotive TUG. He has taught data visualization at the University of Iowa. He’s spoken at the Tableau Conference in 2024 and 2025. Brandon enjoys mentoring others in the community and when he is not having fun with data, he enjoys being outdoors with his wife, three kids, and dog.

Brian Moore
Opens in a new window Opens in a new window
Social Accounts
Tableau PublicOpens in a new window LinkedInOpens in a new window X ProfileOpens in a new window BlogOpens in a new window
Languages
English
Talk to me about...
- Tableau Public
- Tableau Desktop
- Tableau Prep
Brian is a Data Visualization & Analytics Practice Manager at Cleartelligence, Inc. in Boston, Massachusetts. He is a self-proclaimed Tableau fanatic, and when he is not helping his clients get the most out of their data with Tableau, he is having fun on Tableau Public building unique visualizations. He is also active in the Tableau Community, co-leading the Boston TUG, blogging on his website, domoorewithdata.com, and teaching/mentoring newcomers to Tableau.

Brittany Rosenau
Opens in a new window Opens in a new window Opens in a new window
Social Accounts
Slack ProfileOpens in a new window Tableau PublicOpens in a new window LinkedInOpens in a new window TrailblazerOpens in a new window GithubOpens in a new window BlogOpens in a new window
Languages
English
Talk to me about...
- Tableau Public
- Community Projects
- IdeaExchange
Brittany is a design enthusiast who believes everyone is better with equitable access to data. She was introduced to Tableau Public through an internal enablement program in 2019 and has been hooked ever since. Brittany is a serial dabbler in community projects, 12 time Viz of the Day recipient, and was a finalist in the 2023 Iron Viz competition. When she’s not vizzing, Brittany enjoys reading, movies, concerts, taking care of her aquariums and growing plant collection, and traveling.

Bryce Larsen
Opens in a new window Opens in a new window Opens in a new window
Social Accounts
Slack ProfileOpens in a new window Tableau PublicOpens in a new window LinkedInOpens in a new window GithubOpens in a new window
Languages
English
Talk to me about...
- Automation & APIs
- AI & MCPs
- Table Calculations
Bryce is a 6x Tableau Ambassador and Analytics Engineer at Apple, where he builds scalable data models and manages the infrastructure for his team to share data products. He is passionate about automation, documentation, and finding practical ways to leverage GenAI to make engineering more efficient. Based in the SF Bay Area, Bryce enjoys bridging engineering best practices with visualization, spending time with his family, and supporting Arsenal FC.

Budi Lubis
Opens in a new window Opens in a new window Opens in a new window
Social Accounts
Slack ProfileOpens in a new window Tableau PublicOpens in a new window LinkedInOpens in a new window TrailblazerOpens in a new window
Languages
English
Talk to me about...
- How Tableau and AI can be leveraged to make business decisions
- Basketball & Scuba diving
- Travel
Budi is a seasoned global business leader passionate about democratizing data in healthcare and turning it into actionable insights that help organizations make impactful change. Having lived and led businesses in 8 countries, he appreciates the power of diverse perspectives. Starts his day in the "unanswered questions" section with a cup of coffee ☺ to help others solve real-world business challenges. For fun, Budi and family love to travel; and aim to conquer 1-2 new countries every year. There’s always another place to explore, a new culture to experience, and a local dish to try!!

Candice Munroe
Languages
English
Candi is a passionate advocate for data-driven decision-making with a deep expertise in visual analytics. With a strong foundation in Tableau, she has earned multiple certifications, including Tableau Desktop Certified Associate, Tableau Certified Associate Consultant, and is currently an Einstein Prediction Builder Accredited Professional, Salesforce Certified Data Cloud Consultant, and a Trailhead Ranger. Candi has helped numerous organizations enhance their visual analytics capabilities, driving better business decisions across diverse industries. As a leader in the data community, she serves as the head of the Canada Tableau User Group and a co-leader of the Datafam Career Pathmaker Tableau User Group. A five-time Tableau User Group Ambassador from 2021 to the present, Candi is dedicated to sharing knowledge and empowering others in their data journey. Her true passion lies in working closely with clients to bring their data stories to life.

Caroline Swiger
Opens in a new window Opens in a new window Opens in a new window
Social Accounts
Slack ProfileOpens in a new window Tableau PublicOpens in a new window LinkedInOpens in a new window X ProfileOpens in a new window
Talk to me about...
- Skill-Building Through Community Challenges
- Dashboard UI/UX
- Designing for Executive & Business Audiences
Caroline is a Senior Manager of Analytics & Insights Lead at TD Bank, where she uses data visualization to make complex information easier to understand and act on. She discovered the Tableau Community during virtual TC21, created a Twitter account that night, and the rest is history. Since then, she has published 225+ visualizations on Tableau Public and found a particular love for community challenges, thoughtful dashboard design, and finding better ways to communicate data. Outside of data viz, she can usually be found running, reading, or wrangling four kids.

Cathy Bledsoe
Opens in a new window Opens in a new window
Social Accounts
Tableau PublicOpens in a new window LinkedInOpens in a new window
Languages
English
Talk to me about...
- Starting a business
- Science fiction books
- Literally anything
Cathy has been using Tableau since 2014 to build data tools for a variety of public health purposes. From cancer to cardiovascular disease to COVID, she has combined her background in Epidemiology with her love of Tableau to create tools that help people make their communities healthier. In 2017, she started a data consulting company focused on improving data use in health departments around the US. In her spare time, she ravenously consumes books and podcasts, competes on a trivia team, and enjoys exploring new places with her husband and their friends.

Cathy Young
Opens in a new window Opens in a new window Opens in a new window
Social Accounts
Slack ProfileOpens in a new window Tableau PublicOpens in a new window LinkedInOpens in a new window TrailblazerOpens in a new window GithubOpens in a new window YouTubeOpens in a new window BlogOpens in a new window PodcastOpens in a new window
Languages
English
Talk to me about...
- I’m exploring how to record the why behind data—the business rules, strategic reasoning, and human decisions that give data actual meaning beyond basic metadata.
- Always up for a discussion about funny and sweet dogs—especially my two Goldens, affectionately known as the overlords of the house.
- Recently my husband and I tackled Tai Chi, and my first stained glass project is officially decorating the window in one piece.
I'm fascinated by moments when the world pivots—watching the monumental leaps in technology that alter the way our lives work and mapping out ways forward. My passion for bringing order to complex ideas led me to write the books Tableau at Work and Python Coding, host The Plain Text of AI podcast, and create TableauatWork.com and IfThenWhy.ai. I love tackling new things and learning, whether that’s mastering Tai Chi with my husband, learning how to play the piano in my 40s, or crafting a stained glass project that officially made it into the window in one piece.

Celia Fryar
Austin Tableau User GroupOpens in a new window
Opens in a new window Opens in a new window Opens in a new window
Social Accounts
Slack ProfileOpens in a new window Tableau PublicOpens in a new window LinkedInOpens in a new window TrailblazerOpens in a new window GithubOpens in a new window BlogOpens in a new window
Languages
American Sign Language (ASL), English
Talk to me about...
- AI within Tableau: Tableau+, Tableau Next, Tableau Pulse
- Semantic Modeling and Conversional Analytics
- Dashboarding to Maximize Space and Performance
My Tableau journey began in 2012 as a dashboard consumer and grew into something far more meaningful: a way to teach, mentor, connect, and create opportunities for others. Since 2016, I have helped thousands of adult learners, students, and professionals build practical skills as they pursue new possibilities. Through teaching and community building, I strive to create supportive environments where people can navigate change, recognize their potential, and move from curiosity and uncertainty toward capability, confidence, and renewed optimism about what comes next.

CESAR PICCO
Social Accounts
Tableau PublicOpens in a new window
Languages
English, German, Spanish
Talk to me about...
- AI/ML
- GIS
- Guitar gear
Cesar began his journey with Tableau after building custom coded projects for clients. Which, while effective, lacked the flexibility for clients to update their visualizations dynamically. Tableau provided the perfect solution by allowing teams to easily maintain and refresh their data visualizations. Since then, Cesar has been dedicated to sharing his knowledge, and helping community members see their value within their current roles. For more than a decade, Cesar has intrigued and impressed leadership. “What exactly are you?” they ask. An Analytical Engineer? Data Engineer? Data Scientist?

Charlotte Shearsby
Opens in a new window Opens in a new window Opens in a new window
Social Accounts
Slack ProfileOpens in a new window Tableau PublicOpens in a new window LinkedInOpens in a new window TrailblazerOpens in a new window BlogOpens in a new window
Languages
English
Talk to me about...
- Data Visualisation
- Tableau
- Theatre
I am a freelance data visualisation specialist working in the UK, a 3x Tableau Ambassador, and co-lead for the UK Healthcare Tableau User Group. I speak on data visualisation & Tableau at peer events and educational institutions. Outside of work, I enjoy theatre, the countryside, and equestrian sports.

Chiaki Ishida
Opens in a new window Opens in a new window Opens in a new window
Social Accounts
Slack ProfileOpens in a new window Tableau PublicOpens in a new window LinkedInOpens in a new window TrailblazerOpens in a new window GithubOpens in a new window X ProfileOpens in a new window YouTubeOpens in a new window BlogOpens in a new window
Languages
English, Japanese
Talk to me about...
- Visualization
- Tabieau x AI
- Tableau CoE
Chiaki leads Tableau promotion at her organization, helping colleagues use data to solve business challenges, and is currently exploring what Tableau and AI can do together. She has been working with Tableau since 2018 and is an active member of Japan TUG. She was named a Tableau Ambassador since 2022 and a Tableau Visionary since 2024, and won the first VizGames held in Japan in 2024. Captivated by visual analytics, she designs dashboards that help users turn insight into action, and she also loves creating dashboards that stand on their own as works of art.

Chie Sakaki
Opens in a new window Opens in a new window Opens in a new window
Social Accounts
Slack ProfileOpens in a new window Tableau PublicOpens in a new window LinkedInOpens in a new window X ProfileOpens in a new window
Languages
Japanese
Talk to me about...
- Data Visualization
- Exercise
- Beautiful Things & Design
I’m a BI Analyst and Data Visualization Designer in the financial industry. I’m currently working on a marketing analytics support service, helping businesses make better decisions with data. Outside of work, I co-host VizSpace, a community project within JTUG that explores the connection between data and art. I believe in using data viz to start conversations, inspire creativity, and find new meanings beyond simple analytics.

Chimdi Nwosu
Opens in a new window Opens in a new window
Social Accounts
Tableau PublicOpens in a new window LinkedInOpens in a new window TrailblazerOpens in a new window GithubOpens in a new window X ProfileOpens in a new window YouTubeOpens in a new window BlogOpens in a new window
Languages
English
Talk to me about...
- Design Best Practices + Functional Aesthetics
- Data Models, Semantic Models
- Tableau + AI
Chimdi is a Data Visualization Engineer and Analytics Product Builder based in Burnaby, Canada, with a passion for all things Data + UX. He specializes in turning data into thoughtful products that help people make better decisions. As a recognized member of the global data community, Chimdi helps create spaces where people can learn, share, and grow together within the #DataFam community. Outside of work, he enjoys fitness, music, documentaries, and scenic drives.

Chris Perry
Opens in a new window Opens in a new window
Social Accounts
Slack ProfileOpens in a new window LinkedInOpens in a new window GithubOpens in a new window X ProfileOpens in a new window YouTubeOpens in a new window BlogOpens in a new window
Languages
English
Talk to me about...
- Tableau Desktop, Prep, Server and Cloud
- Tableau REST APIs
- Integrating Tableau with other tools or processes
I discovered Tableau nearly a decade ago while studying business intelligence at UT Dallas. I later served as Tableau Analytics Director at Experian, leading developers and building solutions for an environment supporting 2,700+ users. Today, I’m an Senior AI/ML Engineering Manager, educator, and content creator who continues to teach Tableau best practices and automation. I also share practical SQL education through SQL Short Reads and create Tableau tutorials on YouTube.

Chris Westlake
Opens in a new window Opens in a new window Opens in a new window
Social Accounts
Slack ProfileOpens in a new window Tableau PublicOpens in a new window LinkedInOpens in a new window BlogOpens in a new window
Languages
English
Talk to me about...
- Data Art
- Dynamic Zone Visibility
- AI
Chris has had a passion for data since childhood, and a love for Tableau since discovering it in 2018. Over the past 8 years he has published over 180 vizzes on Tableau Public, earning 10 Viz of the Days. At the 2024 Tableau Conference, Chris was crowned as the Global IronViz champion. Chris has a passion for using his skills to foster collaboration and mentor others. He does this through co-leading the Scotland and Public TUGs, regularly speaking at other data focused events, and sharing his knowledge through his blog WestlakeAnalytics.com

Chris Williams
Opens in a new window Opens in a new window Opens in a new window
Social Accounts
Slack ProfileOpens in a new window Tableau PublicOpens in a new window LinkedInOpens in a new window X ProfileOpens in a new window BlogOpens in a new window
Languages
English
Talk to me about...
- Tableau MCP
- Tableau Next
- LODs
I have spent 16 years making Tableau deliver measurable business outcomes. As founder and CTO of Precision Analytics Group, I lead enterprise analytics transformations for public agencies and large enterprises, building semantic models and agentic analytics in Tableau Next and Salesforce Data Cloud in production. I delivered a Tableau keynote at Dreamforce 2025 and presented on the Tableau MCP at Tableau Conference 2026. I lead the Portland and Black in Data Tableau User Groups and teach Tableau pro bono at Cal State Fullerton and UC Irvine, because the community made me.

Christopher Scott
Opens in a new window Opens in a new window Opens in a new window
Social Accounts
Slack ProfileOpens in a new window Tableau PublicOpens in a new window LinkedInOpens in a new window TrailblazerOpens in a new window X ProfileOpens in a new window
Talk to me about...
- Enablement
- Governance
- Semantic Layers
Christopher Scott is a Director of Data Management, Tableau Ambassador, and longtime community leader with more than 10 years of experience building and supporting data communities. As leader of the Raleigh-Durham Tableau User Group, he is passionate about connecting data professionals, sharing practical knowledge, and helping others grow their analytics skills. His professional focus spans data governance, data quality, data strategy, and analytics enablement, with a mission to make trusted data accessible and impactful for everyone.

Cooper wenhua
Social Accounts
LinkedInOpens in a new window GithubOpens in a new window YouTubeOpens in a new window BlogOpens in a new window
Languages
Chinese, English
Talk to me about...
- ai
My Tableau journey began with its intuitive feel, inspired by Wendy Shijia's artistry and Yupeng Wu's mathematical logic. Years of BI delivery led me to automate repetitive workflows using code and MCP. Sharing on LinkedIn connected me with generous peers. In particular, extensive exchanges with Alex Mou grounded my work in real user needs like template reuse and local replacement. Guidance from Matthew Miller, Adam Mico, David Spezia, Patrick, Kyle, Li-Lun, and Olga shaped my vision. I am deeply thankful to Tableau, this community, and the peers who fueled my inspiration.

Craig Heard
Opens in a new window Opens in a new window
Social Accounts
Tableau PublicOpens in a new window LinkedInOpens in a new window GithubOpens in a new window BlogOpens in a new window
Languages
English
Talk to me about...
- Map Layers
- Design Layout (using containers)
- Advanced Charts
I am a Data Visualization Manager at JPMorgan Chase, a three-time Tableau Viz of the Day winner and a 2026 DataFam Rising Star. Originally from the UK, I moved to the US 16 years ago on a football (soccer) scholarship. Outside of work I'm deep into football and data and recently had an article appear in Significance magazine, following an earlier run writing a weekly Premier League fantasy blog. I am happily married with a nearly-3-year-old son and newborn (1 month old). Off the clock, I'm listening to Biffy Clyro, Fleetwood Mac, Olivia Dean, Jamiroquai and Dave.

Cristian Saavedra Desmoineaux
Opens in a new window Opens in a new window Opens in a new window
Social Accounts
Slack ProfileOpens in a new window Tableau PublicOpens in a new window LinkedInOpens in a new window TrailblazerOpens in a new window GithubOpens in a new window X ProfileOpens in a new window BlogOpens in a new window
Languages
English, Spanish
Talk to me about...
- AI & DataDev
- Tableau Server
- Data 360 & Tableau Next
I am a developer advocate, or, as Warren Thornthwaite used to call me, a data magician with many hats who pushes the daily limits to improve and help make faster and better decisions. My passion as a System Engineer is assisting others to grow. I bring my experience of over 20+ years designing and implementing Data Warehouses and leading Data and Analytics mission-critical projects for Telco, Energy, Mobile Food, and Health Care. Co-Founder of www.datadevquest.com I enjoy playing LEGO, going camping, and sharing as an author at https://cristiansaavedra.medium.com/ You can find me on LinkedIn.

Dan Chissick
Opens in a new window Opens in a new window Opens in a new window
Social Accounts
Slack ProfileOpens in a new window Tableau PublicOpens in a new window LinkedInOpens in a new window TrailblazerOpens in a new window BlogOpens in a new window
Languages
English, Hebrew
Talk to me about...
- Tableau Performance
- Data Modelling for Tableau
- Advanced Calculations
I am the BI Team Leader at Naya Technologies (an Epam Systems company). My education includes a B.A. in Mathematics and an MBA, and I have been practicing Business Intelligence for 30 years. As a Senior Consultant for Naya, a Tableau Partner, I have been developing reports, managing servers, advising, teaching, presenting, and troubleshooting Tableau for 11 years as part of my job, while creating for Tableau Public, answering questions on the Forums, and blogging in my spare time. Any remaining time is divided between 4 children and the sport of orienteering.

Danish Sayyed
Opens in a new window Opens in a new window
Social Accounts
Tableau PublicOpens in a new window LinkedInOpens in a new window GithubOpens in a new window
Languages
English, Hindi, Urdu
Talk to me about...
- Table Calculations
- LOD Functions
- Dashboard designing
The journey began with a curious mind eager to explore the interplay of colors and numbers. Tableau was the perfect answer, seamlessly bridging both worlds. Data has always fascinated me, driving me to analyze diverse domain datasets and build interactive dashboards. What started as creative exploration soon evolved into a core pillar of my everyday workflow, turning complex data into actionable insight.

Danny Bradley
Opens in a new window Opens in a new window Opens in a new window
Social Accounts
Slack ProfileOpens in a new window Tableau PublicOpens in a new window LinkedInOpens in a new window
Languages
English
Talk to me about...
- Adoption
- Desktop
- Data Communities
Danny Bradley is the Senior Data Engagement & Execution Lead at VMO2 and has worked in data for over 14 years. He is passionate about Data Enablement and loves to create programmes which help businesses see and understand data. He lives for making dashboards truly actionable, by helping others with design, storytelling with data and chart choices. He is a British Data Awards winner, public speaker, and DataFam Slam Champion 2024! In his spare time he enjoys spending time with his family, cooking, playing golf, football and paddle boarding!

Dave Woodley
Social Accounts
LinkedInOpens in a new window YouTubeOpens in a new window BlogOpens in a new window
Languages
Spanish
Talk to me about...
- Non-Profit Fundraising Data
- Non-Profit financial data
I’ve spent 25 years in higher education and nonprofit fundraising. The old adage in my industry is “data is the fuel on which fundraising runs”. As such the ability to provide clarity through data visualization is essential. Tableau has been a major part of my life’s work focus. I am the author of “Donorology” a blog specializing in making fundraising data useful.

David Elsner
Opens in a new window Opens in a new window Opens in a new window
Social Accounts
Slack ProfileOpens in a new window Tableau PublicOpens in a new window LinkedInOpens in a new window TrailblazerOpens in a new window X ProfileOpens in a new window YouTubeOpens in a new window BlogOpens in a new window
Languages
English
Talk to me about...
- Teaching Data Visualization & Storytelling with Tableau
- Designing Hands-On Tableau Learning Experiences for Business Students
- Integrating Tableau into Analytics Curriculum, Capstones, and Industry Projects
David Elsner is an Adjunct Professor and the Program Director of the Master of Business Analytics (MBAN) Program at the Schulich School of Business, York University. With more than 25 years of experience in analytics, AI, consulting, and executive education, he teaches data visualization, storytelling, analytics, and project management across graduate, undergraduate, and executive programs. He is also President of DHE Consulting, a firm specializing in consulting, advanced analytics, and AI to identify, analyze, and solve business problems.

David Kelly
Opens in a new window Opens in a new window
Social Accounts
Tableau PublicOpens in a new window LinkedInOpens in a new window GithubOpens in a new window X ProfileOpens in a new window
Talk to me about...
- REST API
- Username migrations
- Metadata extraction
I’ve been an avid Tableau user for work and fun for over a decade. In my personal use I have fun making nerdy dashboards on topics like Doctor Who, the Simpsons, and Lord of the Rings. At work I admin our site and have been focusing on metadata extraction and Tableau adoption. I’ve really dug into all the APIs and using Snowflake as other backend to make insights easier and more manageable. When not at my computer for work I do enjoy video games (PC, XBox, GameBoy) and devour books (sci-fi and fantasy). My current guilty book reads? Dungeon Crawler Carl

David Liska
Opens in a new window Opens in a new window Opens in a new window
Social Accounts
Slack ProfileOpens in a new window Tableau PublicOpens in a new window LinkedInOpens in a new window
Languages
English
Talk to me about...
- Data Visualization Metaphors
- UX Design
- Video Game Music
David first started using Tableau in 2014 after selecting it as his department's analytics tool of choice, and has enjoyed it ever since. He works as a Senior Data Visualization Analyst at SMU, providing visualizations for operational analytics and university decision support. David sees his Tableau dashboard publication in a scientific journal as one of his greatest data viz accomplishments, and sees his greatest Tableau growth coming from time in the Next-Level Tableau community. He loves the DataFam and participates with it most through the HETUG and by co-leading an internal SMU-TUG.

David Nguyen
Opens in a new window Opens in a new window Opens in a new window
Social Accounts
Slack ProfileOpens in a new window Tableau PublicOpens in a new window LinkedInOpens in a new window TrailblazerOpens in a new window GithubOpens in a new window X ProfileOpens in a new window YouTubeOpens in a new window BlogOpens in a new window
Languages
English, Vietnamese
Talk to me about...
- AI Integration & Tableau Model Context Protocol (MCP)
- Full-Stack Tableau Automation & REST API
- Machine Learning & Generative AI
With 15+ years of experience across finance and healthcare, I am a certified Cloud Architect, Data Engineer, and Machine Learning Engineer. Bringing data to life with Tableau since 2015, my journey as a multi-year DataDev Ambassador bridges advanced software engineering with enterprise analytics. I actively share this at the Sydney TUG and Datafam events—evolving from my "From Clicks to Code" presentation to "From Scripts to Conversation", showcasing all things AI, Tableau MCP Integrations, Custom Extensions, and immersive Spatial Analytics in VR.

David Ogden
Opens in a new window Opens in a new window
Social Accounts
Tableau PublicOpens in a new window LinkedInOpens in a new window
Languages
English, French
Talk to me about...
- Primary and Secondary School Data
- Using Tableau Public
- Pastry and donut shops in Seattle
David Ogden has been a Tableau user since 2016 and a TUG co-leader since 2023. He enjoys talking about data, dogs, food and travel. He works in the Renton School District next to Seattle. Feel free to ask him about school related data and dashboards. Il parle français et anglais.

Dawn Harrington
Opens in a new window Opens in a new window Opens in a new window
Social Accounts
Slack ProfileOpens in a new window Tableau PublicOpens in a new window LinkedInOpens in a new window YouTubeOpens in a new window BlogOpens in a new window
Languages
English
Talk to me about...
- Data Storytelling
- Cats
- Video Games
Dawn Harrington has her own blog site Techtipsgirl.com where she writes how-to articles covering a variety of topics for Tableau, Alteryx and Microsoft Office. She is also an Alteryx Innovator. She currently has two degrees, a BFA in Art Education and a Computer Applications degree. She hosts many training sessions at her company and has volunteered to host / present at many TUG sessions. Her blog articles have been featured for the Datafam round up articles and in TableauBites.

Deborah Simmonds
Opens in a new window Opens in a new window
Social Accounts
Tableau PublicOpens in a new window LinkedInOpens in a new window TrailblazerOpens in a new window X ProfileOpens in a new window BlogOpens in a new window PodcastOpens in a new window
Languages
English
Talk to me about...
- Career pivots
- Data Visualisation
- Community
I first discovered Tableau in 2019 and was instantly hooked by its intuitive design and powerful analytical capabilities. With the encouragement, coaching, and generosity of the amazing #datafam community, I was able to make a successful mid-life career pivot. Today, I’m proud to work as a Senior Analytics Specialist at JLL, where I get to champion the value of data every day. I’m passionate about sharing knowledge, supporting others on their learning journeys, and helping people gain the skills and confidence they need to achieve their own career transitions.

Deepak Holla
Opens in a new window Opens in a new window Opens in a new window
Social Accounts
Slack ProfileOpens in a new window Tableau PublicOpens in a new window LinkedInOpens in a new window TrailblazerOpens in a new window YouTubeOpens in a new window BlogOpens in a new window
Languages
English
I have been using Tableau for several years, and one thing I have learned is that even seemingly simple concepts can be confusing when you are starting out. This has motivated me to create content that breaks down Tableau concepts in a simple, practical and easy-to-understand manner. Over the past year, I have focused on explaining the “why” behind Tableau features, tricky concepts, and exam-relevant topics through LinkedIn posts, Medium articles and YouTube videos. My goal is to make learning Tableau less intimidating and more approachable for the wider data community.

Dennis Kao
Opens in a new window Opens in a new window
Social Accounts
Tableau PublicOpens in a new window LinkedInOpens in a new window X ProfileOpens in a new window
Languages
English
Dennis is honored to serve as a 5-time Tableau Ambassador and 3-time Tableau Visionary. During the day, he is a social work professor at Carleton University, where he conducts health equity research and teaches courses on community practice, nonprofit management, research, and data visualization. Discovering Tableau in November 2020 invigorated his passion for data and opened up a whole creative side he never knew he had. Six years later, he has designed and published over 250 visualizations, including a lot of maps, on his Tableau Public profile.

Devanshu Tayal
Opens in a new window Opens in a new window Opens in a new window
Social Accounts
Slack ProfileOpens in a new window Tableau PublicOpens in a new window LinkedInOpens in a new window GithubOpens in a new window
Languages
English, Hindi, Punjabi
I turn complex data into stories that move people to act. As Sr. Tech Lead – Data & AI at Aegis Soft Tech, I build Tableau dashboards that teams actually use to decide. I lead the India AI + Tableau User Group and the Gujarat Tableau User Group, running workshops, viz challenges and storytelling sessions that have reached 10,000+ people. I am also Founder & CTO of Hubbl, a free platform where India's tech communities get discovered. I teach Data Visualization at BITS Pilani and review technical books. For me, a good dashboard ends an argument and starts a decision.

Devon Ngo
Opens in a new window Opens in a new window Opens in a new window
Social Accounts
Slack ProfileOpens in a new window Tableau PublicOpens in a new window LinkedInOpens in a new window TrailblazerOpens in a new window BlogOpens in a new window
Languages
English
Talk to me about...
- Design Thinking
- Community Projects (Makeover Monday, Workout Wednesday)
Devon is a connector, storyteller, and dabbler who loves working on problems at the intersection of tech, art, and business. After earning a BS in Chemical Engineering, he pivoted into analytics and is now an MBA + MS Design Innovation candidate at Northwestern University - Kellogg School of Management. Devon blends technical skill with creativity, applying human-centered design to problem solving, and is passionate about sharing knowledge, amplifying voices, and helping others grow. In his free time, he enjoys photography, singing, and exploring new and emerging tech.

Diego Martinez
Opens in a new window Opens in a new window Opens in a new window
Social Accounts
Slack ProfileOpens in a new window Tableau PublicOpens in a new window LinkedInOpens in a new window TrailblazerOpens in a new window GithubOpens in a new window YouTubeOpens in a new window BlogOpens in a new window
Languages
English, Spanish
Talk to me about...
- AI and Tableau
- Tableau Next
- Tableau Questions
Diego is the CTO of Modux, a trusted Tableau Partner. As a highly motivated Industrial Engineer, he brings +12 years of experience in Tableau and data visualization, along with seven years of expertise in marketing and supply chain. Diego is passionate about empowering others through data. He actively contributes to the community, answering a wide range of questions, and excels at transforming raw data into actionable insights. Diego collaborates with companies to become data-driven using the Tableau Platform, and he also creates educational content, including webinars available on his YouTube

Dinushki De Livera
Opens in a new window Opens in a new window
Social Accounts
Tableau PublicOpens in a new window LinkedInOpens in a new window YouTubeOpens in a new window BlogOpens in a new window
Languages
English, Sinhala
Talk to me about...
- Maps
- Business Dashboards
- Tableau tips and tricks
Dinushki is an independent Business Analyst and Data Visualization consultant with over 10 years of experience using Tableau. She first fell in love with Tableau at a data visualization class during her Masters program. She won the 2018 Women in Analytics Data Visualization Contest and was awarded the 2019 Viz of the Year by The Tableau Wannabe Podcast at the 2019 Tableau Conference. Her Firebird Visualization was on the Shortlist for the 2019 Kantar Information is Beautiful Awards. Dinushki is also the co-founder of Her Data and a Tableau User Group Leader in Cincinnati.

Doc Kevin Lee Elder
Opens in a new window Opens in a new window Opens in a new window
Social Accounts
Slack ProfileOpens in a new window Tableau PublicOpens in a new window LinkedInOpens in a new window TrailblazerOpens in a new window X ProfileOpens in a new window
Languages
English
Talk to me about...
- Being a Professor for the Day
- Advice from the Colorblind, We do see red & green!
- my almost finished book, Analytics Fluency
Doc Kevin Lee Elder is the Gary A. Moore Family Endowed Research Professor of Analytics & Cybersecurity at Louisiana Tech University. Doc came back to academia after a break spent in Industry training & coaching Data Fluency. He teaches Analytics Fluency for students from any major or background who need to be fluent at one level or another to get from Data to Information to Knowledge to Insights to Decisions to Wisdom & increased profits. Doc has 40+ years teaching courses in information. He has published more than 50 papers, presented more than 250 times & taught more than 10,000 students.

DominiqueWelt
Social Accounts
Languages
English, French
Talk to me about...
- Dataviz
- ETL with Tableau Prep
- Story telling
Dominique WELT is an Assistant Professor in the Department of Analytics, Operations, and Information Technology at ESG UQAM in Montreal, Canada. He holds a PhD from McGill University and an MBA from Université Laval. At UQAM, he teaches courses on data management, data visualization, and data governance. He is an active member of several research groups and centres, including GReSI and CRI2GS. Dominique’s research focuses on human-computer interaction, information technology use, and behavioral economics. He is a Tableau ambassador as of 2025.

Don Wise
Opens in a new window Opens in a new window
Social Accounts
Slack ProfileOpens in a new window LinkedInOpens in a new window TrailblazerOpens in a new window
Languages
English
Talk to me about...
- Tableau Mapping
- Time Calculations
- Tableau Prep
Don is a retired Public Safety executive, having well over 25 years of experience in the Fire/EMS Public-Safety/ 9-1-1 Communications domain. He's been a Tableau Community Forums Ambassador for seven years now, providing help to a variety of Tableau's customers from all over the world. He's been an avid contributor to the Community Forums, having worked with Tableau's product line since Version 7!

Donna Coles
Opens in a new window Opens in a new window
Social Accounts
Tableau PublicOpens in a new window LinkedInOpens in a new window X ProfileOpens in a new window BlogOpens in a new window
Languages
English
Talk to me about...
- Tableau Server
- Community Projects
- Tableau Desktop
Donna has been Forums Ambassador since 2017 and a Tableau Visionary since 2022. She has been using Tableau since 2012 specialising in both Tableau Desktop and Tableau Server. She is currently an analytics consultant at Biztory sharing her passion and knowledge of Tableau with a variety of clients. She has been a regular participant of the #WorkoutWednesday community project since its inception in 2017, and is now a member of the leadership team. She uses the challenges to really test her Desktop skills and also try out new features, and blogs her solution guides at donnacoles.home.blog.

Dr. Bushra Malik
Opens in a new window Opens in a new window Opens in a new window
Social Accounts
Slack ProfileOpens in a new window Tableau PublicOpens in a new window LinkedInOpens in a new window
Languages
Hindi, Punjabi, Urdu
Talk to me about...
- Business Analytics &data visualization
- Building academia–industry connections
- Tableau & AI in education
Educator, researcher, mentor, and data storyteller passionate about making data meaningful, accessible, and actionable. I integrate Tableau and data visualization into business and accounting education, helping students move beyond dashboards to discover patterns, communicate insights, and make better decisions. I enjoy building analytics communities, connecting students with industry, and creating opportunities for others to learn, grow, and find their voice through data.

Ebenezer Sam
Opens in a new window Opens in a new window Opens in a new window
Social Accounts
Slack ProfileOpens in a new window Tableau PublicOpens in a new window LinkedInOpens in a new window TrailblazerOpens in a new window GithubOpens in a new window X ProfileOpens in a new window BlogOpens in a new window
Languages
English
Talk to me about...
- Tableau Visualizations
- Creating actionable Tableau Dashboards
I love mixing data with design, turning messy numbers into visuals that make sense so people can make faster, better decisions. What started as curiosity about Tableau became something I can't let go of, and now I want to help others fall in love with it too.

Eduard Nizamov
Opens in a new window Opens in a new window Opens in a new window
Social Accounts
Slack ProfileOpens in a new window Tableau PublicOpens in a new window LinkedInOpens in a new window TrailblazerOpens in a new window YouTubeOpens in a new window BlogOpens in a new window
Languages
English, Russian
Talk to me about...
- Tableau Server & Platform Operations
- Tableau Extensions & APIs
- Tableau Automation & Applied AI
Eduard Nizamov is Head of Data Analytics & BI and runs a shared analytics platform used by 150+ analysts and BI developers. Two Tableau extensions he built – DendroMap Explorer and KPI Card – are available on Tableau Exchange. His AI dashboard project is in Tableau's DataFam Analytics & AI Gallery. Eduard contributes to the Tableau community as a teacher and speaker. He designed and taught a 16-lesson Tableau course and has spoken at Tableau User Groups in Serbia and Cyprus. His articles and YouTube videos cover Tableau Server, Tableau extensions, applied AI and BI engineering.

Ella Worsdale
Opens in a new window Opens in a new window Opens in a new window
Social Accounts
Slack ProfileOpens in a new window Tableau PublicOpens in a new window LinkedInOpens in a new window BlogOpens in a new window
Languages
English
Talk to me about...
- Tableau adoption
- Data Visualisation
- User Groups
Ella has been the co-lead of the UK Northwest Tableau User group since 2017 and proud to have been a Tableau Ambassador since 2019. Ella recognises the benefit of being part of a great community to enable shared learning and encouraging others to succeed. The Tableau community has had a huge impact on Ella’s life and career, and is humbled to be recognised again as an Ambassador. Ella lives in the Peak District with her husband, two sons and Luna the Miniature Schnauzer who is officially the family's Chief Well-Being Officer. Ella loves keeping fit, travelling, drawing and reading.

Ellen Blackburn
Opens in a new window Opens in a new window
Social Accounts
Tableau PublicOpens in a new window LinkedInOpens in a new window X ProfileOpens in a new window
Languages
English
Ellen is a Consulting Analyst at The Information Lab UK. She discovered Tableau and the Tableau Public community when she joined the Information Lab's Data School programme in 2018. Ellen uses Tableau Public to showcase business dashboards to help inspire others and visualise topics she's passionate about. She was also the winner of the Kelly Martin Best Designer Award for 2025.
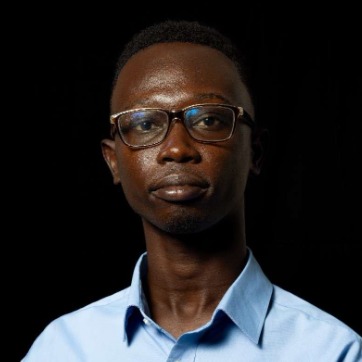
Elvis Kwabena Asare Nkrumah
Opens in a new window Opens in a new window Opens in a new window
Social Accounts
Slack ProfileOpens in a new window Tableau PublicOpens in a new window LinkedInOpens in a new window GithubOpens in a new window YouTubeOpens in a new window BlogOpens in a new window
Languages
English
Talk to me about...
- Data Storytelling & Visualization
- Agentic Analytics in Tableau
- Building Domain-Specific Dashboards
2X Tableau Ambassador and fmr. Teaching & Research Assistant at the University of Ghana, where I teach applied statistics and data visualization to 500+ students. I founded the Accra Tableau User Group to bring hands-on analytics training to Ghana's growing data community, and I've hosted workshops reaching hundreds of students through IndabaX and other local events. Tableau has been core to how I turn messy data into decisions people can actually act on. My work spans climate, health and neuroscience

Eman Alvani
Opens in a new window Opens in a new window Opens in a new window
Social Accounts
Slack ProfileOpens in a new window Tableau PublicOpens in a new window LinkedInOpens in a new window BlogOpens in a new window
Languages
English, Persian
Talk to me about...
- UX/UI
- Tableau Desktop
- Tableau Community
Eman currently serves as a Sr. BI Developer, using skills and knowledge passed down from numerous mentors and advocates to empower others in the field of analysis and data visualization. Spanning 10+ years in Tableau, he has presented at TC18 and TC24, taught Tableau at UC Berkeley and the University of Notre Dame, and served on multiple Tableau User Group committees. Eman holds degrees from Southern Methodist University, Pepperdine University (MBA), and Columbia University. In his spare time, he enjoys hockey, running, and philanthropic endeavors.

Emeric LE SAULNIER DE SAINT JOUAN
Opens in a new window Opens in a new window
Social Accounts
Tableau PublicOpens in a new window LinkedInOpens in a new window TrailblazerOpens in a new window
Languages
English, French, German
Talk to me about...
- Tableau Server
- Cats
- Technology
I’m a Tableau Server Expert Consultant based in Berlin, with 16 years of experience working with Tableau Server. I focus on large-scale deployments, troubleshooting, performance optimization, and integrations. With a background in database administration, data engineering, and software engineering, I enjoy solving complex technical challenges and understanding Tableau behind the scenes. I’m also passionate about sharing knowledge and contributing to the Tableau Community Forums and Slack Workspace.

Emily De Padua
Opens in a new window Opens in a new window Opens in a new window
Social Accounts
Slack ProfileOpens in a new window Tableau PublicOpens in a new window LinkedInOpens in a new window BlogOpens in a new window
Languages
English
Emily De Padua is a data storyteller passionate about people and visual design. After earning a Bachelor’s in Classical Flute Performance at Rowan University and attending a serendipitous lecture at Lincoln Financial Field, she forged a data career spanning industries such as entertainment, botanical gardens, media, and financial services. A Tableau user since 2016, Emily is a 3x Global Tableau Iron Viz Runner Up (top 10 in 2020, 2022, and 2024). In 2024, she was named Data Storyteller Extraordinaire and won Viz of the Year at the Tableau Vizzies.

Emmanuella Tudome
Opens in a new window Opens in a new window Opens in a new window
Social Accounts
Slack ProfileOpens in a new window Tableau PublicOpens in a new window LinkedInOpens in a new window X ProfileOpens in a new window
Languages
English
Talk to me about...
- Building people-centric data visualization
- Building community
Emmanuella Tudome is a Business Intelligence Analyst at Levy Analytics, where she has spent three years building dashboards that stakeholders actually use, translating vague requests into clear briefs and getting the answer in front of the person who needs it. Her Tableau Public work has earned four "Viz of the Day" selections and a shortlist at the Information is Beautiful Awards 2024. She co-organizes the Lagos Tableau User Group. Outside of dashboards, she's usually deep in TV, film, music and pop culture, or at the gym

Eric A Howard
Opens in a new window Opens in a new window Opens in a new window
Social Accounts
Slack ProfileOpens in a new window Tableau PublicOpens in a new window LinkedInOpens in a new window TrailblazerOpens in a new window GithubOpens in a new window YouTubeOpens in a new window BlogOpens in a new window
Languages
English
Talk to me about...
- Tableau Governance
- Tableau Security
- Tableau Data Modeling
Eric is a Tableau community speaker. He is the founder of the Tableau Public TUG and co-leader of the Nashville TUG, where he brings together Tableau creators to share ideas and learn from each other. In his professional life, Eric is an IT leader with a track record of using data and analytics in innovative ways to improve business operations. Eric specializes in data modeling and analytics that leverage server and site security. By combining thoughtful design with proven analysis, he helps teams see their information clearly and securely.

Eric Balash
Opens in a new window Opens in a new window Opens in a new window
Social Accounts
Slack ProfileOpens in a new window Tableau PublicOpens in a new window LinkedInOpens in a new window X ProfileOpens in a new window YouTubeOpens in a new window BlogOpens in a new window
Languages
English
Talk to me about...
- Center for Enablement
- Dashboard Design
- Getting started with Tableau
Hi! I’m Eric Balash, a data visualization expert passionate about turning data into clear insights. I’m a 3x Tableau Visionary, Tableau Ambassador, and co-lead of Back 2 Viz Basics, a community project that helps newcomers build confidence in data viz. Professionally, I work at Navy Federal Credit Union, building dashboards and focusing on data enablement across the enterprise. In my free time, I’m loving life in the DC area as a new first-time dad with my wife Olivia, our baby boy, and our poodle Loki. Let’s connect!

Eric Parker
Opens in a new window Opens in a new window
Social Accounts
Tableau PublicOpens in a new window LinkedInOpens in a new window TrailblazerOpens in a new window GithubOpens in a new window YouTubeOpens in a new window BlogOpens in a new window
Languages
English
Talk to me about...
- Data Modeling
- Tableau Prep
- Tableau Date Calculations
When I'm not in the office building workflows and dashboards, I'm spending time with my three sons, exercising in the elements of the Pacific Northwest, or cheering on the Seattle Mariners.

Eric Summers
Opens in a new window Opens in a new window Opens in a new window
Social Accounts
Slack ProfileOpens in a new window Tableau PublicOpens in a new window LinkedInOpens in a new window GithubOpens in a new window YouTubeOpens in a new window BlogOpens in a new window
Talk to me about...
- Tableau Extensions
- Tableau and AI
- Tableau Cloud/Server Admin and APIs
Eric Summers is a returning Tableau Ambassador and the founder of TableauOps. He's fascinated by what happens when analysts stop hand-building and start directing AI to build for them, and he explores it in the open every day: Tableau viz extensions built from a single sentence, live workshops, and free tools he gives away so others can build too. He started with Excel line charts fifteen years ago and never stopped chasing the next thing in building analysis.

Ethan Lang
Opens in a new window Opens in a new window
Social Accounts
Tableau PublicOpens in a new window LinkedInOpens in a new window BlogOpens in a new window
Languages
English
Talk to me about...
- Tableau Development
- AI Integration
- Statistical Analysis
Ethan Lang is Director of Analytics Engineering at Playfair Data and is an award-winning data visualization engineer. He is the founder of the Viz 4 Vets Data Initiative, a Tableau User Group ambassador, and a technical reviewer on multiple best-selling Tableau books. Ethan specializes in advanced Tableau engineering and statistical analysis/AI. His data visualization strategies have been shared in dozens of cities across the world and he is the author of 'Statistical Tableau'.

Etsuro Tabata
Opens in a new window Opens in a new window Opens in a new window
Social Accounts
Slack ProfileOpens in a new window Tableau PublicOpens in a new window LinkedInOpens in a new window TrailblazerOpens in a new window GithubOpens in a new window X ProfileOpens in a new window
Languages
Japanese
Talk to me about...
- Tableau Hackathon
- Tableau Neighborhood
- Slack Agent Builder Challenge
Etsuro Tabata is a Tableau Technical Support Engineer. He is highly skilled in troubleshooting Tableau Server and Cloud issues. Leveraging this experience, he has provided answers on the Tableau Community Forum since 2024. At the Tableau Hackathon 2025-2026, he won the "Best Data Layer Implementation" award. He loves helping people.

Eusuf
Opens in a new window Opens in a new window Opens in a new window
Social Accounts
Slack ProfileOpens in a new window Tableau PublicOpens in a new window LinkedInOpens in a new window TrailblazerOpens in a new window X ProfileOpens in a new window
Languages
English, Italian, Bangla
Talk to me about...
- CRM Analytics
- Data 360
- Agentforce
Successful leader with 20+ years of experience in driving innovative process improvements Eusuf is a passionate Salesforce Application architect & CRM Analytics Ambassador, enjoying the time with Financial Services Cloud,Data Cloud and CRM Analytics. Experiencing the evolution of Salesforce ecosystem since 2007, helped colleagues to play with Salesforce efficiently and ensured business value to the customers in 4 continents. A great enthusiast of Artificial Intelligence, presently working as Enterprise Architect.

Felicia Styer
Opens in a new window Opens in a new window
Social Accounts
Tableau PublicOpens in a new window LinkedInOpens in a new window X ProfileOpens in a new window BlogOpens in a new window
Languages
English
Talk to me about...
- Calculations
- Tableau Prep
- Cooperative Boardgames
You might know Felicia (@graph_hopper) from the tutorials she writes for Playfair Data, the questions she answers on r/tableau, or from KCTUG. Felicia has been using Tableau since 2016, and currently works as a technical consultant at Playfair Data, building Prep flows and Tableau Dashboards for her clients. Her favorite part of her work is the steady stream of new datasets, industries, and data puzzles. Her favorite functions are Index and Previous_Value, and her favorite chart type is a scatter plot. Outside of work, her hobbies include board games, logic puzzles, and bird watching.

Fi Crocker
Opens in a new window Opens in a new window Opens in a new window
Social Accounts
Slack ProfileOpens in a new window Tableau PublicOpens in a new window LinkedInOpens in a new window TrailblazerOpens in a new window GithubOpens in a new window YouTubeOpens in a new window BlogOpens in a new window PodcastOpens in a new window
Languages
English
Talk to me about...
- Helping people adopt Tableau
- Helping people with their Tableau consulting business
- Tableau Next & Data360
I'm a nine-time Tableau Ambassador, and the DataFam community is the reason I keep showing up year after year. My Tableau journey started with version 8, and since then I've built my career around organising User Groups, supporting the Vizzies, and mentoring people coming up in the community. I co-founded Dub Dub Data, a consultancy focused on Salesforce Data Cloud and Tableau work, where I get to keep doing the hands-on building alongside the community work I love most. This community has shaped how I think about data, and being an Ambassador is my way of giving that back.

Fraser Gallop
Opens in a new window Opens in a new window Opens in a new window
Social Accounts
Slack ProfileOpens in a new window Tableau PublicOpens in a new window LinkedInOpens in a new window TrailblazerOpens in a new window X ProfileOpens in a new window PodcastOpens in a new window
Languages
English
Talk to me about...
- Anything Tableau
- Data Warehouses
- Modern Data Architecture
Fraser has used Tableau for almost 15 years and attended Tableau Conference for 12 straight years, speaking for the last two. At Onware, he focuses on the construction industry, helping companies activate their data and build modern data architectures. He co‑hosts the Hard Hats & Data Chats podcast and contributes to the community through Iron Viz qualifier judging, User Groups, and participating in Workout Wednesday.

Frederic Fery
Opens in a new window Opens in a new window Opens in a new window
Social Accounts
Slack ProfileOpens in a new window Tableau PublicOpens in a new window LinkedInOpens in a new window X ProfileOpens in a new window BlogOpens in a new window
Languages
English, French
Talk to me about...
- Tableau Enablement
- Data For Good
Frederic is a Brisbane-based data visualization consultant and co-founder of Data Change Makers, a community empowering nonprofits to drive social change through data. He is passionate about creating impactful visual stories in Tableau Public and enjoys sharing his expertise by teaching Tableau at his local university. When he’s not vizzing, Frederic enjoys hiking, tending to his small food forest, baking bread, making soap, and cycling.

Gaby Bouret
Opens in a new window Opens in a new window Opens in a new window
Social Accounts
Slack ProfileOpens in a new window Tableau PublicOpens in a new window LinkedInOpens in a new window X ProfileOpens in a new window
Languages
English, Spanish
Gaby Bouret is Head of Data Analysis at La Nación Data, where she leads interactive data projects. She holds a degree in Information Systems (CAECE), a diploma in Business Intelligence, and a Master’s in Data Mining (Universidad Austral). Since 2019, she has taught in the Data Science program at ITBA University. Passionate about creativity, innovation, and the Tableau community, she frequently shares her work at conferences, webinars, and community talks. She also mentors and judges data visualization challenges, inspiring new talent to explore the power of storytelling.

Gbolahan
Opens in a new window Opens in a new window
Social Accounts
Tableau PublicOpens in a new window LinkedInOpens in a new window X ProfileOpens in a new window BlogOpens in a new window
Languages
English, Yoruba
My Tableau journey started with Football Manager. The Data Hub showed me what visualisation could do, and Tableau Public became my classroom. Building in public turned into Viz of the Day features, an IIB shortlist, and the Visionary title. I also co-founded the Lagos Tableau User Group. Still building, still teaching

Ghafar Shah
Opens in a new window Opens in a new window
Social Accounts
Tableau PublicOpens in a new window LinkedInOpens in a new window GithubOpens in a new window X ProfileOpens in a new window BlogOpens in a new window
Languages
English
Talk to me about...
- Data Visualization
- Video Games
- TV Shows
I’ve always been passionate about data visualization and analytics, especially when it comes to using Tableau to bring ideas to life. I love creating dashboards on all kinds of topics, whether it’s TV shows, movies, or video games, things I’m genuinely excited about and enjoy exploring through data. What I enjoy most, though, is being part of the Tableau community, connecting with people in the #DataFam, and helping others along their data visualization journey.

Ginny Moench
Opens in a new window Opens in a new window Opens in a new window
Social Accounts
Slack ProfileOpens in a new window Tableau PublicOpens in a new window LinkedInOpens in a new window X ProfileOpens in a new window BlogOpens in a new window
Languages
English
Talk to me about...
- Higher Education
- Chickens
- Books
Ginny has worked as an Enrollment Management BI Analyst at Appalachian State University since 2019. In her off time, you might find her feeding chickens, gardening, kayaking, shopping for vintage books, planning a trip, or cooking something delicious! She has degrees in Anthropology from Wake Forest and New Mexico State University. In 2012, she had just started her career in higher education when she discovered Tableau and fell head over heels in love. She learned to use Tableau through trial and error until she discovered the Tableau Community in 2016 at her first Tableau Conference.

Giulio D'Errico
Opens in a new window Opens in a new window Opens in a new window
Social Accounts
Slack ProfileOpens in a new window Tableau PublicOpens in a new window LinkedInOpens in a new window GithubOpens in a new window BlogOpens in a new window
Languages
English, Italian
Giulio is a BI Analyst based in Turin, Italy, who combines his passion for numbers, coding, and creativity through data visualization. With a background in bioengineering, he sees Tableau as the place where analytical thinking meets design, turning data into clear and engaging stories. Beyond building dashboards, Giulio enjoys sharing knowledge, supporting others in their learning journey, and inspiring the community to explore new ways of working with data.

Gospel Chinedu K.
Opens in a new window Opens in a new window
Social Accounts
Tableau PublicOpens in a new window LinkedInOpens in a new window GithubOpens in a new window X ProfileOpens in a new window YouTubeOpens in a new window
Languages
English
Talk to me about...
- Dashboard Development
- KPI Tracking
- Domain Analysis
I am a Datafam Ambassador, Trainer, Teacher, Consultant, and Community Builder My mission is simple. Train, Teach, Consult, Inspire, and Help the Data Fam Community turn raw data into decisions that change businesses and lives. My journey into data started in the real world Problem Solving As a Trainer and Teacher, I don’t just teach buttons and charts. I teach thinking. I’ve had the privilege of training HSE staff, business leaders, students and junior analysts across Nigeria. As a Tableau Ambassador, I’m committed to the 3E's Educate, Engage and Elevate the tableau datafam community.

Gota Oyama
Opens in a new window Opens in a new window Opens in a new window
Social Accounts
Slack ProfileOpens in a new window Tableau PublicOpens in a new window LinkedInOpens in a new window TrailblazerOpens in a new window X ProfileOpens in a new window
Languages
English, Japanese
Talk to me about...
- Tableau Community
- Tableau × AI
- Football
Hello! My name is Gota Oyama. I am a student at Kanda University of International Studies and the official leader of the Tableau Student User Group in Japan. I first encountered Tableau through a required university course. Since then, I have organized beginner hands-on events through the Data AI Lab and also I supported data visualization sessions for high school students at open campus in my university. As an Academic Ambassador, I hope to create opportunities between students and professionals and to hold Grobal events for students to connect with many people around the world.

Gurpreet Singh
Opens in a new window Opens in a new window Opens in a new window
Social Accounts
Slack ProfileOpens in a new window Tableau PublicOpens in a new window LinkedInOpens in a new window X ProfileOpens in a new window YouTubeOpens in a new window
Languages
English, Hindi, Punjabi
Gurpreet Singh is an AI Analytics Lead, Tableau Certified Specialist, trainer, and content creator with 2 decades of experience turning enterprise data into trusted insight. He builds data visualisation, semantic models and AI agent workflows, connecting Tableau, Claude, and Snowflake for governed, natural-language analytics. Introduced to Tableau in 2016, he blends rigorous data architecture with visual storytelling. He shares his learnings on Data Viz Canvas (YouTube) and actively supports the Tableau community. Outside work, he enjoys time with his two children.

Hari Ankem
Opens in a new window Opens in a new window
Social Accounts
Tableau PublicOpens in a new window LinkedInOpens in a new window
Languages
English, Hindi
Talk to me about...
- Tableau Desktop
- Tableau Prep
- Tableau Server/Cloud
Hari Ankem is an 8x Tableau Community Leader and Top 10 all-time contributor with 20+ years in technology and 10+ years in data visualization. He has delivered impactful data and analytics solutions for Fortune 500 clients across energy, banking, and finance, while leading Tableau governance, Centers of Excellence, and enterprise dashboard strategy and design. Certified as a Tableau Desktop Specialist, Hari is recognized for expertise in analytics, data visualization, and storytelling, and has mentored the Tableau community since 2019.

Harim Jung
Opens in a new window Opens in a new window Opens in a new window
Social Accounts
Slack ProfileOpens in a new window Tableau PublicOpens in a new window LinkedInOpens in a new window GithubOpens in a new window BlogOpens in a new window
Languages
English, Korean
Talk to me about...
- Climate Data Visualization & Automated Reporting
- Tableau Claude Extensions & API Integrations
- Data Architectures for International Organizations
I am a Tableau Ambassador, Senior Data Architect, and Founder of Visual Climate Inc. I specialize in designing real-time dashboards and automated climate reporting tools for UN agencies. As a LinkedIn Learning Instructor, I teach "Tableau for Climate Professionals." I love discussing end-to-end data pipelines, building Tableau extensions, and integrating AI/Extension API architectures to make environmental data actionable. Let's connect to chat about data visualization for global impact!

Haruna Egawa
Opens in a new window Opens in a new window Opens in a new window
Social Accounts
Slack ProfileOpens in a new window Tableau PublicOpens in a new window LinkedInOpens in a new window X ProfileOpens in a new window
Languages
Japanese
Talk to me about...
- Drawing pictures of food in Tableau
Haruna is responsible for developing new features for internal apps designed to improve business efficiency. I first discovered Tableau in 2023 and began participating in various communities during my third year of university. Today, I actively contribute to the DATA Saber Council, focusing on helping university students build connections with the DataFam!

Heather Cox
Opens in a new window Opens in a new window Opens in a new window
Social Accounts
Slack ProfileOpens in a new window Tableau PublicOpens in a new window LinkedInOpens in a new window X ProfileOpens in a new window YouTubeOpens in a new window BlogOpens in a new window
Languages
English
Heather builds dashboards that answer real business questions, and vizzes that answer her own curiosity. That curiosity landed her IronViz entry, Only to be Sociable, in the top 10 this year. It also inspired Inbox – Mindshift Overdue, a look at why boundaries matter more than a tidy inbox, and We Didn't Chart the Fire, which layers two songs about historical chaos onto one timeline. She also co-hosts Unfinished Vizness, a YouTube channel about the messy middle of viz building, where getting stuck is normal and getting unstuck is something we can do together.

Heidi Kalbe
Opens in a new window Opens in a new window
Social Accounts
Tableau PublicOpens in a new window LinkedInOpens in a new window BlogOpens in a new window
Languages
English, German
Talk to me about...
- Performance best practices
- (Community) leadership
- Alpacas
Heidi has made it her mission to promote and improve diversity in the data community. Ever since discovering Tableau, she has been liberally sharing her enthusiasm and expertise with users all over the world through countless user groups (including her own Rheinland TUG), conferences, guest lectures, her blog, and even the occasional song. Turning passion into profession, Heidi's current role as Manager at Woodmark Consulting GmbH allows her to do what she does best: inspire others with her passion for a company-wide analytics culture. The only thing Heidi loves more than Tableau are alpacas.

Hideaki Shiihara
Opens in a new window Opens in a new window Opens in a new window
Social Accounts
Slack ProfileOpens in a new window Tableau PublicOpens in a new window LinkedInOpens in a new window TrailblazerOpens in a new window X ProfileOpens in a new window
Languages
Japanese
Talk to me about...
- Tableau
- Data Visualization
- Mountain Climbing & Bird Watching
I passed the DATA Saber certification program in Japan in August 2024 and became a DATA Saber. Since September 2023, I have been active on the Tableau Community Forum. I enjoy connecting with people from all over the world through the common language of Tableau. Through answering questions—both my own and those of other members—I can reaffirm my knowledge and gain new insights, while also being helpful to users, which makes the experience very rewarding. My hobbies include mountain climbing throughout all seasons, bird watching with photography, and Tableau itself.

Hideaki Yamamoto
Opens in a new window Opens in a new window Opens in a new window
Social Accounts
Slack ProfileOpens in a new window Tableau PublicOpens in a new window LinkedInOpens in a new window TrailblazerOpens in a new window GithubOpens in a new window X ProfileOpens in a new window BlogOpens in a new window
Languages
Japanese
Talk to me about...
- Tableau Public
- Tableau & AI
Hideaki is a payment application engineer at NEC Solution Innovators. He discovered Tableau Public and became captivated by the various visualizations created by his fellow DataFam members. Since then, he has continued to create visualizations in order to convey the joy of gaining insights from data through Tableau. He is also exploring various ways to combine Tableau and AI. In addition, he is working to contribute to the growth of the Tableau community in the Hokuriku region of Japan, where he resides.

Hiroaki Morita
Opens in a new window Opens in a new window Opens in a new window
Social Accounts
Slack ProfileOpens in a new window Tableau PublicOpens in a new window LinkedInOpens in a new window X ProfileOpens in a new window YouTubeOpens in a new window BlogOpens in a new window
Languages
English, Japanese
Talk to me about...
- Tableau Table Calculation
- Tableau Prep
- Data Modeling
Hiroaki Morita is a co-leader of the Japan Tableau Prep User Group, dedicated to creating a world where anyone can seamlessly move from data preparation to analysis and visualization. Leveraging decades of experience in data analytics, he has supported data utilization across numerous companies while continuously fostering the next generation of data professionals through university education. He also actively promotes the dissemination and awareness of "open data", serving as a bridge between industry, education, and government to advance data-driven innovation.

Hiroaki Nakajima
Opens in a new window Opens in a new window Opens in a new window
Social Accounts
Slack ProfileOpens in a new window Tableau PublicOpens in a new window LinkedInOpens in a new window X ProfileOpens in a new window BlogOpens in a new window
Languages
Japanese
Talk to me about...
- Tableau Prep
- Makeover Monday
Master of Engineering, Major in Chemistry 1989 – Joined Mitsubishi Materials Corporation Worked in Product Development, later responsible for Sales & Marketing Management. Planned and executed global customer sales strategies and negotiations. In recent years, engaged in defining business requirements for Sales Department during Salesforce implementation, gaining opportunities to use Tableau. Currently leading DX initiatives in manufacturing divisions, promoting the use of Tableau and Tableau Prep. Active as a DATA Saber and organizer of the Japan Tableau Prep User Group.

HIROYOSHI KAMEGAKI
Japm Tableau Papa and Mama User GroupOpens in a new window
Japan Tabeau and Databricks User GroupOpens in a new window
Tableau Japn Mapping and GIS User GroupOpens in a new window
Opens in a new window Opens in a new window
Social Accounts
Slack ProfileOpens in a new window Tableau PublicOpens in a new window X ProfileOpens in a new window
Languages
Japanese
Talk to me about...
- Tableau Tips
- Mapping and GIS
- Social Good
I manage the financial and non-financial data infrastructure at a Japanese energy company. I have also served for many years as an organizer for a user group comprising energy and utility companies. My goal is to empower and energize with data.

Iaroslava Mizai
Opens in a new window Opens in a new window Opens in a new window
Social Accounts
Slack ProfileOpens in a new window Tableau PublicOpens in a new window LinkedInOpens in a new window
Languages
English, Ukrainian
Talk to me about...
- Tableau
- SQL
- AI
I’m Iaroslava Mizai, a freelance Data Analyst and Tableau Dashboard Designer based in Kyiv, Ukraine. I was recognized as a Tableau Public Ambassador in 2024 and 2025 and am a 2026 Vizzies Award winner in the Best Designer category. My work has been featured 12 times as Viz of the Day, and I was recognized as a Tableau Featured Author in 2017. I won DataFest Tbilisi 2020 for my work with conflict data. My Tableau journey began in 2012 as a hobby while working in media and has grown into my professional career, blending creativity, analytics, AI, automation, and data storytelling.

Idris Akilapa
Opens in a new window Opens in a new window
Social Accounts
Tableau PublicOpens in a new window LinkedInOpens in a new window
Languages
English, Yoruba
Talk to me about...
- Parameter
- Dashboard Design
- RLS
Idris Akilapa is a seasoned Data Analyst with over 6 years of experience in analytics, visualization, and consultancy. He specializes in transforming complex datasets into clear, impactful insights that drive strategic decision-making and enhance operational efficiency. Proficient in Tableau and advanced data analytics, Idris has successfully trained more than 5,000 data enthusiasts, empowering individuals and organizations to harness the power of data. Deeply committed to advancing the Nigerian and Africa Data Community

Igor Garlowski
Opens in a new window Opens in a new window
Social Accounts
Tableau PublicOpens in a new window LinkedInOpens in a new window GithubOpens in a new window YouTubeOpens in a new window BlogOpens in a new window
Languages
English, Spanish
Talk to me about...
- Modernizing BI platforms & data architecture (Tableau, Snowflake, AWS)
- Turning dashboards into decisions, not shelfware
- Cutting BI/data tool costs without losing capability
Igor is the Managing Director of Data Dune and a Tableau Ambassador specialising in visual analytics and data engineering. He helps SaaS and RevOps teams modernise their BI platforms and solve complex analytics challenges.

ilija stojić
Opens in a new window Opens in a new window Opens in a new window
Social Accounts
Slack ProfileOpens in a new window Tableau PublicOpens in a new window LinkedInOpens in a new window TrailblazerOpens in a new window X ProfileOpens in a new window
Languages
English, Croatian, Serbian
Talk to me about...
- Anything analytics
- Enablement
- 42
Meet ilija, not Tore. A Tableau consultant, architect, &mentor, with 20+ years of adventures in analytics, who is sometimes mistaken for an Agentic AI. To paraphrase Emerson: To viz often and much; to enable insights and joyful adoption by stakeholders; to endure the betrayal of bad data; to appreciate a correctly used pie chart; to find the best in others; to leave the world a bit better, whether by a healthy data culture, a useful dashboard or a redeemed *Tool-That-Must-Not-Be-Named* user; to know even one life has breathed easier because you have lived. This is to have succeeded!"

Iris Sun
Opens in a new window Opens in a new window
Social Accounts
Tableau PublicOpens in a new window LinkedInOpens in a new window GithubOpens in a new window X ProfileOpens in a new window BlogOpens in a new window
Languages
Chinese, English
Talk to me about...
- Tableau MCP + AI
- Tableau Viz Extensions, and Cloud
- Data storytelling & visualization design on Tableau Public
Iris Sun is a community-based researcher, consultant, data analyst, and data storyteller who helps organizations turn complex public and community data into strategic, actionable insight. She creates clear, accessible, equity-centered data stories and has published 200+ vizzes on Tableau Public, including multiple Viz of the Day selections. Now in her second year as a Tableau Ambassador, Iris also contributes generously to the Tableau community — co-leading user groups, amplifying others' work, and exchanging ideas on Slack and social media.

Iryna Demko
Opens in a new window Opens in a new window Opens in a new window
Social Accounts
Slack ProfileOpens in a new window Tableau PublicOpens in a new window LinkedInOpens in a new window YouTubeOpens in a new window
Languages
English
Talk to me about...
- Statistics and Tableau
- Cluster Analysis
- Teaching Tableau
I hold a doctoral degree in Applied Economics from Penn State University, and Data Analysis in Tableau is my favorite subject to teach. As a CERGE-EI Foundation Teaching Fellow, I have been able to continue teaching Tableau in Ukrainian and make high-quality learning opportunities more accessible. I have presented at Tableau Conferences and look forward to contributing to the Tableau community in my new role as a Tableau Ambassador.

Iuan Souza
Social Accounts
Languages
English, French, Portuguese, Spanish
Talk to me about...
- Tableau
- AI - Artificial Intelligence
- BI - Business Intelligence
Iuan Ferraz is Head of AI, Data Science & Digital Transformation at Pítia. Professor at Fundação Dom Cabral and FIA Labdata, delivering MBA, postgraduate and corporate training in AI, Business Intelligence and Data Science, reaching 5,000+ professionals only in 2025. Former Global Head of People Analytics at Wildlife Studios, Executive Manager og BI and Analytics at Bayer Brasil and manager of People Analytics at BASF South America. MIT Hackathon winner (2020) for SME credit algorithm. Holds dual engineering degrees (Poli-USP Brazil & ENSCM France) plus MBAs in Big Data and Analytics (FIA).

Izumi Kimura
Opens in a new window Opens in a new window
Social Accounts
Tableau PublicOpens in a new window LinkedInOpens in a new window X ProfileOpens in a new window
Languages
English, Japanese
Talk to me about...
- Tourism data
- Dashboard design
Izumi works with data at Hoshino Resorts, a Japanese hotel management company, where she turns hotel data into Tableau dashboards that support decision-making. She found the Tableau community through DATA Saber, a community-driven data literacy certification program unique to Japan, and learned there how generously this community shares what it knows. Today she trains the next group of DATA Sabers, and posts vizzes of her own on Tableau Public. She hopes to help data take root across the tourism industry.

J. Michelle Maraj
Opens in a new window Opens in a new window
Social Accounts
Tableau PublicOpens in a new window LinkedInOpens in a new window BlogOpens in a new window
Languages
English
Talk to me about...
- Enablement & training
- Public speaking
- AI & vibe coding
I was introduced to Tableau in my first consulting role, and it has driven my career since. After learning Tableau for analysis, my career lead me to Lyft for financial reporting and then to Qwick where I ran the Tableau environment for all teams. I've spoken on Tableau, data visualization, and upskilling colleagues at a variety of conferences, and am now a TUG leader. The Tableau community has introduced me to many in the field who have inspired me to grow my data visualization and technical skills, and given me opportunities to grow my career.

Jack Hineman
Opens in a new window Opens in a new window Opens in a new window
Social Accounts
Slack ProfileOpens in a new window Tableau PublicOpens in a new window LinkedInOpens in a new window X ProfileOpens in a new window
Languages
English
Jack is the Vice President of Business Intelligence at Gaylor Electric. After starting his career in IT, he pivoted to BI in 2017 with a mission to empower measurement-focused accountability and remove emotion from the decision-making process. Jack has been recognized as a leader in analytics for the Construction Industry. He is an active participant in Tableau community challenges, and he was awarded an #IIBAwards Bronze. After work, he enjoys spending time with his amazing wife (Amy) and their 3 boys (Cooper, Asher, & Lincoln), coaching football & basketball, and traveling.

Jacob Rothemund
Opens in a new window Opens in a new window Opens in a new window
Social Accounts
Slack ProfileOpens in a new window Tableau PublicOpens in a new window LinkedInOpens in a new window BlogOpens in a new window
Languages
English
Talk to me about...
- Video Games
- Guitar
- Formula One
Jacob has been working with Tableau for 13 years, with experience as a developer and server admin. He enjoys the ability the platform provides for building interactive, visually appealing user experiences. Jacob gives back to the community he has learnt so much from over the years by participating in Tableau User Groups, sharing tips and tricks online, and by publishing unique Tableau Public visualisations (with 3x VOTD to date). In his spare time outside work, Tableau and his family, Jacob enjoys playing guitar, playing video games with friends and spending time at the gym.

Jacqui Moore
Opens in a new window Opens in a new window Opens in a new window
Social Accounts
Slack ProfileOpens in a new window Tableau PublicOpens in a new window LinkedInOpens in a new window GithubOpens in a new window X ProfileOpens in a new window BlogOpens in a new window
Languages
English
Talk to me about...
- Calculations
- Enablement and adoption
- Data modeling
Jacqui's passion for visual design, communication, and data found its ideal outlet in Tableau and the Tableau Community. Ever since, she dove head first into the data analytics space, creating impactful visualizations and crafting the analytic data sets that power them. Jacqui’s expertise extends to Tableau Cloud, training, enablement, and process optimization for maximizing data’s value. She is passionate about learning, sharing her knowledge with others, and helping others on their Tableau journey. She is co-lead of the Boston Tableau User Group and #RWFD and blogs at DoMooreWithData.com.

jaden
Opens in a new window Opens in a new window Opens in a new window
Social Accounts
Slack ProfileOpens in a new window Tableau PublicOpens in a new window LinkedInOpens in a new window GithubOpens in a new window
Languages
English, Korean
Talk to me about...
- Using Tableau in Real Business Projects
- Creating Effective Dashboards & Data Stories
I believe data is a critical foundation for better understanding and decision-making. I see Tableau as more than a visualization tool—it’s a way to help people understand data and make better decisions. Through real-world dashboard projects and data storytelling, I’ve learned how to make data more practical and accessible. I enjoy sharing those experiences and helping others get more value from Tableau.

James Emery
Opens in a new window Opens in a new window Opens in a new window
Social Accounts
Slack ProfileOpens in a new window Tableau PublicOpens in a new window LinkedInOpens in a new window TrailblazerOpens in a new window X ProfileOpens in a new window
Languages
English
Talk to me about...
- Tableau Calculations
- Tableau Prep
James Emery works at Georgia Tech in Atlanta and has been using Tableau since 2018. A Tableau Ambassador since 2021, he co-leads the Higher Education TUG and enjoys sharing knowledge in the Forums, Community Slack, and Tableau subreddit. James has attended Tableau Conference every year since 2019 (including two virtual ones) and enjoys helping others solve problems and grow their data skills. I am an avid listener of podcasts (Econtalk is my favorite) and viewer of British comedy panel shows.

Jane Kamata
Opens in a new window Opens in a new window Opens in a new window
Social Accounts
Slack ProfileOpens in a new window Tableau PublicOpens in a new window LinkedInOpens in a new window
Languages
English
Talk to me about...
- Data Storytelling
- Experience Design
- Early Career
Jane Kamata is a data visualization enthusiast and three-time Tableau Ambassador recognized for her impact in the Tableau academic community. She is the winner of Tableau’s Iron Viz: Student Edition 2024, a seven-time Vizzie Award nominee, and a two-time Viz of the Day creator. She also serves on the Austin Tableau User Group Advisory Council. Currently working as a business analyst and attending graduate school for analytics, Jane is passionate about analytics storytelling and empowering others to turn data into meaningful, visual insights.

Jason Davidson
Social Accounts
LinkedInOpens in a new window YouTubeOpens in a new window
Languages
English
Talk to me about...
- Tableau for Teaching
- Data Competitions
- Sports Analytics
Dr. Jason Davidson is an Assistant Professor in the Lacy School of Business at Butler University, teaching data analytics, business intelligence, data visualization, and MIS courses. A former technical publishing professional, he also consults for Indianapolis-area businesses. Davidson serves as Vice President of the ATMAE EECT Division and Vice President of Technology for the Mid-West Decision Sciences Institute and is a Global Tableau Academic Ambassador. He holds degrees from Butler University, Morehead State University, and Indiana State University.

Jay Young
Social Accounts
LinkedInOpens in a new window TrailblazerOpens in a new window
Languages
English
Talk to me about...
- Tableau REST API
- Tableau Migration SDK
- Tableau MCP
Jay Young is a Senior Consultant with a focus on Data & AI. He specializes in data visualization, data architecture and engineering, and automation scripting. He has supported clients across the US and globally to build dashboards, provide Tableau support, and build scalable, sustainable infrastructure. Before beginning a career in consulting in 2022, Jay was an educator for several years. He continues to focus on empowering others to grow and develop their potential, and advocates for public education, students who are gifted, and students with special needs.

Jen Shepherd
Opens in a new window Opens in a new window Opens in a new window
Social Accounts
Slack ProfileOpens in a new window Tableau PublicOpens in a new window LinkedInOpens in a new window TrailblazerOpens in a new window
Languages
English
Talk to me about...
- Leading a user group
- Parameters
- Calculations
Jen Shepherd has been into data viz since 2014, applying visualization best practices and creativity in the non-profit, for-profit, and government sectors. She has a PhD in Social Psych and enjoys helping organizations collect, analyze, understand, and especially use their data. She’s currently a contractor who builds data dashboards for internal and external audiences. She also analyzes data and enjoys training others in data literacy and using Tableau. Jen has been on the Madison TUG leadership team for nine years, where she presents regularly and is always exploring member engagement.

Jen Shier
Jen is a Principal IT Admin at Palo Alto Networks. Currently, her passion drives her to be a bridge between departments for all Salesforce analytics products including CRM Analytics, Tableau, Data Cloud, Native Salesforce analytics, and Event Log Monitoring. Her background includes Salesforce architecture and analytics since 2001, Dreamforce speaker 2003-2019, and 4x MVP. As a single parent, her free time is spent with her 13yr old son and quartz crystal mining.

Jennifer Dawes
Opens in a new window Opens in a new window Opens in a new window
Social Accounts
Slack ProfileOpens in a new window Tableau PublicOpens in a new window LinkedInOpens in a new window
Jennifer Dawes is a Tableau Visionary and data leader with expertise in analytics, visualization, and community building. She has led teams at Covetrus, guided programs at the Data Visualization Society, and co-founded Her Data to empower women in tech. A trusted advisor to business leaders, she transforms complex data into insights that drive growth and innovation. Passionate about mentorship, Jennifer fosters spaces where people and teams learn, collaborate, and thrive.

Jennifer Eneh
Opens in a new window Opens in a new window Opens in a new window
Social Accounts
Slack ProfileOpens in a new window Tableau PublicOpens in a new window LinkedInOpens in a new window X ProfileOpens in a new window BlogOpens in a new window
Languages
English
Talk to me about...
- Dashboard Design and Storytelling
- Creativity
- Personal Development
Jennifer is a freelance Data Analyst passionate about data visualization and creating dashboards that transform complex data into clear, engaging stories. Since beginning her Tableau journey in 2024, her visualizations have been recognized as Viz of the Day twice. She volunteers with the Lagos Tableau User Group and has trained and supported aspiring data professionals, helping them build practical skills and find their footing in the field. She also writes about Tableau and data visualization on Medium. Outside of data, she enjoys watching movies and maintaining a healthy work-life balance.

Jeremy Knott
Opens in a new window Opens in a new window Opens in a new window
Social Accounts
Slack ProfileOpens in a new window Tableau PublicOpens in a new window LinkedInOpens in a new window TrailblazerOpens in a new window
Languages
English
Talk to me about...
- Dashboard design and effective data storytelling
- Tableau governance, performance, and scalable best practices
I’ve been using Tableau for nearly seven years, turning complex data into clear, engaging stories. My work spans dashboard design, data-source strategy, advanced calculations, spatial analytics, and Tableau governance. I especially love wireframing new ideas and using entertainment and sports data to create compelling visual stories. As a two-time Tableau Conference presenter, I enjoy sharing practical solutions, participating in Tableau User Groups, and connecting with the wider DataFam.

Jessica Bautista Gauna
Opens in a new window Opens in a new window
Social Accounts
Tableau PublicOpens in a new window LinkedInOpens in a new window BlogOpens in a new window
Languages
English, French, Spanish
Jessica is the co-owner of Ladataviz, a data visualization consultancy that helps clients build complex visualizations with ease by developing tools in Tableau. She is passionate about product development, consulting, and the freedom of working remotely. As a Tableau Ambassador, she loves empowering others to shape their own data journeys. Outside of work, she loves spending time with her partner, whether traveling, enjoying good food, or engaging in outdoor activities together.

Jessica Moon
Opens in a new window Opens in a new window
Social Accounts
Tableau PublicOpens in a new window LinkedInOpens in a new window
Languages
English
Talk to me about...
- Tableau calculations
- Map layers
Jessica Moon first discovered Tableau in 2014 while working in a data science testing role. Seven years ago, she transitioned to developing and has had the pleasure of working with Tableau on a daily basis ever since! Jessica was a 2024 Iron Viz finalist and has received #VizOfTheDay eight times. She enjoys creating visualizations on entertainment themes ranging from The Bachelor and Hart of Dixie to strategic playlists. Outside of vizzing, Jessica enjoys spending time with her three children and working out.

Jesús Zárate
Opens in a new window Opens in a new window
Social Accounts
Tableau PublicOpens in a new window LinkedInOpens in a new window YouTubeOpens in a new window
Languages
English, Portuguese, Spanish
Talk to me about...
- Automatización
- Agentes IA
Jesús Zárate | Jefe de Finanzas en APOYO Comunicación (Lima). Combino gestión financiera y analítica. Estudios: Negocios Internacionales con MBA. Logro clave: Diseñé la estructuración de datos en paneles y optimicé flujos, ahorrando +$6,000 mensuales. Especialidades: Datos, finanzas y automatización. Metas: Me preparo para casarme y aspiro a enseñar en la universidad. Intereses: Fútbol, bicicleta, guitarra y anime.

Jim
Opens in a new window Opens in a new window
Social Accounts
Tableau PublicOpens in a new window LinkedInOpens in a new window TrailblazerOpens in a new window X ProfileOpens in a new window YouTubeOpens in a new window BlogOpens in a new window
Languages
English
Talk to me about...
- Joining a TUG
- Getting Started in the Community
Jim is a Hall of Fame Tableau Visionary and multi time Ambassador with more than a decade of expertise. Co-founder of the Tableau Newbie User Group and author of this blog dedicated to helping new users develop robust Tableau skills, featuring notable series such as “Zero to Zen” and “Beyond Getting Started.” See his blog at https://jimdehner.com/

Jinseong Heo
Opens in a new window Opens in a new window Opens in a new window
Social Accounts
Slack ProfileOpens in a new window Tableau PublicOpens in a new window LinkedInOpens in a new window TrailblazerOpens in a new window GithubOpens in a new window BlogOpens in a new window
Languages
English, Korean
Talk to me about...
- Tableau + AI: MCP, extensions, and agentic analytics
- Tableau as entertainment: viz that performs, not just reports
- Point, line, and plane: the visual grammar behind every Tableau mark
I'm Jinseong Heo, working across data analysis and data education. I run Data Learners, where I teach data analytics to university students, job seekers, and companies. Over the past year I've taught Tableau to over 1,000 learners in analytics bootcamps and corporate programs, and spoke at the Seoul Tableau User Group on "Tableau – Point, Line, and Plane" and the Tableau + AI Hackathon. I recently reached the Viz Games finals at DataFam Seoul 2026. I believe viz should be useful and fun. Talk to me about chart design, playful data, or teaching Tableau to beginners.

Johan de Groot
Opens in a new window Opens in a new window Opens in a new window
Social Accounts
Slack ProfileOpens in a new window Tableau PublicOpens in a new window LinkedInOpens in a new window TrailblazerOpens in a new window GithubOpens in a new window BlogOpens in a new window
Languages
Dutch, English
Talk to me about...
- Everything Tableau - from Calculations and Dashboards to API's
- Data Visualisation Best Practices
- Tableau Extensions
Johan de Groot is a Data Visualization Analyst at his company Antichaos. With a strong technical foundation and deep expertise in Tableau, he specializes in turning messy, complex data into clear and actionable insights. Beyond the technology, he enjoys finding creative ways to solve challenges - combining dataprep, analysis, and visual design to turn complex problems into clear solutions. A dedicated Tableau community member, Johan actively shares his knowledge and ideas through training, workshops, and his blog, helping others strengthen their data skills and analytics practices.

Johan Yu
Social Accounts
LinkedInOpens in a new window TrailblazerOpens in a new window X ProfileOpens in a new window BlogOpens in a new window
Languages
English
Talk to me about...
- CRM Analytics
- Salesforce
- Data
Johan Yu is a Salesforce MVP, CRM Analytics book author, Salesforce blogger, and decade-long Salesforce User Group Leader. With extensive experience in analytics, data visualization, and marketing technology, he empowers businesses to transform data into actionable insights. Johan is passionate about fostering community learning and advancing the adoption of Salesforce and CRM Analytics across the ecosystem.

John Johansson
Opens in a new window Opens in a new window Opens in a new window
Social Accounts
Slack ProfileOpens in a new window Tableau PublicOpens in a new window LinkedInOpens in a new window TrailblazerOpens in a new window GithubOpens in a new window X ProfileOpens in a new window
Languages
English, Spanish
Talk to me about...
- Dashboard Design
- AI-Enablement in Data Engineer & Business Intelligence
- Dashboard Documentation
John Johansson is a Business Intelligence Leader and hands-on developer with 12 years building analytics that scale. He is known for his dashboard designs and the innovative, sometimes hacky, solutions behind them. At JPMorganChase he pushes the boundaries of design and automation while navigating where AI meets BI workflows. John is an advocate for personal growth and developer collaboration: co-leading the Financial Services TUG, running BI communities of practice inside his firm, and publishing design guides on Tableau Public. Outside of work, he enjoys baseball, sci-fi, and kayaking.

John Whitmer
Opens in a new window Opens in a new window Opens in a new window
Social Accounts
Slack ProfileOpens in a new window Tableau PublicOpens in a new window LinkedInOpens in a new window X ProfileOpens in a new window
Languages
English
Talk to me about...
- Best practices
- Business dashboard design
- Pre-attentive attributes
John is a Tableau Ambassador, co-leader of the Boston Tableau User Group, and a seasoned analytics leader with over two decades of experience driving data culture. Throughout his career, including founding Tableau Center of Excellence at Teradyne and the Staples Viz Club, he has championed self-service analytics and visual best practices. A passionate advocate for data literacy, John bridges technical mastery with community leadership to empower analysts across the Boston region and beyond.

Joon Kim
Opens in a new window Opens in a new window
Social Accounts
Tableau PublicOpens in a new window LinkedInOpens in a new window
Languages
English, Korean
Talk to me about...
- Tableau Calculations
- Tableau Dashboard Development
- AI
Joon Kim is a senior data visualization specialist working for an insurance organisation in Australia, who also has experiences in telecommunications and retail industry. Joon is a Tableau enthusiast who enjoys nothing more than helping others better understand data through visualization and collaborating with members of the Tableau Community to learn and grow together. Joon is a co-host of the Sydney Tableau User Group and the Tableau + Coffee Meetup in Sydney.

Jordan Woods
Opens in a new window Opens in a new window
Social Accounts
Slack ProfileOpens in a new window LinkedInOpens in a new window GithubOpens in a new window BlogOpens in a new window
Languages
English
Talk to me about...
- REST APIs
- Metadata API
- Hyper API
Jordan has been working in data for about 10 years, and has a passion for using data and Python to solve problems. He is a Tableau certified data analyst, regular contributor to tableauserverclient, and can be found on the Tableau DataDev slack group, where he answers questions about the various Tableau APIs.

Joshua Vijeh
Social Accounts
LinkedInOpens in a new window GithubOpens in a new window BlogOpens in a new window
Languages
English
Talk to me about...
- Tableau Model Context Protocol (MCP)
- Tableau APIs
- Tableau Prep
Josh has carried his passion for data and analytics across multiple careers. From teaching mathematics to working in audit and finance, and now in higher education, his drive to make data accessible has been a constant theme. He serves as Manager of Financial Applications for Stanford’s Department of Medicine, focusing on clinical reporting, system development, and automation. Josh is an active member of the DataDev community, committed to making data approachable for people of all backgrounds. When not immersed in Tableau, Josh enjoys music production and following his favorite sports teams.

Joti Gautam
Opens in a new window Opens in a new window Opens in a new window
Social Accounts
Slack ProfileOpens in a new window Tableau PublicOpens in a new window LinkedInOpens in a new window
Languages
English, Gujarati, Hindi, Punjabi
Talk to me about...
- Tableau Dashboard Design
- Tableau MCP
- Future of Data Analytics
Joti Gautam is a Senior Associate at JPMorgan Chase with 10 years of experience in Data Analytics and Visualization across Wealth Management, Investment Banking, Consumer Banking, and Corporate Real Estate. A passionate data storyteller, she is returning for her sixth term as a Tableau Ambassador and co-leads the Mumbai Tableau User Group. A Featured Author and 4× Viz of the Day, she enjoys sharing her passion through Tableau Public, mentoring, and community projects. Outside data, she loves reading, strength training, painting, and travelling.

JT Thazhathel
Opens in a new window Opens in a new window
Social Accounts
Slack ProfileOpens in a new window LinkedInOpens in a new window
Languages
English
Talk to me about...
- Teaching Data Viz
- Developing Assignments
- Data Literacy
Hi, I'm JT Thazhathel! I'm currently a professor teaching in the Accounting Department at the LeBow College of Business at Drexel University. Prior to teaching full-time, I worked at companies like BlackRock, DuPont, Penn Medicine and the Wharton School. I bring 13 years of experience in accounting and finance roles with a focus on analytics and automation. I started using Tableau in 2014 in industry and now, I am able use the tool to teach data viz and data literacy within various courses here at Drexel for undergrads and grads.

Jula Jiratrakanvong
Opens in a new window Opens in a new window
Social Accounts
Slack ProfileOpens in a new window Tableau PublicOpens in a new window YouTubeOpens in a new window BlogOpens in a new window
Languages
English, Thai
Talk to me about...
- Visualization
- Research
- AI use cases
Jula is a data strategist and visualization enthusiast who began his career as an architect before transitioning into the world of data. He founded Viz Craft Studio, a Thai data community and YouTube channel, to make data, visualization, and AI more accessible and practical. He enjoys exploring how data can help people understand complex ideas, make better decisions, and communicate more effectively. He believes that meaningful impact often starts small—with curiosity, shared knowledge, and a community that learns and grows together.

Julia Buechting
Opens in a new window Opens in a new window
Social Accounts
Tableau PublicOpens in a new window LinkedInOpens in a new window BlogOpens in a new window
Languages
English, German
Talk to me about...
- Art
- Painting
- Parenting
From Artist to Data Artist: When Julia discovered Tableau in 2019 she changed her career completely from sculpting statues to creating line charts. She is a product owner at Škoda Auto. There she is master of car- and customer data, which she funnels into Data Cloud to use in Tableau Analytics. She loves organizing TUG Munich and TUG Frankfurt events and co-leads the Data+Women Germany chapter with Heidi Kalbe. If she is afk, you can find her in her art studio, painting or nerding about pigments.

Karrie Cardiff
Opens in a new window Opens in a new window Opens in a new window
Social Accounts
Slack ProfileOpens in a new window Tableau PublicOpens in a new window LinkedInOpens in a new window
Languages
English
Talk to me about...
- Enterprise Deployment & Tool Administration Strategy
- Data Storytelling & Engaging Analytics
- Building & Championing Data Communities
Data Visualization Manager with a passion for building intuitive enterprise analytics and fostering data communities. Known as a BI data training champion, Karrie specialize in bridging the gap between technical architecture and clear, impactful data storytelling. Karrie co-leads the Seattle Tableau User Group. Outside of designing scalable dashboard solutions and leading data events, you can find Karrie tackling CrossFit workouts, listening to audio podcasts, or enjoying a glass of wine at a local cafe. Excited to connect, mentor, and share ideas with the #DataFam as a Tableau Ambassador!

Kat Rocha
Opens in a new window Opens in a new window Opens in a new window
Social Accounts
Slack ProfileOpens in a new window Tableau PublicOpens in a new window LinkedInOpens in a new window BlogOpens in a new window
Languages
Spanish
Talk to me about...
- Claude / AI
- Design Best Practices
- Outdoor / Nature
Kat Rocha is a Senior BI Developer whose work combines analytics, design, and storytelling to turn complex healthcare data into intuitive tools that drive better decisions. Her work focuses on denial prevention, scalable data solutions, and AI-powered automation to improve efficiency and scale workflows. Outside of work, she enjoys traveling, exploring the outdoors, discovering new music, and taking on ambitious DIY projects (like remodeling a campervan !)

Katie Kilroy
Opens in a new window Opens in a new window Opens in a new window
Social Accounts
Slack ProfileOpens in a new window Tableau PublicOpens in a new window LinkedInOpens in a new window TrailblazerOpens in a new window GithubOpens in a new window BlogOpens in a new window
Languages
English
Katie is an experienced and curious data leader with a background in Data Operations, Sales Operations, and HR Operations. She has been an Ambassador since 2021 and enjoys engaging with the Community and helping folks out with their Tableau-related challenges. She enjoys participating in community data projects when time allows and continues to build out her own knowledge around the data space as it evolves.

Kayla Swain
Opens in a new window Opens in a new window
Social Accounts
Tableau PublicOpens in a new window LinkedInOpens in a new window
Languages
English
Talk to me about...
- Advanced Calculations
- Dashboard Design
Kayla has been a Tableau user for 10 years- first drawn to the platform’s ability to communicate data with a compelling narrative. Working with Tableau combined a love for numbers with the opportunity to explore data in a creative way. Kayla joined Tableau Public to help grow her design skills. She is a 2-time recipient of Viz of the Day. She is also a co-lead for the San Diego TUG. Kayla is a Healthcare BI Analyst, where data is used to improve patient outcomes.

Kazuhiro Aoki
Opens in a new window Opens in a new window Opens in a new window
Social Accounts
Slack ProfileOpens in a new window Tableau PublicOpens in a new window LinkedInOpens in a new window TrailblazerOpens in a new window X ProfileOpens in a new window BlogOpens in a new window
Languages
English, Japanese
Talk to me about...
- Data-driven Culture
- Data Art
- Entertainment
I’m a Data Analyst and Tableau Server Administrator on the Data Science team at an entertainment company in Kansai, Japan. As a DATA Saber, I’m actively involved in the Tableau Community, working to make the community in Kansai more welcoming, approachable, and accessible especially for beginners. I organize and support a variety of community activities, including DATA Saber Camp in Kansai, Kansai DATA Saber Link, Kansai Tableau Uma-Uma Group, and Tableau Osaka Loop Line Walking Group, with a focus on bringing the Tableau community closer to the local culture and community.

Kelsey Oehrke
Opens in a new window Opens in a new window
Social Accounts
Tableau PublicOpens in a new window LinkedInOpens in a new window
Languages
English
Talk to me about...
- Dashboard Design 🌈
- Data Storytelling 📚
- Dynamic Visualization 🔍
Kelsey Oehrke is a Denver based Senior Data Analyst and Tableau enthusiast who loves bringing creativity and storytelling to data. Her Tableau journey began through her work and grew into a passion for data visualization, design, and the Tableau community. She’s passionate about learning from others, experimenting with new ideas, and making data more engaging and approachable. Over the past year she has been recognized as a 2026 DataFam Rising Star, earned 3 VOTDs, had her work featured at 2026 Tableau Conference, and started co-leading the Denver TUG.

Ken Flerlage
Opens in a new window Opens in a new window Opens in a new window
Social Accounts
Slack ProfileOpens in a new window Tableau PublicOpens in a new window LinkedInOpens in a new window TrailblazerOpens in a new window GithubOpens in a new window X ProfileOpens in a new window YouTubeOpens in a new window BlogOpens in a new window
Languages
English
Talk to me about...
- Tableau Desktop
- Tableau Cloud/Server
- Tattoos ;)
Ken Flerlage is a Tableau Evangelist and Consultant at Moxy Analytics (www.moxyanalytics.com), where he helps clients to solve problems with data. He is an active member of the Tableau community, a Tableau Ambassador, and a member of the Tableau Visionary Hall of Fame. He spends his time answering questions on the forums, engaging in dataviz discussions on social media, and blogging on flerlagetwins.com, a site that he shares with his identical twin brother and fellow Tableau Visionary, Kevin Flerlage.

Kevin Flerlage
Opens in a new window Opens in a new window Opens in a new window
Social Accounts
Slack ProfileOpens in a new window Tableau PublicOpens in a new window LinkedInOpens in a new window YouTubeOpens in a new window BlogOpens in a new window
Languages
English
Talk to me about...
- Tableau Desktop
- Calculations
- Design
Kevin Flerlage is a Tableau Evangelist / Data Visualization Consultant at Moxy Analytics, where he helps clients to solve problems with data. Kevin is a Hall of Fame Tableau Visionary (one of less than 50 in the world) and is an active member of the Tableau Community. He frequently blogs about Tableau on flerlagetwins.com, a site that he shares with his identical twin brother and fellow Hall of Fame Visionary, Ken Flerlage. He is also a Tableau Public Ambassador, has five Iron Viz top ten finishes, and is the third most followed and third most favorited author on Tableau Public.

Kevin Katsuhiro Osabe
Opens in a new window Opens in a new window Opens in a new window
Social Accounts
Slack ProfileOpens in a new window Tableau PublicOpens in a new window LinkedInOpens in a new window TrailblazerOpens in a new window X ProfileOpens in a new window PodcastOpens in a new window
Languages
English, Japanese
Talk to me about...
- AI Adoption & Empowerment
- Data Culture & Data Literacy
- Community Building & Mentoring
Kevin is an IT professional in the manufacturing industry, currently focused on promoting the practical adoption of AI and data across the organization. As a Tableau Ambassador and Master of DATA Saber, he is passionate about helping people build confidence with data, learn from one another, and take on new challenges. Through mentoring, community activities, and speaking, he supports people in turning data and AI into better decisions and meaningful action.

Kevin Wee 黃克文
Opens in a new window Opens in a new window Opens in a new window
Social Accounts
Slack ProfileOpens in a new window Tableau PublicOpens in a new window LinkedInOpens in a new window X ProfileOpens in a new window YouTubeOpens in a new window
Languages
Chinese, English, Cantonese, Malay
Talk to me about...
- Data visualization
- Infographic design
- Dashboard UI
Kevin is a Visionary and an Ambassador who publishes vizzes with innovative design and functionality on his Tableau Public profile. His vizzes have been featured in Andy Kirk's Data Visualization handbook, on IMDb, on Tableau sites, and in the Tableau Conference Viz Gallery, to name a few. Kevin is known for his dashboard design talks, where he shows how to create Tableau vizzes with a strong UI. He is a Lead BI Analyst at Capital One, where he develops data tools for business analytics and provides Tableau training to employees. Kevin is also a runner-up in the 2026 Iron Viz contest.

Kim Tricker
Opens in a new window Opens in a new window
Social Accounts
Tableau PublicOpens in a new window LinkedInOpens in a new window X ProfileOpens in a new window BlogOpens in a new window
Languages
English
Talk to me about...
- Designing beautiful dashboards
Kim is a Senior Data Analyst at Cisco Meraki and has been a Tableau Ambassador since 2023. She has been passionate about data visualization and Tableau since 2016, and has since earned five Viz-of-the-Day recognitions, placed second in the North America region of the 2023 Iron Viz competition, and was named a Tableau Public Featured Author in 2020. Kim has built dashboards in various industries and for multiple companies, including Disney, ESPN, ADP, and the University of Virginia. Outside of Tableau, Kim enjoys playing tennis and traveling the world with her wife Maddie.

Kimberly Coutts
Opens in a new window Opens in a new window Opens in a new window
Social Accounts
Slack ProfileOpens in a new window Tableau PublicOpens in a new window LinkedInOpens in a new window X ProfileOpens in a new window
Talk to me about...
- Tableau Dashboard Design for Educational Institutions
- Mobile Dashboard Techniques
- Sankey Charts
Kimberly Coutts is a Research Analyst at MiraCosta College, where she's spent a decade using Tableau to turn data into insights that drive better student outcomes. Now in her second year as a Tableau Ambassador, Kimberly co-leads the California Community College Tableau User Group (CCCTUG), helping fellow analysts grow their skills and community. A three-time Viz of the Day winner, she loves data storytelling through personal projects on travel, true crime, and sports. Outside of Tableau, Kimberly is a competitive archer, bringing the same focus to the range as she does to her dashboards.

Kimly Scott
Opens in a new window Opens in a new window Opens in a new window
Social Accounts
Slack ProfileOpens in a new window Tableau PublicOpens in a new window LinkedInOpens in a new window YouTubeOpens in a new window BlogOpens in a new window
Languages
English
Kimly is a 4x Tableau Visionary, 6x Tableau Ambassador, co-lead for the Melbourne Tableau User Group, founder of she will viz and co-lead for Unfinished Vizness. She was also a global Iron Viz finalist for 2022, placing second and holds 20 Viz of the Days. Kimly is based in Melbourne/Naarm, Australia and uses Tableau and data visualisation to highlight topics she is passionate about.

Kirk Munroe
Opens in a new window Opens in a new window Opens in a new window
Social Accounts
Slack ProfileOpens in a new window Tableau PublicOpens in a new window LinkedInOpens in a new window TrailblazerOpens in a new window YouTubeOpens in a new window BlogOpens in a new window
Languages
English
Talk to me about...
- Data Modeling
- Knowledge Graph
- AI
Kirk Munroe is the Founder & Principal Consultant at Paint with Data Inc., helping organizations maximize their Tableau and Salesforce Data Cloud investments. Author of Data Modeling in Tableau and a three-time Tableau Ambassador, he is recognized for his expertise in semantic models, scalable architectures, and enablement. A leader in the #DataFam, Kirk empowers teams to use their data with confidence and creativity.

Koharu Higashiura
Opens in a new window Opens in a new window
Social Accounts
Slack ProfileOpens in a new window Tableau PublicOpens in a new window X ProfileOpens in a new window BlogOpens in a new window
Languages
Japanese
In my day job, I work in a division that promotes Tableau adoption across the organization. Alongside this, I lead the marketing team at "Japan Tableau User Group" (JTUG), running our official X account and connecting Tableau communities. As a "DATA Saber Council Promotion Order", I also manage DATA Saber's official X account, working toward a world of 10,000 DATA Sabers. As a Tableau Ambassador, I want to keep running both accounts to spread Tableau's appeal and help others feel the same sense of connection and warmth I've found in this community.

Kotaro Shibata
Opens in a new window Opens in a new window Opens in a new window
Social Accounts
Slack ProfileOpens in a new window Tableau PublicOpens in a new window LinkedInOpens in a new window X ProfileOpens in a new window BlogOpens in a new window
Languages
Japanese
In 2024, I was selected as a Tableau Academic Ambassador, followed by selection as a Tableau Ambassadors in 2025, marking my third consecutive year and third overall selection this year. As a supporter of the Japan Tableau User Group, I serve as a personality for "Tab-Radio" ("Tab-Raji"), an online show designed to deliver learning and topics about Tableau in an enjoyable way. Additionally, as an organizer of the Hokuriku Tableau User Group, I host events aimed at spreading a data-driven culture throughout the Hokuriku region.

Kristi Brown
Opens in a new window Opens in a new window
Social Accounts
Slack ProfileOpens in a new window LinkedInOpens in a new window TrailblazerOpens in a new window X ProfileOpens in a new window BlogOpens in a new window
Languages
English
Talk to me about...
- CRM Analytics
- Tableau Next
- Data Architecture
Kristi Brown is a Salesforce Solution Architect, 4x Salesforce MVP, and Tableau Ambassador with 15 years of experience across the Salesforce ecosystem. She loves helping people turn complex data and technology into solutions that actually make sense. A longtime community leader and speaker, Kristi is passionate about analytics, AI, architecture, and making technical concepts approachable, and maybe even a little fun.

KT
Opens in a new window Opens in a new window
Social Accounts
Tableau PublicOpens in a new window LinkedInOpens in a new window X ProfileOpens in a new window YouTubeOpens in a new window BlogOpens in a new window
Languages
English, Japanese
Talk to me about...
- Visual Analytics
- Dashboard Design
As Community Lead at Canva Japan, KT builds communities that carry design's power forward — supporting educators and Canva Creators, and helping launch Canva's first community for business users worldwide. KT founded DATA Saber, a 90-day program teaching business users why design matters in data visualization, built so its community passes on that value and culture itself. It has produced 3,800+ graduates, a rare feat globally. KT believes a product's vision spreads only through community, and has driven that culture at Tableau and Snowflake. Author of "The Art of Data-Driven."

Külli Esko
Opens in a new window Opens in a new window Opens in a new window
Social Accounts
Slack ProfileOpens in a new window Tableau PublicOpens in a new window LinkedInOpens in a new window
Languages
English, Estonian
Talk to me about...
- Tableau Calculations
- Data visualization and dashboard development ideas
- Look & feel of dashboards
My Tableau journey began in May 2017, when I was looking for software to automate reporting. It was love at first sight, followed by years of self-learning with invaluable help from DataFam. Joining Andy Kriebel’s Next-Level Tableau in 2024 took my skills to a whole new level, while committing to Makeover Monday in 2026 gave my creativity another huge boost. Throughout my career, I’ve also loved teaching and supporting others, sharing tips, tricks and best practices - raising the bar for everyone is a win for us all!

Kyle Cruickshanks
Social Accounts
LinkedInOpens in a new window TrailblazerOpens in a new window YouTubeOpens in a new window BlogOpens in a new window
Languages
English
Talk to me about...
- Data Cloud
- Tableau Next
- CRM Analytics
Kyle is the Business Intelligence (BI) Practice Lead at Ateko (formerly CloudKettle). He has 9+ years of experience leading teams that help clients leverage data +AI to improve processes and decision making. He holds multiple Salesforce certifications and has spoken at Dreamforce on CRM Analytics. Kyle holds a passion for helping others grow and succeed in their professional journeys. He was a member of the Trailblazer mentorship program and a longstanding member in the Ten Thousand Coffees program. Kyle is excited to continue inspiring others and promoting data driven decision making as

Kyle Yetter
Opens in a new window Opens in a new window Opens in a new window
Social Accounts
Slack ProfileOpens in a new window Tableau PublicOpens in a new window LinkedInOpens in a new window X ProfileOpens in a new window
Languages
English, Spanish
Kyle Yetter is a Sr Mgr, Data & Reporting Analytics at Ancestry who aims to make decision making easier for the executives he works with by having the relevant data ready for them when they need it in a way that allows for actionable insight. Lately, he's been exploring how Model Context Protocol (MCP) and AI can transform existing Tableau metrics and workbooks into a rich business knowledge layer, laying the groundwork for secure, governed, and direct headless BI. Kyle loves being involved in the Tableau community and is a co-lead for the Workout Wednesday community initiative.

Lauren Cristaldi
Opens in a new window Opens in a new window
Social Accounts
Tableau PublicOpens in a new window LinkedInOpens in a new window TrailblazerOpens in a new window GithubOpens in a new window
Talk to me about...
- Tableau advanced dashboard formatting
- Tableau prep flows
- Tableau viz extensions
I currently manage the data analytics team at XeoMatrix, where I have worked as a consultant for the past 4 years. I have been developing in Tableau for almost 10 years. I started my career in the public sector, but have worked across so many industries as a consultant. I founded/lead the Charleston Tableau User Group and the Data Driven Community monthly webinar series. Data is everything and the Tableau Community is the reason I'm still this excited about it - also why I even build dashboards on the weekends just for fun.

Lauren Mills
Opens in a new window Opens in a new window
Social Accounts
Slack ProfileOpens in a new window LinkedInOpens in a new window TrailblazerOpens in a new window
Languages
English
Talk to me about...
- Data Orchestration
- Governance
- Enterprise data & analytics strategy
Lauren is a Houston based technology leader of 15+ years with experience driving enterprise business systems, cross-platform integrations, and data & analytics strategy. Her work bridges technical architecture and business value, translating complex data investments into executive level decisions on growth, risk, and AI-enabled transformation. This is her 5th year as a CRM Analytics / Tableau Ambassador and her 12th year leading the Salesforce Architect User Group.

Lawrence Durbin
Opens in a new window Opens in a new window
Social Accounts
Tableau PublicOpens in a new window LinkedInOpens in a new window TrailblazerOpens in a new window
Languages
English
Talk to me about...
- Data Visualization
- Building Data Communities
- People Analytics
Lawrence (He/Him/His) is a Business Intelligence Analyst, DEI Advocate, and co-lead of multiple Tableau Community initiatives. While having only used Tableau for 7 years his career in data started over a decade ago and includes work with an array of data including technical support, People/HR, Learning & Development, DEI, and more. Additionally, Lawrence focuses on engaging data, AI/ML, & leadership teams on understanding inherent biases in their systems. All this driven by a core belief that groups, teams, and cultures that have multiple diverse perspectives and provide the safety for its m

Le Luu
Opens in a new window Opens in a new window
Social Accounts
Tableau PublicOpens in a new window LinkedInOpens in a new window GithubOpens in a new window BlogOpens in a new window
Languages
English, Vietnamese
Talk to me about...
- DataDev
- Tableau APIs
- AI
Le is an Analytics Engineer at The Information Lab U.S. with a background in Computer Science, specializing in data analytics, data engineering, automation, and workflow optimization. He works with SQL, Python, Tableau, Alteryx, and cloud data platforms to build scalable data pipelines and transform complex data into actionable insights. Passionate about AI, Tableau APIs, and programming. Le also shares knowledge through blogs, presentations, and contributions to the data community.

Li-Lun (涂立倫) Tu
Opens in a new window Opens in a new window
Social Accounts
Tableau PublicOpens in a new window LinkedInOpens in a new window YouTubeOpens in a new window
Languages
Chinese, English
Li-Lun Tu is a Data Visualization Designer at Caterpillar Inc., a 3x Tableau Ambassador, and the creator of the YouTube channel 道聽圖說 VizWithTu (@VizWithTu), where he shares practical Tableau and data visualization knowledge with Mandarin-speaking users. His mission is to bridge the knowledge gap between English- and Mandarin-speaking data communities. He advocates for integrating design thinking and prototyping into dashboard development to create more effective, user-centered analytics.

Ligia Galvao
Opens in a new window Opens in a new window Opens in a new window
Social Accounts
Slack ProfileOpens in a new window Tableau PublicOpens in a new window LinkedInOpens in a new window
Languages
English, Portuguese
Talk to me about...
- Dataviz
- Tableau Next
I’m Ligia Galvão, a data analytics leader passionate about turning data into meaningful stories and building communities. My Tableau journey has taken me from creating impactful visualizations to becoming a 6-time Tableau Ambassador. Along the way, I’ve led and supported data communities in Brazil and New York, helping others learn, connect, and grow. Tableau has been more than a tool! It has been a platform for storytelling, leadership, and meaningful connections.

Lilla Rasztik
Opens in a new window Opens in a new window Opens in a new window
Social Accounts
Slack ProfileOpens in a new window Tableau PublicOpens in a new window LinkedInOpens in a new window GithubOpens in a new window BlogOpens in a new window
Languages
Dutch, English, Hungarian
Talk to me about...
- Visualization design
- Storytelling
I’m Lilla Rasztik—a Lead BI Analyst and data enthusiast in Amsterdam, and a returning Tableau Ambassador. While my day job uses other BI tools, Tableau Public remains my creative playground. I turn hobbies, habits and everyday moments into visual stories that make data personal, playful and meaningful. With multiple Viz of the Day features, I love exploring new ways to create—and sharing that inspiration with the #DataFam.

Lisa Hitch
Opens in a new window Opens in a new window Opens in a new window
Social Accounts
Slack ProfileOpens in a new window Tableau PublicOpens in a new window LinkedInOpens in a new window TrailblazerOpens in a new window GithubOpens in a new window
Languages
English, German
Talk to me about...
- Tableau Tips
- Teaching
- Public Health
Lisa coaches data consultants at The Information Lab, teaches data visualization and storytelling at Columbia University, and co-leads the Data+Women NYC TUG. She is also a PhD candidate in public health, researching how people use GenAI to access health information. You may know her as "The Data Coach" on LinkedIn, Instagram, and TikTok, where she shares Tableau tips and career advice for people in data. In her free time, she's taken up flying trapeze and aerials.

Lisa Trescott
Opens in a new window Opens in a new window
Social Accounts
Tableau PublicOpens in a new window LinkedInOpens in a new window BlogOpens in a new window
Languages
English
Talk to me about...
- Dynamic Zone Visibility
- Paramaters
- Actions
Lisa Trescott is a research analyst at MiraCosta College, where she supports the efforts of the college’s student equity and achievement programs. She began using Tableau in 2017 and was immediately hooked. She was the Iron Viz Global Champion in 2021, is a Tableau Ambassador, and co-leads the Tableau Public TUG and California Community Colleges TUG. When not playing with data, you can find Lisa at the beach, hiking, or playing with her son and her cats.

Lorna
Opens in a new window Opens in a new window
Social Accounts
Tableau PublicOpens in a new window LinkedInOpens in a new window BlogOpens in a new window
Languages
English
Talk to me about...
- Workout Wednesday
- Table Calcs & LODs
- Conversational Analytics
Lorna is a Data School Coach in London who's trained 300+ analysts in Tableau. She started as a Data Schooler herself back in 2015, and these days co-leads Workout Wednesday, dabbles in AI and Conversational Analytics, and has finally made peace with Table Calcs after years of LOD-only loyalty. Author of the Tableau Desktop Cookbook (2021). When she's not coaching, you'll find her with her cats or watching rugby league.

Louis Yu
Opens in a new window Opens in a new window Opens in a new window
Social Accounts
Slack ProfileOpens in a new window Tableau PublicOpens in a new window LinkedInOpens in a new window TrailblazerOpens in a new window GithubOpens in a new window X ProfileOpens in a new window YouTubeOpens in a new window BlogOpens in a new window PodcastOpens in a new window
Languages
Chinese, English, Japanese
Talk to me about...
- Information Design and Dashboard
- AI
- Video Games
As part of the Visual Analytics 📊 team in 2K Games, Louis is the lead developer for many of their #videogames dashboards. Outside of work, he contributes actively to the global #datafam as one of the community leaders and drive projects like #GamesNightViz, Singapore TUG, Video Games 🎮 TUG, #SecretsOfTheViz and #FramesAndViz podcast. His constant strive for better design and human approach has won him multiple accolades for his work, including #VizOfTheDay and qualifying for Top 15 for #IronViz.

Ludmila Romanova
Opens in a new window Opens in a new window
Social Accounts
Tableau PublicOpens in a new window LinkedInOpens in a new window YouTubeOpens in a new window
Languages
English, Greek, Russian
Talk to me about...
- From Business Question to Tableau Dashboard
- Data Visualization & Storytelling
- Tableau Performance Optimization
A Business Intelligence and Finance professional, strategic problem solver, and data visualization enthusiast with 15+ years of experience. Tableau was my first BI tool - and remains my first love. I enjoy combining business acumen, technology, and creativity to turn complex problems into meaningful insights. My Tableau journey has grown from building dashboards to building community: sharing knowledge, learning from others, and connecting people through the Cyprus Tableau User Group.

Luigi Cicciari
San Diego Tableau User GroupOpens in a new window
Marketing and Market Research Tableau User GroupOpens in a new window
Opens in a new window Opens in a new window Opens in a new window
Social Accounts
Slack ProfileOpens in a new window Tableau PublicOpens in a new window LinkedInOpens in a new window X ProfileOpens in a new window BlogOpens in a new window
Languages
English
Talk to me about...
- Building & Growing Tableau Communities
- Getting Involved in the #DataFam
Luigi Cicciari is a passionate Tableau community leader who loves bringing people together, sharing knowledge, and helping others grow. He co-leads the San Diego and Marketing & Market Research Tableau User Groups and is serving his third year as a Tableau Ambassador. In 2025, he received the Michael W. Cristiani Community Leadership Award. Luigi is especially passionate about creating welcoming spaces, supporting the #DataFam, and using data and community to make a positive impact. Autism awareness is close to his heart, and flamingos tend to make an appearance too.

Madeline Cook
Opens in a new window Opens in a new window
Social Accounts
Slack ProfileOpens in a new window LinkedInOpens in a new window
Languages
English
Talk to me about...
- Tableau APIs + Scripted Governance
- Tableau Order of Operations
- My golden retriever, Juniper!
Madeline began her Tableau journey in 2018 at Fender Musical Instruments. There, she handled all facets of Tableau Server administration, dashboard development, and data architecture. She went on to support countless clients with Server to Cloud migrations as an InterWorks Analytics Architect. Nowadays, Maddy works as a Data Analysis Manager at Enact Mortgage Insurance. She happily spends her time optimizing Tableau compute in Snowflake, accelerating her admin duties with Tableau APIs, and strategizing governance frameworks for trusted analytics while supporting nearly 300 Tableau Cloud users.

Marcelo Has
Opens in a new window Opens in a new window Opens in a new window
Social Accounts
Slack ProfileOpens in a new window Tableau PublicOpens in a new window LinkedInOpens in a new window TrailblazerOpens in a new window GithubOpens in a new window X ProfileOpens in a new window YouTubeOpens in a new window BlogOpens in a new window
Languages
English, Portuguese, Spanish
Talk to me about...
- DataDev Stuff
- Dashboarding
- Design
Marcelo Has is a data lover passionate about helping people with their careers. He has extensive experience in various areas such as Data Product, Dashboard Design, Data Engineering, Data Visualization, Storytelling, and Web Development. He is 2x #VizOftheDay, and 5x Tableau Certified (Including Customer Success). Marcelo is one of the founders of the DataDevQuest, a Community initiative where experts publish Tableau API related challenges to help the community become more knowledgeable and build their own portfolio.

Marleen Meier
Opens in a new window Opens in a new window Opens in a new window
Social Accounts
Slack ProfileOpens in a new window Tableau PublicOpens in a new window LinkedInOpens in a new window GithubOpens in a new window BlogOpens in a new window
Languages
Dutch, English, German
Talk to me about...
- Writing Books
- Data / AI Governance
- Board Games
I started out in quantitative risk analytics and spent most of my carrer at ABN Amro Clearing Bank. Today I lead data governance at a reinsurer in Zurich, with a focus on data and AI literacy, because governance only works if it changes how people actually use data. I wrote the last four editions of Mastering Tableau, most recently the fifth in April 2026, co-led the Dutch Tableau User Group, and spoke at TC18. I've taught Tableau in Germany, the Netherlands, the US, Singapore and Switzerland. And I love board games.

Maryse Monen
Opens in a new window Opens in a new window Opens in a new window
Social Accounts
Slack ProfileOpens in a new window Tableau PublicOpens in a new window LinkedInOpens in a new window BlogOpens in a new window
Languages
Dutch, English, French, German
Talk to me about...
- Dashboard design & data storytelling
- Building data communities & knowledge sharing
- Data, business processes & analytics in real-world organisations
Maryse works at the intersection of data, technology and business, helping organisations turn data into practical solutions and make better decisions. Curious by nature, she enjoys turning complex questions into meaningful insights while connecting different perspectives. Currently working in the real estate sector, she is passionate about bringing data, processes and technology together. As a returning Tableau Ambassador, Maryse combines her experience in data and analytics with her passion for community building. She organises the Netherlands Tableau User Group and Data + Women Amsterdam.

Matt Francis
Opens in a new window Opens in a new window Opens in a new window
Social Accounts
Slack ProfileOpens in a new window Tableau PublicOpens in a new window LinkedInOpens in a new window X ProfileOpens in a new window BlogOpens in a new window
Languages
English
Talk to me about...
- Learning & Teaching
- Engagement
- Dashboard design
By day he works at one of the world's largest DNA sequencing labs, creating dashboards that enable the DNA sequencing pipelines to keep track of millions of DNA samples. Since installing Tableau 13 years ago, he has become a champion for Tableau within the institute and loves to share the good news of data viz to anyone who will listen. He is a co-founder of The Tableau Community Awards, The Vizzies and is a regular speaker at conference, known for his enormous slide decks and sense of humour.

Matt Huff
Opens in a new window Opens in a new window Opens in a new window
Social Accounts
Slack ProfileOpens in a new window Tableau PublicOpens in a new window LinkedInOpens in a new window BlogOpens in a new window
Languages
English
Talk to me about...
- Makeover Monday
- Retail and consumer goods
- Data science and AI
Matt Huff leads a data science team at H-E-B focused on advertising performance and measurement. He has nearly 15 years of analytics, consulting, and data science experience. When it comes to Tableau Matt has been leading a TUG for 2+ years and the Makeover Monday community project for 1 year. When not working on a viz, finding data for a viz, or building a community you can find him running, playing disc golf, playing games with his family, or pursuing creative endeavors.

Matt Lee
Opens in a new window Opens in a new window Opens in a new window
Social Accounts
Slack ProfileOpens in a new window Tableau PublicOpens in a new window LinkedInOpens in a new window X ProfileOpens in a new window
Languages
Chinese, English
Matt Lee is a Senior Data Analyst at Apple with over a decade of hands-on Tableau experience dating back to version 6.0, bringing a strong eye for visual design and UI/UX to his work. He leads the Bay Area Tableau User Group, where he's passionate about coaching and mentoring both newcomers and seasoned users. Outside of Tableau, Matt is an avid sports fan and a lifelong learner, and he's always on the hunt for the next great boba tea shop.

Matt Meier
Opens in a new window Opens in a new window Opens in a new window
Social Accounts
Slack ProfileOpens in a new window Tableau PublicOpens in a new window LinkedInOpens in a new window TrailblazerOpens in a new window
Languages
English
Talk to me about...
- Your favorite vizzes
- Data art
- The future of analytics
Matt is Director of Investment Data Operations & Visualization at Omnicom with 10 years of analytics experience. He resides in Nebraska with his wife and 2 sons. His data journey began in 2007 with a personal film log of every film he has watched, which continues to this day. Matt is an active member in the Tableau community, participating in Makeover Monday, Tidy Tuesday, Workout Wednesday, and Back 2 Viz Basics. He is a graduate of Northwest Missouri State and holds two master's degrees from Rockhurst in Data Analytics and Business Administration.

Matthias Giger
Opens in a new window Opens in a new window
Social Accounts
Tableau PublicOpens in a new window LinkedInOpens in a new window TrailblazerOpens in a new window
Languages
English, German
Talk to me about...
- Perception & efficient dashboard design
- ISO 24896 and Tableau
- Dashboarding
Matthias works as a Data Visualization Engineer in Zurich and was part of the editorial team that shipped the first ISO standard for business reporting (ISO 24896). He creates effective information products, semantic models, and business reports. His focus is on information-centric approaches. He loves to assist others with Tableau and other BI tools. Matthias believes in learning through experience and enjoys family life, as well as aromatherapy and phytotherapy.

Matz Rasmus
Opens in a new window Opens in a new window
Social Accounts
Slack ProfileOpens in a new window LinkedInOpens in a new window TrailblazerOpens in a new window
Languages
English, Finnish, Swedish
Talk to me about...
- Tableau Server maintenance
- Tableau Cloud
- Sailing
I began my data journey in 2014 productizing analytics for my company using Tableau. After that I have been a part of #datafam, and starting from 2019, I am working full time as Tableau consultant focusing on server and cloud administration, and any scripting around these. I try to keep up with the latest development by testing beta releases, and participating in prerelease testing whenever possible. When I am not prowling the Tableau Forums for new information, or someone I can help, I like to be out on, or by the sea. This is my 6th year as aTableau Ambassador

Maureen Okonkwo
Opens in a new window Opens in a new window Opens in a new window
Social Accounts
Slack ProfileOpens in a new window Tableau PublicOpens in a new window LinkedInOpens in a new window GithubOpens in a new window X ProfileOpens in a new window
Languages
English
Talk to me about...
- Tableau Model Context Protocol (MCP)
- Dashboard design
- AI Agents & Advanced Analytics Workflows
Data tells a story, but community brings it to life. Leading the Lagos Tableau User Group has shown me firsthand how much further we go when we learn together. Today, I'm deeply focused on the intersection of modern AI, MCP, and analytics, helping others discover how emerging tech can elevate their workflows and dashboards.

Maxime Baux
Opens in a new window Opens in a new window Opens in a new window
Social Accounts
Slack ProfileOpens in a new window Tableau PublicOpens in a new window LinkedInOpens in a new window YouTubeOpens in a new window
Languages
English, French
Talk to me about...
- Tableau User Groups
- Data modeling
- Freelancing
Maxime is a Freelance Data visualization & Analytics Consultant with a strong experience working with Data. He helps his customers to use and adopt data analytics tools by providing trainings, coaching sessions as well as by delivering bespoke solutions. Passionate about knowledge sharing and speaking, he helped creating "Le French TUG", a French speaking Tableau user Group where experts share their knowledge and tips. Apart from working on advanced Tableau calculations and problem solving, Maxime also loves to meet new people,travel the world and discover new sports. Feel free to reach out

Mayu Tanaka
Opens in a new window Opens in a new window
Social Accounts
Slack ProfileOpens in a new window Tableau PublicOpens in a new window X ProfileOpens in a new window BlogOpens in a new window
Languages
Japanese
Talk to me about...
- Data & Digital Marketing
I’ve been using Tableau for nearly 10 years, and I still love it as much as ever. I became a DATA Saber in 2025 and have been active in the Tableau Community in Japan, including leading the 2025 JTUG General Meeting and mentoring in DATA Saber - Chonaikai. I’ve attended Tableau Conference two years in a row and shared my experiences at Agentforce World Tour Tokyo. As a longtime Tableau fan, I’m truly excited to connect with the DataFam as a Tableau Ambassador.

Michael Hesser
Opens in a new window Opens in a new window
Social Accounts
Slack ProfileOpens in a new window LinkedInOpens in a new window TrailblazerOpens in a new window
Michael Hesser is a 6x Tableau Ambassador but his two cats (Earl and Gingko) are patently unimpressed. He loves solving challenging questions and discussing the importance of Design (with a capital "D") from both aesthetic and biological perspectives. Everything he knows comes from great mentorship and goofing up-- a lot! Hang around long enough and you're certain to hear ask how one eats an elephant (A: one bite at a time) or say "Don't let the pigeon drive the bus!"

Michael McCusker
Opens in a new window Opens in a new window Opens in a new window
Social Accounts
Slack ProfileOpens in a new window Tableau PublicOpens in a new window LinkedInOpens in a new window GithubOpens in a new window BlogOpens in a new window
Languages
English
Talk to me about...
- Dynamic Zone Visibility and Map Layers
- Rest API and Cloud Administration
- AI and Viz Extensions
Michael is a Tableau Tech Lead in health care, where he trains and mentors analysts as they grow their data and Tableau skills. He has been building in Tableau since 2020 and co-leads the San Diego Tableau User Group and the LGBTQ+ DataPride Tableau User Group and a frequent presenter on other TUG events. He is a 2x Viz of the Day author and spoke at Tableau Conference 2026. Dynamic Zone Visibility and Map Layers are his favorite features, and lately he has been exploring the ways AI can help Tableau developers build better.

Michelle Frayman
Opens in a new window Opens in a new window Opens in a new window
Social Accounts
Slack ProfileOpens in a new window Tableau PublicOpens in a new window LinkedInOpens in a new window TrailblazerOpens in a new window
Languages
English
Talk to me about...
- Feedback
- Getting involved in the community
- Iron Viz
Michelle started using Tableau Public at the end of 2018 to participate in #MakeoverMonday. She loves to participate in Iron Viz, provide feedback to the community and usually vizzes about topics in her everyday life and engages with the data community on Bluesky at @maf2k. She is a two-time Visionary and has been a Tableau Ambassador since 2019. Her favorite part of Tableau Public is that it is available to anyone to use. When not vizzing she enjoys spending time with her family cooking, skiing, camping, and playing ultimate Frisbee.

Mike Komer
Opens in a new window Opens in a new window Opens in a new window
Social Accounts
Slack ProfileOpens in a new window Tableau PublicOpens in a new window LinkedInOpens in a new window GithubOpens in a new window
Languages
English
Talk to me about...
- Tableau API Integrations
- Tableau MCP
- Data and AI
Mike is a big data nerd and Analytics Engineer. Having worked in a variety of industries such as Legal Solutions, FinTech, and currently Supply Chain, Mike has become fluent in the universal language of business data and adapting tools around them. Mike is incredibly proud and excited to be part of the DataDev Ambassadors for another year, further engage with the community, and continue to push the limits and capabilities of the Tableau Apps and surrounding infrastructure.

Miles Cumiskey
Opens in a new window Opens in a new window
Social Accounts
Tableau PublicOpens in a new window LinkedInOpens in a new window GithubOpens in a new window BlogOpens in a new window
Languages
American Sign Language (ASL), English
Talk to me about...
- Accessibility
Miles is a designer and developer who began using Tableau to make creative data visualizations. Since then, they have become more active in the Tableau community, becoming a co-lead for the Accessibility Tableau User Group and Data Pride NYC.

Misaki Takatsu
Opens in a new window Opens in a new window Opens in a new window
Social Accounts
Slack ProfileOpens in a new window Tableau PublicOpens in a new window LinkedInOpens in a new window X ProfileOpens in a new window YouTubeOpens in a new window BlogOpens in a new window
Languages
Japanese
Talk to me about...
- Tableau
- Data Visualization
- BI
Based in Tokyo, I work as a freelance data analyst and illustrator. Although I operate across the distinct fields of data analysis and creative expression, a shared goal lies at the heart of my work: inspiring people through visualization. As a CxO at JTUG, I lead the sponsorship team to build relationships with companies that support the community, while also driving the creation of designs and animations that bring vibrancy to the community. I actively share these activities with a global audience to foster cross-border connections and engagement.

Mo Setit
Opens in a new window Opens in a new window Opens in a new window
Social Accounts
Slack ProfileOpens in a new window Tableau PublicOpens in a new window LinkedInOpens in a new window GithubOpens in a new window X ProfileOpens in a new window
Languages
Arabic, English
Talk to me about...
- Tableau + AI
- Tableau MCP
- Tableau APIs
A Tableau Dev Ambassador and analytics leader with 10+ years of experience turning data into business impact. Specializes in Tableau, advanced analytics, AI, automation, and data governance, and has delivered innovative solutions across banking, fraud, and threat intelligence. A passionate Tableau community contributor, shares knowledge, builds practical tools, and explores the intersection of Tableau, MCP, Python, and AI. Outside work, enjoys experimenting with emerging technologies, building automation projects, exploring graph analytics, and helping others learn and innovate with data.

Mo Wootten
Opens in a new window Opens in a new window
Social Accounts
Slack ProfileOpens in a new window Tableau PublicOpens in a new window
Languages
English
Talk to me about...
- Map Layers
- Sports
- Games in Tableau
Mo works with British Olympic and Paralympic sports to create award-winning insight that improves athlete health and performance. He co-leads the venerable London TUG and the new-ish Sports TUG, and #SportsVizSunday when it's not on a break. An ambassador since 2022, Mo enjoys making visualisations that extend the boundaries of what can be done with map layers and parameter actions and likes to turn everything into an opportunity to make small multiples or use trigonometry.

Myles Davenport
Opens in a new window Opens in a new window Opens in a new window
Social Accounts
Slack ProfileOpens in a new window Tableau PublicOpens in a new window LinkedInOpens in a new window TrailblazerOpens in a new window
Languages
English
Talk to me about...
- Medicolegal Death Investigation
- Public Health
- Non Profits
As an applied forensic epidemiologist at the DC Office of the Chief Medical Examiner, I operate in an industry historically known for archaic data practices. To modernize our operations and meet critical accreditation and mayoral reporting demands, I turned to Tableau after discovering our enterprise server access. I quickly became obsessed, earning certification and building OCME's first centralized dashboard. My work replaces static reports with near real-time MDI data visualizations, empowering partners and enhancing public health situational awareness across the DC Metropolitan Area.

Nathalie Richer
Opens in a new window Opens in a new window
Social Accounts
Tableau PublicOpens in a new window LinkedInOpens in a new window YouTubeOpens in a new window
Languages
English, French, Spanish
Talk to me about...
- Data Art
- Teaching
- IronViz
Hi, I am a French data visualization creator based in Zurich. I fell in love with Tableau and then became active on Tableau Public in 2018 by participating to Tableau community projects (WOW, RWFD...). In 2020, I became a Tableau Featured Author and as a participant to the #IronViz, I landed in the top 10 entries in both 2022 and 2023 edition. I loved data-driven storytelling and discovering insights. With an academic background in science, I have always love teaching, so I enjoy sharing my passion for Tableau and Data Visualization through professional training and teaching.

Navin Aswani
Opens in a new window Opens in a new window
Social Accounts
Slack ProfileOpens in a new window LinkedInOpens in a new window TrailblazerOpens in a new window X ProfileOpens in a new window YouTubeOpens in a new window BlogOpens in a new window
Languages
English
Talk to me about...
- Tableau Next
- CRM Analytics
- Data 360
Navin Aswani, a Tableau Ambassador, is dedicated to advancing data and AI excellence. With 10 years as a Enterprise seasoned Data Architect, he specializes in CRM Analytics, Data-Driven Insights, and AI-Powered Solutions. After working with Accenture and PwC, he co-founded 'Cloudearly,' leading in data innovation. A passionate advocate for the DATAFAM community, he took over the stage at Dreamforce, Tableau Conference and other Dreamin' events. In his free time, Navin is either lifting weights at the gym or lifting virtual trophies on his PlayStation!

Neil Richards
Social Accounts
Tableau PublicOpens in a new window BlogOpens in a new window
Languages
English
Talk to me about...
- Tableau Public
- Tableau Desktop
- Viz extensions
I'm a Hall of Fame Visionary, returning for a 9th time as Tableau Ambassador. Author of Questions in Dataviz, blogger at https://questionsindataviz.com Currently freelancing as https://neilrichardsdata.com and one half of the grAI Team at https://go.vizdj.com/tic-li/

Nick Pillsbury
Opens in a new window Opens in a new window Opens in a new window
Social Accounts
Slack ProfileOpens in a new window Tableau PublicOpens in a new window LinkedInOpens in a new window
Talk to me about...
- SQL and Data Modeling
- Executive Reporting
- Governance and Semantics
I fell into Tableau the same way I fell into big data: just one accidental step at a time! I learned Excel to play math heavy games as a child. I leveraged my Excel skills to become an analyst when my local BI team was too swamped for weekly reporting. I learned Tableau when Excel couldn't handle the data volumes. I learned SQL when raw tables were too big for Tableau. I learned to architect pipelines and DWs once that wasn't scalable... and so on till today! Now I get to share my love of just "doing good data" with my colleagues, friends and family!

Nicole Klassen
Opens in a new window Opens in a new window Opens in a new window
Social Accounts
Slack ProfileOpens in a new window Tableau PublicOpens in a new window LinkedInOpens in a new window BlogOpens in a new window
Languages
English
I am a data visualization enthusiast and I love finding ways to showcase data as art on my Tableau Public. My background is in psychology, and currently I work as a Senior Manager of Business Intelligence. I use Tableau and data visualization to support non-profit and international development work. My vizzes tend to focus on mental health, equity, and non-profit projects. Outside of work you can find me rock climbing, reading, and watching Doctor Who!

Nik Dutra
Opens in a new window Opens in a new window Opens in a new window
Social Accounts
Slack ProfileOpens in a new window Tableau PublicOpens in a new window LinkedInOpens in a new window TrailblazerOpens in a new window GithubOpens in a new window X ProfileOpens in a new window YouTubeOpens in a new window
Languages
English, Portuguese, Spanish
Talk to me about...
- Tableau AI
- VizQL Data Service
- Data Product Management
Nik Dutra is a Data Product Manager who helps organizations turn data into better strategic decisions. Specializing in data storytelling, visualization, architecture, and governance, he is also a Tableau Ambassador and an active leader in the global Tableau community. Nik has shared his expertise on stage at Tableau Conference and inspires Brazil's data community through his LinkedIn series, Tableau2Business. Outside work, he enjoys rock concerts, discovering new motorcycle routes, and mastering the art of coffee brewing.

Nisar Ahmed
Opens in a new window Opens in a new window
Social Accounts
Tableau PublicOpens in a new window LinkedInOpens in a new window YouTubeOpens in a new window BlogOpens in a new window PodcastOpens in a new window
Languages
English
Talk to me about...
- Podcasts
- Sports
- Teaching
Nisar Ahmed is a Senior Manager of Metrics & Reporting at CVS Health, 3x Tableau Ambassador, and 2025 Tableau Vizzies Best Content Creator who returned as a Top 3 finalist in 2026. As host of The Data Nerd Podcast, he helps data professionals grow through conversations on analytics, AI, storytelling, careers, and dashboard design. Nisar also teaches Business Analytics Science through Ziplines Education and creates Tableau and analytics content on his YouTube channel, BizNis Intelligence.

Nobu Kimura
Opens in a new window Opens in a new window Opens in a new window
Social Accounts
Slack ProfileOpens in a new window Tableau PublicOpens in a new window LinkedInOpens in a new window
Languages
English, Japanese
Talk to me about...
- Dashboard design
- Tableau tips and tricks
- Career growth
My Tableau journey began with curiosity about how data could become more than numbers. It's a story that sparks insight and action. That curiosity grew into a career in data visualization and eventually a leadership role, where I’ve built teams and helped organizations make better decisions with data. Along the way, I’ve won Viz of the Day twice, been nominated as a 2026 DataFam Rising Star, and served as Co-Leader of the Chicago Tableau User Group. Tableau has given me a creative outlet and a community I’m proud to give back to.

nozopipi
Opens in a new window Opens in a new window Opens in a new window
Social Accounts
Slack ProfileOpens in a new window Tableau PublicOpens in a new window LinkedInOpens in a new window X ProfileOpens in a new window BlogOpens in a new window
Languages
Japanese
At Keywalker, Inc., I develop Tableau dashboards and lead user training. I specialize in unifying scattered data and redesigning visuals into clean, streamlined insights. In March 2026, I became a leader of the Tableau Prep User Group. I also co-lead the "Tableau Sugamo Meetup," a local community in Sugamo for Tableau enthusiasts, and am passionate about building strong connections through Tableau.

Nurudeen Abolarinwa
Opens in a new window Opens in a new window
Social Accounts
Tableau PublicOpens in a new window LinkedInOpens in a new window X ProfileOpens in a new window
Languages
English, Yoruba
Talk to me about...
- Data Visualization and Dashboard Design
- Data Storytelling with Tableau
- Learning Tableau and Building a Data Career
Nurudeen is a data professional and visualisation enthusiast who enjoys transforming complex data into clear, engaging and meaningful visual stories. He uses Tableau to build interactive dashboards, uncover valuable insights and communicate information in an accessible way. He is passionate about data storytelling, continuous learning, analytics engineering and using data to support better decisions.

Ojo
Opens in a new window Opens in a new window Opens in a new window
Social Accounts
Slack ProfileOpens in a new window Tableau PublicOpens in a new window LinkedInOpens in a new window YouTubeOpens in a new window
Languages
English, Gujarati, Hindi, Punjabi
Talk to me about...
- Tableau Desktop
- Tableau Performance Best Practices
- Cyber Security
Most organizations don’t have a data problem. They have a clarity problem. Dashboards pile up, reports go unused, and leaders are left guessing what actually matters. That’s where I come in. I’m often called when dashboards stop being trusted or used. I work directly with leaders to clean up the dashboard graveyard and replace it with a small set of fast, clear, decision-ready views. Alongside delivery, I train teams to read charts better, follow practical best practices, and confidently self-serve their own insights, without constant rework or dependency.

Ollie Ross Russell
Opens in a new window Opens in a new window Opens in a new window
Social Accounts
Slack ProfileOpens in a new window Tableau PublicOpens in a new window LinkedInOpens in a new window BlogOpens in a new window
Languages
English
Talk to me about...
- Sports Visualisations
- Dashboard Design
- Golf
Ollie is a Data Analytics Consultant at The Information Lab, combining his analytical background with a passion for data visualisation and thoughtful design. He started using Tableau in 2025 and has developed a particular interest in sports visualisation, creating projects on Tableau Public that explore stories in sport through data. His work has been recognised through the 2026 DataFam Rising Stars programme and three Vizzies Award nominations, alongside speaking at the Tableau Public User Group. Outside of work, Ollie enjoys keeping active, playing golf and following football.

Olushola Olojo
Opens in a new window Opens in a new window
Social Accounts
Tableau PublicOpens in a new window LinkedInOpens in a new window
Languages
English, French, Yoruba
Talk to me about...
- Data Storytelling & Visualisation
- Analytics & Reporting
- Using Data to Drive Better Decisions
I’ve been using Tableau since 2020, when it became my project during the height of COVID. What kept me interested wasn’t just turning messy organisational data into good-looking dashboards, but figuring out what the numbers were actually telling us and where things could change. It's about filling the space between data, people and decisions. Outside of data, I’m into art, philosophy and coffee. Three things that probably explain why I spend far too much time thinking about how things look, why things work, and finding a good coffee while doing it.

Omokehinde Ayodeji
Opens in a new window Opens in a new window Opens in a new window
Social Accounts
Slack ProfileOpens in a new window Tableau PublicOpens in a new window LinkedInOpens in a new window TrailblazerOpens in a new window X ProfileOpens in a new window BlogOpens in a new window
Languages
English, Yoruba
Talk to me about...
- Data Visualization Practices
- Tableau & TableauNext
- Community Development
Omokehinde Ayodeji is a three-time Tableau Ambassador, a co-lead of the Lagos Tableau User Group, and a Tableau Consultant at PhiX Technologies. Specializing in data analytics and business intelligence across tools like Excel, SQL, Tableau, and TableauNext, she is passionate about transforming complex datasets into actionable, visually compelling stories and fostering community development. Her deep commitment to data education and community building earned her the 2025 Michael W. Cristani Community Leadership Vizzies Award. She also has 2✶ VOTD nominations.

Oyerinde Oyesina Anuoluwapo
Opens in a new window Opens in a new window
Social Accounts
Tableau PublicOpens in a new window LinkedInOpens in a new window GithubOpens in a new window X ProfileOpens in a new window YouTubeOpens in a new window BlogOpens in a new window
Languages
English, German, Yoruba
Talk to me about...
- Hierarchy Data
- Calculated Fields
I am a former architect turned Product Manager, data enthusiast, and BI Professional, who is passionate about helping people appreciate the power of data. My Tableau journey has grown from learning the fundamentals to creating dashboards, exploring data storytelling, building Tableau Public projects, and teaching others how to turn data into clear insights. Through my Data Appreciation work, BI community participation, and educational content, I use Tableau to make data more accessible, practical, and meaningful—especially for people outside the traditional data space.

Pablo Gomez
Opens in a new window Opens in a new window Opens in a new window
Social Accounts
Slack ProfileOpens in a new window Tableau PublicOpens in a new window LinkedInOpens in a new window GithubOpens in a new window X ProfileOpens in a new window YouTubeOpens in a new window BlogOpens in a new window PodcastOpens in a new window
Languages
English, Spanish
Talk to me about...
- Dashboard design and data storytelling
- Co-designing data visualization with AI
- Building community: TUGs, ComuniDatos and the Tableau Conference
Pablo believes data can change the way we see the world. A ten-time Tableau Ambassador and four-time Tableau Visionary, he blends Tableau, design, storytelling and AI to turn data into something people can understand, feel and act on. As co-leader of ComuniDatos, the Spanish-speaking TUG, he loves teaching, building, speaking at the Tableau Conference and supporting the next generation of data storytellers across the DataFam. He sees AI as a co-designer, a creative partner for exploring possibilities, asking better questions and making insight actually land.

Parth Ravani
Opens in a new window Opens in a new window
Social Accounts
Slack ProfileOpens in a new window LinkedInOpens in a new window TrailblazerOpens in a new window X ProfileOpens in a new window BlogOpens in a new window PodcastOpens in a new window
Languages
English, Gujarati, Hindi, Marathi
Talk to me about...
- Tableau Next
- CRM Analytics
- Data Cloud
Parth Ravani is the Founder & CXO at Jivark LLP, a four-time returning Tableau Ambassador, and leads the India Trailblazing Analytics and Pune Tableau User Groups. With over a decade of experience across analytics and the Salesforce ecosystem, he helps organizations turn data into meaningful business outcomes through CRM Analytics, Tableau Next, Data Cloud, Agentforce, and AI-powered analytics. A passionate community builder, Journey to Salesforce Mentor, and speaker, Parth enjoys sharing knowledge, connecting people, and helping the next generation of analytics professionals grow.

Paula A. Munoz
Opens in a new window Opens in a new window Opens in a new window
Social Accounts
Slack ProfileOpens in a new window Tableau PublicOpens in a new window LinkedInOpens in a new window GithubOpens in a new window X ProfileOpens in a new window BlogOpens in a new window
Languages
English, Spanish
Talk to me about...
- Tableau development & workbook optimization
- Data visualization & analytics best practices
- Tableau Community
Paula is passionate about data visualization, analytics, and the Tableau community. With 9+ years of experience, she created the Tableau Workbook Analyzer to help the DataFam explore and better understand Tableau workbook metadata. Through community initiatives such as Comunidatos TUG, speaking engagements, knowledge sharing, and collaborative projects, Paula enjoys helping others grow their Tableau skills and discover new ways to work with data. She is passionate about building useful tools, sharing what she learns, and supporting a welcoming and connected global DataFam.

Peter Fakan
Opens in a new window Opens in a new window Opens in a new window
Social Accounts
Slack ProfileOpens in a new window Tableau PublicOpens in a new window LinkedInOpens in a new window BlogOpens in a new window
Talk to me about...
- Tableau Layout and Format
- Web Content Accessibility Guidelines
- Federal Government Visualisations
Peter Fakan is a Director of Business Transformation, renowned for his expertise in Federal Government reporting, specialising in deploying and building Tableau solutions that align with Australian Government data standards and publishing principles. With over two decades of experience in government roles, he has a deep understanding of strategic business reform, business intelligence, data warehousing and performance reporting. Peter is passionate about empowering people to leverage data-driven insights to enhance their decision-making processes. Peter is also a trainer and educator.

Phillip Schrijnemaekers
Opens in a new window Opens in a new window
Social Accounts
Slack ProfileOpens in a new window LinkedInOpens in a new window TrailblazerOpens in a new window
Languages
English, French, Italian, Portuguese
Talk to me about...
- Tableau Next
- Agentic Analytics
- Tableau Features
Enterprise Data & Analytics Architect with 7+ years of experience delivering scalable solutions across Salesforce, Data 360, Agentforce, CRM Analytics, and Tableau. Passionate about music (guitar) and aviation.

Pooja Deshmukh
Opens in a new window Opens in a new window
Social Accounts
Tableau PublicOpens in a new window LinkedInOpens in a new window YouTubeOpens in a new window
Languages
English, Hindi
Talk to me about...
- LOD
- Table Calculation
- Performance Optimization
Pooja Deshmukh is a Tableau Developer with 4 years of experience, currently at Deutsche Bank. Her Tableau journey has evolved from building dashboards to creating meaningful data experiences that turn complex information into compelling stories. A storyteller and artist at heart, she blends analytical thinking with creativity and thoughtful design. Her work was featured in the #DataFam Roundup, earned 5 Tableau Viz of the Day recognitions, and led to her selection as a Tableau Ambassador in 2025. She inspires others through data storytelling.

Pradeep Kumar G
Opens in a new window Opens in a new window
Social Accounts
Tableau PublicOpens in a new window LinkedInOpens in a new window X ProfileOpens in a new window
Languages
English, Tamil
Talk to me about...
- Business Dashboards
- Minimalist User Interface
With over 8 years of experience in data visualisation and business analytics, Pradeep specialises in transforming complex data into visually impactful stories that drive actionable insights. He is a 6-time Tableau Ambassador, 2-time Vizzie Award winner, and 16-time Viz of the Day recipient. His work has earned a Bronze award at the Information is Beautiful Awards 2022 and a finalist position in Iron Viz 2021. Outside of work, he enjoys travelling, photography, and sci-fi movies.

Pranit Bhisade
Social Accounts
Languages
English
Talk to me about...
- CRM Analytics
- Data Analytics
- Agentforce
Pranit is a Technical Lead specializing in Salesforce and Analytics, with experience across CRM Analytics, Tableau, and Data Cloud Agentforce. He is passionate about technology, continuous learning, and building meaningful solutions

Preethi Lodha
Opens in a new window Opens in a new window Opens in a new window
Social Accounts
Slack ProfileOpens in a new window Tableau PublicOpens in a new window LinkedInOpens in a new window X ProfileOpens in a new window
Languages
English, Hindi, Telugu
Talk to me about...
- Data storytelling & dashboard design
- Higher-ed analytics & operational reporting (turning complex data into action)
- Community building (User Groups, speaking, mentoring)
Preethi is a Tableau Ambassador and User Group leader, serving as Director of Data Analytics & Operations in higher education. She has used Tableau since 2019 to turn complex data into actionable insights. A Tableau Ambassador (2022–2026) and Featured Author (2022, 2023), she is Tableau Desktop Specialist certified and has 1M+ views on Tableau Public. Her award-winning visualizations include three Viz of the Day features and multiple competition wins. She co-leads the Boston Tableau User Group and Tableau Public TUG, and supports the community through speaking and mentoring.

Prem
Social Accounts
Languages
English, Hindi
Talk to me about...
- Tableau Career
- Tableau integrations
- Headless BI
Prasann Prem is a 4× Tableau Visionary and Manager of Data Visualization & AI Insights at Emirates NBD in Dubai, where he leads a team building AI-infused BI platforms and a finance chatbot for cross-segment insights. Founder of Tableau Buddy, a global mentorship initiative, and co-organizer of the Analytics and Dubai Tableau User Group. A decade in BI, now bridging Tableau with AI-native reporting.

Priya Padham
Opens in a new window Opens in a new window
Social Accounts
Tableau PublicOpens in a new window LinkedInOpens in a new window X ProfileOpens in a new window YouTubeOpens in a new window
Languages
English
Talk to me about...
- Design
- Community
- AI
Priya has been an active member of the Tableau Community since 2020, when she was named a Tableau Featured Author, became a Tableau Public Ambassador, and received a Community Award at Tableau Conference. She has proudly served as a Tableau Ambassador for seven years and as a Tableau Visionary for four years. Priya loves exploring new technologies in the Tableau world, learning new skills and sharing what she learns with the community through talks and events. She finds endless inspiration in the #DataFam and loves connecting with passionate data enthusiasts around the world.

Priyanka Dobhal
Opens in a new window Opens in a new window Opens in a new window
Social Accounts
Slack ProfileOpens in a new window Tableau PublicOpens in a new window LinkedInOpens in a new window BlogOpens in a new window
Languages
English, Hindi
Talk to me about...
- Viz Inspirations
- Performance Optimization
- User Friendly Designs
Priyanka has over 10 years of experience in Data and Analytics and has been an active member of the Tableau community since 2018. For her, Tableau Public is a blank canvas for creativity and expression—an opportunity to both share her own work and learn from the #DataFam community. Guided by the motto “Vizing what you love,” she enjoys creating visualizations on topics like movies, music, and sports. She’s also an enthusiastic participant in community projects, crediting much of her learning and growth to these collaborations. Outside of vizing, she enjoys spending time with family and friends

Rachel Wang
Social Accounts
Languages
Chinese, English
Talk to me about...
- Dashboard design
- Data literacy
- AI in analytics
Rachel Wang is a Senior Lecturer in Business Analytics at Oxford Brookes University. Her work sits at the intersection of business analytics, data visualisation and hospitality, tourism and events management. Her research explores how data and digital technologies shape organisational decision-making, professional development, and performance across a range of contexts and business functions. Rachel's journey with Tableau began in 2019, and has been a Tableau Academic Ambassador since 2021.

Rafael Guevara
Opens in a new window Opens in a new window Opens in a new window
Social Accounts
Slack ProfileOpens in a new window Tableau PublicOpens in a new window LinkedInOpens in a new window YouTubeOpens in a new window BlogOpens in a new window
Languages
English
Talk to me about...
- Dashboard Design
- How to get started with Tableau Public
- Dynamic Zone Visibility
Rafael Guevara Jr. is a data visualization leader with 20+ years of experience in analytics across financial services, utilities, insurance, and retail. He is a longtime Tableau practitioner, educator, mentor, and community advocate, including founding Comuni[DATOS] DFW to celebrate and elevate Latino voices in data. Rafael enjoys sharing knowledge, exploring new ideas, and connecting people through the power of data and visualization.

RAJAN DAS
Opens in a new window Opens in a new window
Social Accounts
Tableau PublicOpens in a new window LinkedInOpens in a new window GithubOpens in a new window
Languages
English, Hindi
Talk to me about...
- Tableau Calculations
- Level of Detail (LOD) Expressions
- Parameters & Advanced Tableau Techniques
I’m Rajan Das, currently working as Manager Business Intelligence & Data Analytics at NTT DATA, with 12+ years of experience in BI and analytics. I’m passionate about Tableau, data visualization, and storytelling, with a focus on turning complex data into meaningful business insights. Tableau has become a key part of my journey, from building dashboards and KPI solutions to exploring advanced calculations, LODs, parameters, and innovative analytics. I enjoy solving Tableau challenges, sharing knowledge, and helping others unlock the power of data. I’m always learning and giving back.

Ramdoss.K
Opens in a new window Opens in a new window
Social Accounts
Slack ProfileOpens in a new window LinkedInOpens in a new window TrailblazerOpens in a new window GithubOpens in a new window BlogOpens in a new window
Languages
English, Tamil
Talk to me about...
- Data modeling for BI
- Dashboard interactivity and UX design
- Bridging Tableau and Salesforce CRM Analytics
Ramdoss K is a Salesforce CRM Analytics Architect with 11 years of experience spanning business intelligence and data analytics. He specializes in Salesforce CRM Analytics, SQL, Tableau, and Python, helping organizations turn data into actionable insights. As a Tableau Ambassador, he is passionate about knowledge sharing and empowering the community. In his native language, he is known as ராம்தாஸ்—a name that reflects his cultural roots and personal identity.

Ravi Kumar N
Opens in a new window Opens in a new window Opens in a new window
Social Accounts
Slack ProfileOpens in a new window Tableau PublicOpens in a new window LinkedInOpens in a new window GithubOpens in a new window X ProfileOpens in a new window YouTubeOpens in a new window BlogOpens in a new window PodcastOpens in a new window
Languages
English, Hindi, Tamil, Kannada, Telugu
Talk to me about...
- Data Architecture Lifecycle
- Dashboard Performance Tuning
- Analytics & UI/UX Design
I am a Data & Insights Leader on a mission to turn complex numbers into clear, delightful visual stories! My journey spans full cycle data experience from architecting scalable data foundations to designing high performance frontend interfaces with human centered UI/UX. For me, analytics leadership is a shared learning journey where I love connecting with the community, firmly believing everyone has something valuable to teach us. Beyond work, I work on championing biodiversity through storytelling, sharing DIY craft projects, and exploring outdoor terrains.

Ravi Mistry
Opens in a new window Opens in a new window Opens in a new window
Social Accounts
Slack ProfileOpens in a new window Tableau PublicOpens in a new window LinkedInOpens in a new window PodcastOpens in a new window
Languages
English, Gujarati
Talk to me about...
- Data Fluency
Ravi found Tableau in 2015 whilst in his final year of university, utilising it to explore & visualise publicly available of his beloved Ipswich Town. After joining the first cohort of The Information Lab’s Data School, Ravi evangelised Tableau Public, scouring it for vizperation, sharing & publishing his Tableau journey, and learning from the Community. By day, as the Head of Football Insights at the City Football Group, Ravi spends his days utilising Tableau to educate, enable & empower football practitioners to make better decisions, faster by reducing time to insight.

Ravi Vaghela
Social Accounts
LinkedInOpens in a new window TrailblazerOpens in a new window BlogOpens in a new window
Languages
English, Gujarati, Hindi
Talk to me about...
- Data Analytics
- Gen AI
- Data Science
I am a CRMA professional focused on user access, security, compliance, and risk management. I work with different teams to manage access efficiently, maintain proper controls, and resolve access-related issues. I enjoy learning new technologies, improving processes, and finding simple solutions to complex problems. My goal is to make access management more secure, efficient, and user-friendly.

Rebecca Bergh
Opens in a new window Opens in a new window
Social Accounts
Tableau PublicOpens in a new window LinkedInOpens in a new window TrailblazerOpens in a new window GithubOpens in a new window BlogOpens in a new window
Languages
English
Talk to me about...
- Parameters
- Data modeling
- Storytelling
My background in journalism taught me to be a storyteller. My love of numbers and aptitude for pattern recognition led me to tell stories with data instead. Today, I find immense joy in helping others build their skills, confidence, and creativity with Tableau. I’m incredibly grateful to be part of a community that values knowledge sharing, mentoring, and lifting others up as much as the #DataFam does.

Rida
Opens in a new window Opens in a new window Opens in a new window
Social Accounts
Slack ProfileOpens in a new window Tableau PublicOpens in a new window LinkedInOpens in a new window GithubOpens in a new window X ProfileOpens in a new window BlogOpens in a new window
Languages
English, Urdu
Talk to me about...
- Tableau tips & data visualization
- Tea, coffee & cats
- Gaming
I'm Rida Hamid, a Business Intelligence Specialist based in Karachi, Sindh, Pakistan, with 5 years of experience turning raw data into clear, meaningful stories that help businesses make smarter, faster decisions. BI isn't just about numbers and charts, it's about solving real problems and creating clarity where complexity usually exists. As a Tableau Community Leader and active member of the Karachi Tableau User Group, I've been inspired by the dedication of fellow ambassadors and visionaries in the community.sharing my knowledge and helping others unlock their own data skills.

Rieko
Opens in a new window Opens in a new window Opens in a new window
Social Accounts
Slack ProfileOpens in a new window Tableau PublicOpens in a new window LinkedInOpens in a new window TrailblazerOpens in a new window X ProfileOpens in a new window BlogOpens in a new window
Languages
English, Japanese
Talk to me about...
- Building and expanding a network of Tableau professionals
- Tableau and AI
- Visual Best Practice
I drive data utilization in the manufacturing industry. I started using Tableau in 2022. Since then, I’ve been energizing the local Tableau user group in my beloved Kansai region of Japan, planning and leading various events. I am also dedicated to mentoring future DATA Sabers, combining data analytics with my lifelong focus on education—a domain I’ve studied since my student days—to develop talent across the community. I live with a Shiba Inu named Shinji, who occasionally makes special appearances at our user group events!

Riya Mehta
Opens in a new window Opens in a new window Opens in a new window
Social Accounts
Slack ProfileOpens in a new window Tableau PublicOpens in a new window LinkedInOpens in a new window
Languages
English, Gujarati, Hindi
Talk to me about...
- Tableau Dashboard Design
- Data Storytelling with Tableau
- Tableau Tips, Tricks & Advanced Techniques
Hi, I'm Riya, a Tableau enthusiast and Data Visualization Analyst who loves helping people make data more accessible, insightful, and impactful. My interests include dashboard design, data storytelling, Tableau tricks and analytics. I believe great visualizations empower better decisions, and I'm excited to share knowledge, support the community, and continue learning alongside fellow Tableau users as a Tableau Ambassador.

Rob Taylor
Opens in a new window Opens in a new window Opens in a new window
Social Accounts
Slack ProfileOpens in a new window Tableau PublicOpens in a new window LinkedInOpens in a new window X ProfileOpens in a new window BlogOpens in a new window
Languages
English
Talk to me about...
- Map Layers
- Tableau Desktop
- Fun Vizzes
Discovering the Tableau community transformed my career and ignited my passion for empowering others. I've fully embraced community engagement: speaking at events, co-leading the Tableau Public TUG, and earning a Vizzie award and IronViz top 10 placement. I actively collaborate with members through LinkedIn and X, built a blog sharing data insights, and created vizzes showcasing community work using the Tableau Public API. I'm driven by helping newcomers find their place

Rod Reza Sardari, PhD
Opens in a new window Opens in a new window Opens in a new window
Social Accounts
Slack ProfileOpens in a new window Tableau PublicOpens in a new window LinkedInOpens in a new window X ProfileOpens in a new window YouTubeOpens in a new window BlogOpens in a new window
Languages
English, Persian
Talk to me about...
- Mapping & Geospatial Analysis
- Census, Demographic, Labor Market Data
- Tableau Server Administration & BI Training
Rod Reza Sardari is the founder of Roddar, focused on teaching GIS and BI tools. He holds a PhD in Urban Planning and has published research in journals including MDPI, SAGE, and JPER. His Tableau journey began as a GIS analyst, mapping demographics and modeling travel demand across the U.S., Mexico, and the Middle East. He later served as a Tableau Server administrator for a Texas local government and taught Tableau and spatial data science. Today, he teaches Tableau and GIS at Roddar and works with the Texas Talent Accelerator at UNT on labor market and skills gap analysis.

Rohit Prasad
Opens in a new window Opens in a new window Opens in a new window
Social Accounts
Slack ProfileOpens in a new window Tableau PublicOpens in a new window LinkedInOpens in a new window TrailblazerOpens in a new window GithubOpens in a new window
Languages
English, Hindi
Hello, and thank you for visiting my profile. My Name is Rohit Prasad, and I am a working professional in business and Data domain. Hailing from India, I earned my degrees in MSc. | MBA | B.Eng. from Germany and India. As a Tableau Academic Ambassadors Mentor, I aspire to empower students and educators by fostering strong analytical and storytelling skills. I spearheaded a project that improved data-driven decision-making across campus departments. I enjoy hiking, digital art, and community tutoring. I bring expertise in Tableau, data analytics, dashboard design, and instructional mentoring.

Rohith CR
MS In data science graduate from University of Washington, currently working as AI Engineer at HCL Tech

Rosa Mariana De León-E
Opens in a new window Opens in a new window Opens in a new window
Social Accounts
Slack ProfileOpens in a new window Tableau PublicOpens in a new window LinkedInOpens in a new window
Languages
English, French, Spanish
Rosa is a Guatemalan sociologist and Data Analyst at Decathlon, where she applies her expertise in data and information design. Previously, she worked at the French National Research Agency as a bibliometric analyst and research popularizer. In her free time, she combines social science insights with a passion for data visualization, transforming complexity into clarity. As a Tableau Ambassador, she blends analytical rigor with creativity to make data meaningful and accessible.

Rosario Gauna
Opens in a new window Opens in a new window
Social Accounts
Tableau PublicOpens in a new window LinkedInOpens in a new window X ProfileOpens in a new window BlogOpens in a new window
Languages
Spanish
Talk to me about...
- Tableau Prep
- Tableau Desktop
- Drill Down
Rosario Gauna is a Data Analytics and Business Intelligence specialist based in Monterrey, Mexico. She is passionate about transforming data into meaningful insights that drive informed decision-making. An active member of the Tableau Community, she shares solutions and learnings that inspire others to grow professionally, strengthen their technical skills, and embrace the challenges of analytics.

Rosh Khan
Opens in a new window Opens in a new window
Social Accounts
Tableau PublicOpens in a new window LinkedInOpens in a new window GithubOpens in a new window BlogOpens in a new window
Languages
English, Urdu
I’m an Analytics Engineering Consultant at The Information Lab, where I started my data career 2 years ago. I’ve worked across telecoms and healthcare, using data to solve problems. I enjoy the creative side of it; design, data viz and storytelling. The Tableau community gives me a space to explore that creativity, whether I’m experimenting with new features or building something just for the fun of it. I share some of these experiments and ideas through my GitHub and blogs. I was honoured to be recognised as a DataFam Rising Star and am excited to give back as a Tableau Ambassador.

Roshni Gohil
Higher Education Tableau User Group (HETUG)Opens in a new window
Accessibility Tableau User Group (a11ytug)Opens in a new window
Roshni Gohil is an analyst at the Massachusetts Institute of Technology (MIT). While not knee-deep in data and Tableau, she pushes user-centered design and business analysis practices on unsuspecting colleagues. An accidental data analyst, Roshni has spent over a decade supporting the fundraising and investment arms of MIT's endowment. Roshni co-founded and co-leads the Higher Education TUG (HETUG) and MIT's internal TUG, and co-leads the Accessibility TUG (a11ytug) and DataDev TUG. At Tableau events, she usually has her hands full keeping her stuffed DataDev dino, Flex, out of trouble.

Rudy Castillo
Opens in a new window Opens in a new window Opens in a new window
Social Accounts
Slack ProfileOpens in a new window Tableau PublicOpens in a new window LinkedInOpens in a new window BlogOpens in a new window
Languages
English
Talk to me about...
- Tableau
- Sports
- Traveling
Rudy is a Tableau Ambassador, co-lead of the Nashville Tableau User Group, and a data analyst passionate about data visualization. His Tableau journey began in college, where he discovered the platform with no prior experience. He later built a Tableau Public portfolio to showcase his skills, which helped launch his data analytics career. Rudy loves creating data visualizations because he sees data as more than numbers; he sees it as art that tells meaningful stories, sparks curiosity, and connects with people.

Russ Cantrell
Opens in a new window Opens in a new window Opens in a new window
Social Accounts
Slack ProfileOpens in a new window Tableau PublicOpens in a new window LinkedInOpens in a new window TrailblazerOpens in a new window
Languages
English
Talk to me about...
- Higher Education
- Research
- Data Literacy and Fundamentals
My name's Russ. I’ve always been fascinated by how data can help us better understand the world around us, from answering everyday questions to tackling larger research problems. My passion is helping others see data the same way and learn how to use it to make better decisions, solve problems, and make their work a little easier. I’m especially interested in predictive analytics, teaching data fundamentals, and helping students and researchers turn their data into something useful and understandable. I currently work in higher education, while also pursuing a PhD in Computing as well.

Ryo Takahashi
Social Accounts
Tableau PublicOpens in a new window X ProfileOpens in a new window BlogOpens in a new window
Languages
Japanese
Talk to me about...
- Creative Data Visualization
- AI & Analytics
- Data Platforms
I explore different possibilities in data visualization through Tableau. Since discovering Tableau in 2022, I have shared visualization techniques through Tableau Public and technical how-to articles, experimenting with polygons, lines, dots, animation, and other visual approaches. I am also exploring how AI and data platforms are changing the future of visualization and analytics. I hope to continue discovering new possibilities and sharing what I learn with the community.

Sabrina Vazquez
Opens in a new window Opens in a new window
Social Accounts
Tableau PublicOpens in a new window LinkedInOpens in a new window GithubOpens in a new window
Languages
English, Spanish
Talk to me about...
- Tableau Enablement
- Design Best Practices
- Fomula One
My name is Sabrina Vazquez, and I'm a Solutions Consultant at The Information Lab, a Tableau partner for fifteen years. I have been working in Tableau for a little over three years drawn to the product by how it speeds time-to-insight and democratizes analytics. I run Comuni[datos] NYC, a Tableau User Group focused on Latino voices in data. Find me active in the community at either Tableau Conference, online blog posts, or championing women in tech. NYC-based, Miami-born, proud Argentinian, and a big Formula 1 fan.

Said Tojiboev
Opens in a new window Opens in a new window
Social Accounts
Slack ProfileOpens in a new window LinkedInOpens in a new window
Languages
English, Korean, Russian
Said Tojiboev is a government analyst and Fulbright Scholar. He has a background in data analytics, strategy, policy research, and evidence-based decision-making, with experience working on public-sector initiatives within the Government of Uzbekistan. Said has been recognized as a Tableau Ambassador for four consecutive years. Through the Tableau community, he enjoys sharing knowledge, helping others overcome analytical challenges, and promoting effective, data-driven approaches to problem-solving. Outside of work and study, he enjoys playing chess and exploring new places.

Salome Grasland
Opens in a new window Opens in a new window
Social Accounts
Tableau PublicOpens in a new window LinkedInOpens in a new window GithubOpens in a new window BlogOpens in a new window
Languages
English, French
Talk to me about...
- Storytelling with Data
- AI & Data Ethics
- LGBTQ+ Data
Salome “Sam” Grasland is the Recruitment & Talent Partnerships Lead at The Information Lab, where she helps bring new people into data and discover that Tableau is less intimidating than it looks. A former educator and career changer, she’s passionate about helping people from nontraditional backgrounds turn their experience into stronger analysis. She co-founded Data Pride NYC, is a two-time Tableau Ambassador, and spoke at Tableau Conference in 2026. Outside of work, she enjoys cooking without recipes, long walks with diner breaks, and birdwatching on her commute.

Sam Batchelor
Opens in a new window Opens in a new window Opens in a new window
Social Accounts
Slack ProfileOpens in a new window Tableau PublicOpens in a new window LinkedInOpens in a new window X ProfileOpens in a new window
Languages
English
Talk to me about...
- Governance
- Learning what "good" looks like
- Connecting the Community
Sam is proud to be a four-time Tableau Ambassador. With years of experience as a Tableau developer, server admin, and currently Data Visualisation Lead for a major Australian retailer, she’s passionate about making Tableau fun and accessible. She has taught Tableau Desktop across Australia, co-presented “Tableau Speed Tips” at TC23 in Las Vegas, and previously co-hosted the global Analytics TUG. Based in Brisbane, Sam loves music and musicals (especially Hamilton for which she was awarded a VOTD). Her ultimate happy place is at a karaoke bar singing with the #DataFam at Tableau Conference.

Sam Cohn
Opens in a new window Opens in a new window
Social Accounts
Tableau PublicOpens in a new window LinkedInOpens in a new window YouTubeOpens in a new window
Talk to me about...
- Dashboard UX & Design
- Advanced Tableau Techniques
Sam is a BI Engineer in Austin, Texas, and the creator of Golden Insights, a Tableau YouTube channel inspired by her golden retriever, Sunny, who often appears in her videos. She began using Tableau at work only a few years ago and quickly developed a passion for design-focused dashboards. Her style blends modern UI and creative visuals with clear business storytelling, and she shares tutorials on YouTube and Tableau Public to help others build more engaging and effective dashboards.

Sam Homier
California Community Colleges Tableau User Group (CCC TUG)Opens in a new window
Higher Education Tableau User Group (HETUG)Opens in a new window
Opens in a new window Opens in a new window
Social Accounts
Tableau PublicOpens in a new window LinkedInOpens in a new window
Languages
English
Talk to me about...
- Dogs
- Chickens
- Video Games
Sam is the Director of Institutional Research at Everett Community College, where she uses Tableau to make data more accessible and understandable. She is a Tableau Ambassador, Certified Tableau Data Analyst, and Tableau User Group Leader, co-leading the California Community Colleges TUG (CCC TUG) since 2023 and the Higher Education TUG (HETUG) since 2025. In her free time, she enjoys vizzing about her hens’ eggs, her favorite video games, and oddly enough, sports, even though she’s not a sports fan. She also loves using math like parametric equations to create non-standard charts in Tableau.

Sara Fisk
Opens in a new window Opens in a new window
Sara discovered Tableau while working as a Media Buyer at an advertising agency. After taking a two-day crash course, she made the transition to a career in reporting and data visualization. With a background in communications and advertising, having data viz skills helps her successfully create reporting standards for internal teams and global clients. Sara’s work regularly trends on Tableau Public. She has been featured in Tableau’s weekly roundup and she is a multi-VOTD recipient. She is excited to help users elevate their skills, and help others get into a career in data viz.

Sarah Bartlett
Opens in a new window Opens in a new window Opens in a new window
Social Accounts
Slack ProfileOpens in a new window Tableau PublicOpens in a new window LinkedInOpens in a new window
Talk to me about...
- User Enablement
- TUG Leadership
- Tableau Public
Sarah has been a Tableau Ambassador for 8 years and a five-time Visionary, now proud to be part of the Hall of Fame. Based in London, she co-leads the London Tableau User Group; the largest in the world, and at work, helps teams turn dashboards into lasting data culture. Her focus is on people, not just platforms: building communities, embedding best practices, and designing experiences people actually want to use. She's trained 400+ people in data visualisation and data literacy, and has engaged 14,000+ enterprise users across data and AI products.

Sarah Burnett
Opens in a new window Opens in a new window Opens in a new window
Social Accounts
Slack ProfileOpens in a new window Tableau PublicOpens in a new window LinkedInOpens in a new window TrailblazerOpens in a new window GithubOpens in a new window YouTubeOpens in a new window BlogOpens in a new window PodcastOpens in a new window
Languages
English
Talk to me about...
- Becoming a Datafluencer: Building your personal brand in data
- Tableau Next and AI in analytics
- Human-centred design for Tableau visualisations
I'm Sarah, co-founder of Dub Dub Data and a returning Tableau Ambassador. I spent 20 years in enterprise data, leading global visualisation teams in financial services in Singapore, before returning to Auckland to launch a boutique consultancy helping organisations unlock value from Tableau. I co-host unDUBBED, a Tableau community podcast, and co-lead the Auckland TUG and Freelancers & Consultants TUG. I'm passionate about human-centred design, accessibility, and Tableau Next. Let's chat about building your voice in data!

Sarah Moore
Opens in a new window Opens in a new window
Social Accounts
Tableau PublicOpens in a new window LinkedInOpens in a new window BlogOpens in a new window
Languages
English
Talk to me about...
- Digital Accessibility
- Social Good
- Birding
Sarah began her Tableau journey in 2019 through a job in higher education and quickly found her home in the DataFam. With 15+ years in data analytics, she's channeling that experience into mission-driven work and serves on the board with Data ChangeMakers. Sarah loves sharing and speaking about data viz and digital accessibility to all audiences. In her free time you’ll find her in the mountains, at the gym, or volunteering as a Boulder Parks naturalist, where she can tell you way more than you need to know about aquatic nuisance species.

Sarah Pallett
Opens in a new window Opens in a new window Opens in a new window
Social Accounts
Slack ProfileOpens in a new window Tableau PublicOpens in a new window LinkedInOpens in a new window X ProfileOpens in a new window BlogOpens in a new window
Languages
English
Talk to me about...
- L-Shaped Bars
- Tableau Tips & Tricks
- Data Visualization Best Practices
Sarah Pallett is a Tableau consultant who brings creativity, curiosity, and a people-first approach to data visualization. After a career in advertising, she pivoted to analytics in 2020. An active member of the data community, Sarah co-leads the Marketing & Market Research Tableau User Group and mentors with the Data Visualization Society. Her work has earned multiple Viz of the Day honors, including her innovative L-Shaped Bars and a playful Ted Lasso–themed viz. Originally from Toronto, Sarah now lives in Newport Beach, where she enjoys cooking, sports, and bike rides along the beach.

Satoko
Opens in a new window Opens in a new window
Social Accounts
Slack ProfileOpens in a new window Tableau PublicOpens in a new window X ProfileOpens in a new window
Languages
English, Japanese
Satoko’s Tableau Community journey began with the DATA Saber Program in 2023. Since then, she has looked for ways to give back to a community that has had a big impact on her. Within her company, she brought together colleagues who share a passion for data, and created a community where people can connect and develop a data-driven mindset. She also connects people across companies to share experiences and knowledge. In 2026, she is working with the JTUG Tableau Tuneup team to create an online event for Tableau beginners. Outside Tableau, Satoko loves traveling and has visited 25+ countries.

Satyabrata Majhi
Opens in a new window Opens in a new window Opens in a new window
Social Accounts
Slack ProfileOpens in a new window Tableau PublicOpens in a new window LinkedInOpens in a new window X ProfileOpens in a new window BlogOpens in a new window
Languages
English, Hindi, Odia
Talk to me about...
- Data
- Tableau
Hi myself Satya , currently working in JLL , with 10+ years of experience as a Data Visualization Strategist, I turn complex business challenges into intuitive, high-impact analytics solutions. I specialize in designing interactive dashboards that guide executive decision-making through clear data storytelling. Outside of my corporate role, I mentor and teach Tableau workflows, visual design standards, and data strategies to empower analysts worldwide to maximize the value of their data. I lead the Tableau Bhubaneswar user group

Sayantani Mitra
Opens in a new window Opens in a new window
Social Accounts
Slack ProfileOpens in a new window LinkedInOpens in a new window TrailblazerOpens in a new window YouTubeOpens in a new window BlogOpens in a new window
Languages
English, Hindi, Bengali
Talk to me about...
- CRM Analytics
- Tableau Next
- Data Architecture
Sayantani is a Sr. Data Scientist at Conservice, building CRM Analytics and Salesforce Service Cloud solutions for sustainability and utility billing — SAQL, dashboards, and ESG pipelines. Her platform work spans Tableau since 2014, CRM Analytics since 2017, Experience Cloud since 2018, and Tableau Next since 2024. A Salesforce Analytics Champion from the program's 2019 inception through its transition to Tableau, where she's now a Tableau Ambassador, she co-organizes and presents at the Trailblazing Analytics TUG — US and writes for the CRM Analytics publication on Medium.

Scott Eaton
Opens in a new window Opens in a new window Opens in a new window
Social Accounts
Slack ProfileOpens in a new window Tableau PublicOpens in a new window LinkedInOpens in a new window TrailblazerOpens in a new window
Languages
English
Talk to me about...
- Data Careers
- Dashboard Documentation
- Dashboard Standards
Scott is a data visualization and business intelligence professional with a passion for using data to tell meaningful stories and a strong advocate for accessibility in data visualization. He believes accessibility should be part of the default design, not an afterthought. He enjoys sharing knowledge, supporting emerging data professionals, and helping others navigate their own career paths in the data industry. He is an avid Trekkie and gamer and during football season, he can usually be found cheering on the Ohio State Buckeyes on Saturdays and the Cleveland Browns on Sundays.

Sean Lin
Opens in a new window Opens in a new window
Social Accounts
Slack ProfileOpens in a new window LinkedInOpens in a new window
Languages
Chinese, English
Sean’s Tableau journey began with building dashboards and analytics solutions and grew into a passion for data storytelling, community, and technical innovation. As a 3x Tableau DataDev Ambassador and Tableau Public Ambassador, he has enjoyed exploring Tableau APIs, building creative solutions, and sharing technical knowledge with the community. In 2026, he looks forward to continuing this journey, experimenting with new ideas, pushing the boundaries of what’s possible with Tableau, and inspiring others to build and create.

Sebastien Henry
Opens in a new window Opens in a new window Opens in a new window
Social Accounts
Slack ProfileOpens in a new window Tableau PublicOpens in a new window LinkedInOpens in a new window GithubOpens in a new window
Languages
English, French, Spanish
Talk to me about...
- Tableau
- AI
- Integration
I'm Sebastien, a Senior AI/Data Engineer based in Austin with nearly 20 years in enterprise BI. Tableau has been my constant through that whole journey — from my first Desktop dashboards to Prep, Cloud, Pulse, and now Tableau Next. What keeps me hooked is the moment a viz makes a room go quiet and then start asking better questions. Today I spend my days bridging Tableau with agentic AI, and I love sharing what I learn with the community. Honored to be a Tableau Ambassador again in 2026.

Sebastine Amede
Opens in a new window Opens in a new window Opens in a new window
Social Accounts
Slack ProfileOpens in a new window Tableau PublicOpens in a new window LinkedInOpens in a new window
Languages
English
Talk to me about...
- Data visualization
- Data Analytics
- Headless Analytics
Sebastine is an Analytics consultant who love to share practical tableau tips with the data community. He is passionate about making complex visualization concepts approachable and helping others get better. Outside of work he enjoys cafe hopping, board games, working out and cooking.

Seiji_Suna
Opens in a new window Opens in a new window
Social Accounts
Slack ProfileOpens in a new window Tableau PublicOpens in a new window X ProfileOpens in a new window BlogOpens in a new window
Languages
Japanese
Talk to me about...
- Tableau Dashboard Design
- Data Visualization & Community
- Tennis & Sports
I started working in data aggregation and visualization around 2009 and first encountered Tableau in 2018. Although I used Tableau for years, I was a latecomer to the community. Joining it expanded my network and brought incredible learning and growth. Wanting to share this, I co-organize with @sho_szk_. Held offline monthly for beginners, it features a unique study session where we build a Viz based on the main food for our networking party. From beginners to experts, everyone can enjoy it!

Sekou Tyler
Opens in a new window Opens in a new window Opens in a new window
Social Accounts
Slack ProfileOpens in a new window Tableau PublicOpens in a new window LinkedInOpens in a new window YouTubeOpens in a new window BlogOpens in a new window
Languages
English
Talk to me about...
- AI
- Tableau
- Modern Data Stack
I'm Sekou Tyler, founder and CEO of Royal Blue Analytics, a Nashville based data analytics and AI consulting firm, and I've spent over a decade helping teams turn messy data into decisions they can act on. A lot of that started with Tableau, and what began as building dashboards eventually turned into teaching, speaking, and helping other people find their footing in the community. Serving as a Tableau Ambassador has been a highlight of that, though the best part has always been the people I get to learn from and build with.

Seowoo Chang
Opens in a new window Opens in a new window Opens in a new window
Social Accounts
Slack ProfileOpens in a new window Tableau PublicOpens in a new window LinkedInOpens in a new window TrailblazerOpens in a new window BlogOpens in a new window
Languages
English, Japanese, Korean
Talk to me about...
- Data + Design
- Community
- Books & Writing
Seowoo Chang is a 3x Tableau Ambassador, data analyst, and design researcher connecting data, design, and business decision-making. He holds a Ph.D. in Design from Hongik University and leads the Seoul Tableau User Group. His work focuses on dashboard design, data storytelling, and turning analysis into action. Within his organization, he helps build a data and AI culture by running an internal community, contributing to CoE initiatives, and encouraging practical use in everyday work.

Seoyeon Jun
Opens in a new window Opens in a new window Opens in a new window
Social Accounts
Slack ProfileOpens in a new window Tableau PublicOpens in a new window LinkedInOpens in a new window X ProfileOpens in a new window BlogOpens in a new window
Languages
Korean
Talk to me about...
- Tableau MCP
- Tableau Extension
- Tableau Public
Seoyeon Jun is the founder of DataBridge Lab in Seoul and leader of the Seoul Tableau User Group. Korea's first Tableau Ambassador, she moved from business analyst at AWS to building BI capability with Tableau at Hyundai Motor, Hyundai Mobis, KT, LG Uplus and KB Kookmin Bank. She speaks regularly at DataFam Seoul and user group seminars, most recently on pairing AI with Tableau to design metrics and wireframe dashboards. She teaches mostly non-analysts, because they need the community most and find it hardest to enter, and she shares every deck and prompt she uses.

Serena P
Opens in a new window Opens in a new window
Social Accounts
Tableau PublicOpens in a new window LinkedInOpens in a new window BlogOpens in a new window
Languages
English
Talk to me about...
- Quick Tableau Tips
- Dashboard Design
- Data Viz Best Practices
Serena is a Data School Coach at The Information Lab UK, where she gets to share her passion for data every single day. First discovering Tableau during the interview process, she was instantly hooked by a tool that perfectly bridges her love for data and creativity. Now entering her 3rd year as a Tableau Ambassador, she thrives on finding new ways to teach Tableau, making data visualisation accessible and fun for everyone. Whether building community-focused vizzes or diving into passion projects, she loves using data design as a grounding creative outlet in our rapidly changing world.

Serena Roberts
Twin Cities Tableau User GroupOpens in a new window
She Talks DataOpens in a new window
Data + Women (Annual TC Pre-game event)Opens in a new window
Opens in a new window Opens in a new window
Social Accounts
Slack ProfileOpens in a new window LinkedInOpens in a new window BlogOpens in a new window
Languages
English
Talk to me about...
- Data Strategy
- Data Culture
- Community Building
Serena Roberts is a data and analytics leader with more than two decades of experience across a wide variety of roles. Today, she is the CEO and owner of Moxy Analytics, where she helps organizations solve problems with data and build the skills, practices, and culture to do it well. Recognized as a Tableau Ambassador nine years in a row for her leadership and community-building efforts, Serena is also known for creating welcoming spaces where data professionals can connect, learn, and support one another.

Seulki Kang
Opens in a new window Opens in a new window Opens in a new window
Social Accounts
Slack ProfileOpens in a new window Tableau PublicOpens in a new window LinkedInOpens in a new window YouTubeOpens in a new window BlogOpens in a new window
Languages
English, Korean
Talk to me about...
- Tableau
- AI
- Marketing
I work at the intersection of marketing, data, and AI, creating content for LinkedIn, YouTube, and Threads for an audience of over 20K followers. I also run three communities: Marketing Data Connect (1K+ members), Afterwork AI (2K+ members), and Data+Women Korea. I enjoy turning complex insights into practical, easy-to-understand ideas that people can actually apply in their work.

Seun Adeyemo
Opens in a new window Opens in a new window
Social Accounts
Tableau PublicOpens in a new window LinkedInOpens in a new window X ProfileOpens in a new window BlogOpens in a new window
Languages
English, Yoruba
Talk to me about...
- Dashboard optimization
- Dashboard UI/UX design
- Tableau calculations
I’m a data visualization enthusiast and Tableau developer who has been using Tableau since 2018. My journey has evolved from building dashboards to designing exceptional UI/UX experiences that make complex data comprehensible, engaging, and actionable. I’m passionate about combining analytical thinking, visual storytelling, and thoughtful design to push the boundaries of what dashboards can achieve. My work has been recognized in the Tableau Public community, including the Viz Gallery and the Elisa Fink Award at Tableau Conference 2025.

Seungil Kang
Opens in a new window Opens in a new window Opens in a new window
Social Accounts
Slack ProfileOpens in a new window Tableau PublicOpens in a new window LinkedInOpens in a new window TrailblazerOpens in a new window YouTubeOpens in a new window
Languages
Korean
Talk to me about...
- Tableau certification prep
- Using AI with Tableau
- Teaching Tableau to beginners
Seungil Kang is a data literacy & visualization specialist at BigxData and a Tableau Certified Instructor. Over the past ten years, I have used Tableau to deliver over 800 lectures in Korea, published three books, and obtained various certifications in Tableau, Slack and Salesforce. I have also operated a Tableau community for the past 7 years. This year I have focused on helping our community meet the AI era with confidence - showing how AI can accelerate, not replace, visual analysis - at Agentforce World Tour Korea and DataFam Seoul 2026.

Shangruff Raina
Opens in a new window Opens in a new window Opens in a new window
Social Accounts
Slack ProfileOpens in a new window Tableau PublicOpens in a new window LinkedInOpens in a new window X ProfileOpens in a new window
Languages
English, Hindi
Talk to me about...
- Tableau Design and Wireframes
- Tableau Dashboard interactions (Sets, Parameters etc)
- Tableau Calculations
Shangruff Raina is a Manager, Data Analytics at Tredence, with 11 years of experience turning complex data into clear, actionable insight. He holds a BS in Computer Science from Pune University and an MS in Management Information Systems from the University of South Florida. Specializing in data visualization, analytics, and BI, he designs scalable dashboards that drive smarter, more efficient decisions. Outside work, he's an avid hiker, sneaker collector, and tattoo enthusiast, blending creativity with technical precision.

Shawn Moore
Opens in a new window Opens in a new window Opens in a new window
Social Accounts
Slack ProfileOpens in a new window Tableau PublicOpens in a new window LinkedInOpens in a new window TrailblazerOpens in a new window
Languages
English
Talk to me about...
- Data Visualization & Storytelling
- Tableau Community & User Groups
- Teaching Data & Analytics
Shawn Moore is a data and analytics professional, educator, and organizer of the St. Louis Tableau User Group. He teaches at the graduate level, including data visualization and storytelling, and enjoys helping others turn data into something they can understand and use. He is also interested in helping younger learners build data literacy skills.

Shazeera Ahmad Zawawi
Opens in a new window Opens in a new window Opens in a new window
Social Accounts
Slack ProfileOpens in a new window Tableau PublicOpens in a new window LinkedInOpens in a new window GithubOpens in a new window BlogOpens in a new window PodcastOpens in a new window
Languages
English, French, Malay, Bahasa Indonesia
Talk to me about...
- Data Storytelling
- Tableau and A.I
- Data and Art
I spent 18 years as a human rights lawyer and advocate before pivoting into data analytics. Outside of data, I host The Storytellers podcast, have completed my novel, and channel my creativity through rhythm, bringing a passion for drumming and recently learning to play the gamelan. Merging analytical inquiry, creative writing, and music, I focus on human-centered data storytelling that connects complex realities with empathy and clarity.

Shintaro Tajiri
Opens in a new window Opens in a new window Opens in a new window
Social Accounts
Slack ProfileOpens in a new window Tableau PublicOpens in a new window LinkedInOpens in a new window TrailblazerOpens in a new window GithubOpens in a new window X ProfileOpens in a new window BlogOpens in a new window
Languages
English, Japanese
Talk to me about...
- Teaching Data Science with Tableau
- AI in EducationJapanese Anime
- Japanese Anime
I'm a professor at Kanda University of International Studies near Tokyo, where I direct the DX and Institutional Research office. I teach statistics to language and humanities majors who arrive convinced they aren't good with numbers, and Tableau is how I change their minds. The rest of my week goes into turning enrollment, survey, and learning data into dashboards faculty actually use to make decisions. I organize the Hokuriku Tableau User Group, and I've been an Academic Ambassador since 2023. Outside of data, ask me about anime.

Sho Suzaki
Social Accounts
Tableau PublicOpens in a new window X ProfileOpens in a new window BlogOpens in a new window
Languages
Japanese
I work at an IT company in Japan, helping organizations unlock value from data with Tableau. I'm now in my third year as a Tableau Ambassador (2024–2026). I lead “Tableauうまうま会 (Tableau Umauma Group),” a monthly Tokyo-based user group pairing Viz-building with food-themed meetups. Since 2024, we've held 29 sessions, including events in Kansai, Tohoku, and Fukuoka. I also lead DATA Saber Council's Engagement Order, growing its certification community. Through these activities, I strive to lower barriers to joining the Tableau community, empowering more people to grow together.

Shreya Arya
Opens in a new window Opens in a new window Opens in a new window
Social Accounts
Slack ProfileOpens in a new window Tableau PublicOpens in a new window LinkedInOpens in a new window GithubOpens in a new window X ProfileOpens in a new window YouTubeOpens in a new window BlogOpens in a new window
Languages
English, Hindi
Talk to me about...
- Jewellery design
- Creative data viz
- Helping people learn Data & AI
Shreya is a 2× Tableau Visionary and 3× Tableau Ambassador specialising in data and AI enablement. She loves finding the beauty in data and making complex ideas easier to understand. She shares data viz tips on her blog, Data Viz Fairy, and co-leads Back 2 Viz Basics, helping newcomers grow their Tableau skills and confidence. Her work has been featured 14× as Viz of the Day and won “The Kelly Martin Best Designer” at the 2024 Tableau Conference. In her free time, she enjoys making jewellery, water colouring and spending time in nature.

Shubhadeep Saha Mondal
Opens in a new window Opens in a new window Opens in a new window
Social Accounts
Slack ProfileOpens in a new window Tableau PublicOpens in a new window LinkedInOpens in a new window TrailblazerOpens in a new window GithubOpens in a new window X ProfileOpens in a new window YouTubeOpens in a new window BlogOpens in a new window
Languages
English, Hindi, Bengali
Talk to me about...
- CRM Analytics
- Tableau Next
- Data Preparation
Salesforce CRM Analytics Consultant at Devlytics Global - my own venture! Responsible for everything CRM Analytics - from creating the recipe to delivering the dashboards. 3x Salesforce Certified. Love working with data and I always try to help by answering anyone in the community with a question, as the community has helped me gained whatever knowledge I have today! I did my Bachelors' in Electrical Engineering in 2022 and have worked with many people and helped them build the CRM Analytics solution they were looking for! I want to make data enjoyable and lively to everyone looking at it!

Shuntaro Iseri
Opens in a new window Opens in a new window Opens in a new window
Social Accounts
Slack ProfileOpens in a new window Tableau PublicOpens in a new window LinkedInOpens in a new window
Languages
English, Japanese
Talk to me about...
- Tableau for Education
- Data Science Education
- Educational Data Mining
Shuntaro Iseri is an Associate Professor at Kanda University of International Studies in Japan. His expertise is in higher education and Institutional Research (IR), focusing on data science education for non-STEM undergraduates. He develops teaching practices using Tableau and shares his work globally. Between 2022 and 2024, he led students to one championship and two runner-up finishes in Japan's Tableau competitions. He welcomes international collaboration in education and research with universities, industry, and local communities.

Sid Saythongphet
Opens in a new window Opens in a new window Opens in a new window
Social Accounts
Slack ProfileOpens in a new window Tableau PublicOpens in a new window LinkedInOpens in a new window TrailblazerOpens in a new window
Languages
English
Talk to me about...
- Tableau Interactivty
- Tableau Table Calculations
- Tableau Map Layers
I started using Tableau in 2023 when I pivoted from health/fitness into data analytics. The creative freedom hooked me instantly, especially coming from a background in Dance. Three years in, I'm happy to active in the community: co-leading Data Pride NYC's quarterly meetups, building my Tableau Public portfolio with fun, creative visuals, and now coaching the next wave of data analysts. Dance taught me composition and rhythm, which turns out that translates surprisingly well to a dashboard. Still telling stories, just with data now.

Siebe Grijpma
Opens in a new window Opens in a new window
Social Accounts
Slack ProfileOpens in a new window LinkedInOpens in a new window BlogOpens in a new window
Languages
Dutch, English, German
Talk to me about...
- Tableau and Salesforce extensions and apps
- Write back solutions for process integration and What If
- Ai orchestrated workflows
Siebe Grijpma is Chief Product Officer at Infotopics | Apps for Tableau and an active Tableau DataFam member. He helps organizations turn analytics into action through Tableau Extensions, APIs, AI, write-back solutions, and integrated workflows. A speaker at Tableau Conferences, User Groups, and Salesforce events worldwide—including a keynote in Singapore—Siebe makes complex topics practical, accessible, and focused on adoption, innovation, and business impact.

Srikanth Thiruveedula
Opens in a new window Opens in a new window Opens in a new window
Social Accounts
Slack ProfileOpens in a new window Tableau PublicOpens in a new window LinkedInOpens in a new window TrailblazerOpens in a new window GithubOpens in a new window YouTubeOpens in a new window
Languages
English, Hindi
Talk to me about...
- Tableau MCP - Unleashing power AI
- Tableau Automations in Cloud using Metadata API
- Latest Features in Tableau
I started my IT freelance journey with Tableau, and it completely changed my career. With 15+ years of overall experience, I’ve spent 6+ years in Tableau consulting and training, working across 30+ Tableau projects. I love teaching, mentoring, and giving back to the community. Today, I’m working as a Project Lead in Data Analytics & Data Engineering for a US-based manufacturing company — a dream role with an amazing work culture. Beyond work, I’m a Shuttle badminton and PC gaming enthusiast, a foodie, and a huge animal lover. Pets are my soul — especially my parrot! 🦜

Stephen Borders
Opens in a new window Opens in a new window
Social Accounts
Tableau PublicOpens in a new window LinkedInOpens in a new window TrailblazerOpens in a new window
Languages
English, Spanish
Talk to me about...
- Tableau Maps, GIS & Spatial Analytics
- Food Insecurity & Social Determinants of Health
- Teaching Tableau & Building Data Literacy
I’m a professor, researcher, and longtime Tableau enthusiast who loves helping people see what their data is really telling them. My work sits at the intersection of healthcare, public health, food insecurity, and GIS. I use Tableau extensively in teaching and community projects and developed The Chart Doctor, an AI-supported tool that helps students improve their visualizations. I’m always happy to talk about mapping, data storytelling, teaching Tableau, or using data to make a real-world difference.

Steve Adams
Opens in a new window Opens in a new window Opens in a new window
Social Accounts
Slack ProfileOpens in a new window Tableau PublicOpens in a new window LinkedInOpens in a new window TrailblazerOpens in a new window GithubOpens in a new window X ProfileOpens in a new window YouTubeOpens in a new window BlogOpens in a new window
Languages
English
Talk to me about...
- Tableau and AI
- Enterprise Enablement
- Dashboards nobody uses
Most analysts I meet aren't scared of AI. They're stuck. Locked-down tools, nervous stakeholders, and nowhere safe to practise. Getting people past that is my job. Thirty-five years in data, a decade+ of it teaching Tableau, and I am the more handsome part of the grAI Team, working out in public how analysts really use GPT's, agents, MCP and xxxAgentxxx's. I curate Tableau Bites, a free twice-weekly newsletter drawn from the DataFam community authors, and co-lead the UK Healthcare Tableau User Group. Say hello. Bring a dashboard you're stuck on. Tell me your deepest AI fears...

Steve Martin
Opens in a new window Opens in a new window Opens in a new window
Social Accounts
Slack ProfileOpens in a new window Tableau PublicOpens in a new window LinkedInOpens in a new window TrailblazerOpens in a new window GithubOpens in a new window BlogOpens in a new window
Languages
English
Talk to me about...
- SQL with Custom SQL
- Performance and Optimisation
- Calculations and dashboard interactivity
Steve loves a problem, particularly complex ones, and in addition to the Tableau Community, you can find him at StackExchange, Reddit and Qlik. Data is Steve's real passion, and as an SQL engineer and analyst, Tableau is the tool to satisfy those passions: Building (data warehouses), transforming, modelling, mining, performance optimisation and analytics; though it wasn’t until late 2008, when he built his first Tableau dashboard, that he was able to see just how powerful interactive analytics could be. Steve builds as dynamic as possible, which usually means parameters, and CustomSQL.

Steve Wood
Opens in a new window Opens in a new window Opens in a new window
Social Accounts
Slack ProfileOpens in a new window Tableau PublicOpens in a new window LinkedInOpens in a new window TrailblazerOpens in a new window X ProfileOpens in a new window YouTubeOpens in a new window BlogOpens in a new window
Languages
English
Talk to me about...
- Tough Tableau Problems
- Data Strategy and Culture
- Hiking
Steve leads a data team in New Zealand. Originally from the UK, he took a year out to travel and never returned. A background in software led to BI before he moved into CX and human‑centred design. CX left Steve passionate about blending qualitative and quantitative insights. Tableau became his data exploration tool of choice when the CEO asked for "more maps!" and the Tableau community fueled the fire. Out of work you'll find Steve hiking or tackling tough Tableau problems on Slack. Either way it's about exploration and discovery, so drop Steve a line if he can help with your Tableau journey.

Sudhaa Ramakrishnan
Opens in a new window Opens in a new window Opens in a new window
Social Accounts
Slack ProfileOpens in a new window Tableau PublicOpens in a new window LinkedInOpens in a new window
Languages
English, Tamil
Talk to me about...
- Tableau!
- Networking
- Harry Potter
I am a Data Visualization Engineer who turns messy data into charts that actually makes sense. I co-lead the Accessibility TUG, working to make sure visualizations works for everyone. Beyond that, I value supporting people by mentoring through career relaunches, talking about Tableau, tackling data problems, or just lending an ear when someone needs one. Outside of work, I love meeting fellow data folks, tackling a good puzzle, exploring new cities and most importantly nerding out as a proud Potterhead!

Sumit Rathore
Opens in a new window Opens in a new window Opens in a new window
Social Accounts
Slack ProfileOpens in a new window Tableau PublicOpens in a new window LinkedInOpens in a new window TrailblazerOpens in a new window YouTubeOpens in a new window
Languages
English, Hindi
Talk to me about...
- Tableau Tips, Development & Advanced Techniques
- Tableau Community & User Groups
- Tableau Next & AI
My Tableau journey started during my Master’s at Saint Joseph’s University, where I picked up Tableau thinking it would just be another tool to learn. Fast forward 7+ years, and it’s become a career, a creative outlet, and honestly, a little obsession. I’m now an Analytics Manager, one of the leaders of the Philadelphia Tableau User Group, and a frequent speaker at Tableau events. I love teaching, helping others level up their Tableau skills, and finding new ways to push Tableau further and have some fun with it along the way.

Tabitha Diaz
Opens in a new window Opens in a new window
Social Accounts
Tableau PublicOpens in a new window LinkedInOpens in a new window TrailblazerOpens in a new window
Languages
English
Tabitha Diaz is a Solutions Consultant with The Information Lab US, where she helps teams demystify their data and build solutions for complex problems. As a career changer, Tabitha loves giving back to the community that has helped develop her skills. That is why she is passionate about contributing to the community through her participation as a co-lead for several TUGs, including Data + Women NYC, Comunid[Datos] NYC, and Tableau Buddy Talks User Group. Outside of Tableau, Tabitha loves trying new food, reading, rock climbing, and crafting anything and everything!

Takeshi Hiratsuka
Opens in a new window Opens in a new window
Social Accounts
Slack ProfileOpens in a new window LinkedInOpens in a new window TrailblazerOpens in a new window X ProfileOpens in a new window BlogOpens in a new window
Talk to me about...
- Connecting Tableau with Data 360 to Unlock Customer Intelligence
- Exploring the Future of Analytics with Tableau and Slackbot
- Passionate activities such as acroyoga
I am the first customer of Tableau Next. My Tableau journey is driven by the belief that every Tableau User can become a superhero in their organization by turning data into meaningful insights and actions. I explore innovative use cases centered on Data 360, connecting Tableau with CRM, AI, and emerging technologies while exchanging ideas with community members worldwide. I especially love experimenting with collaborations between Slackbot and Tableau products to create new ways for people to interact with data and make smarter decisions.

Takumi Saito
Opens in a new window Opens in a new window Opens in a new window
Social Accounts
Slack ProfileOpens in a new window Tableau PublicOpens in a new window LinkedInOpens in a new window X ProfileOpens in a new window
Languages
Japanese
Talk to me about...
- Quality Control Analytics
- Process Data Analytics
- Cooking and Baking
Takumi Saito is a dedicated data advocate leveraging hands-on experience in production, quality, and manufacturing engineering. After spearheading his plant's DX project, he now drives internal data utilization alongside capital investment management. As a DATA Saber and Tableau Desktop Specialist, Takumi is passionate about empowering the community. Since 2025, he serves as an Organizer for the Tableau Japan Manufacturing User Group and handles manufacturing tech and quality data in the Dataset Project. He aims to make manufacturing smarter through the power of Tableau.

Tanya Lomskaya
Opens in a new window Opens in a new window
Social Accounts
Tableau PublicOpens in a new window LinkedInOpens in a new window GithubOpens in a new window X ProfileOpens in a new window
Languages
English, Russian
Talk to me about...
- Data Storytelling
- Economic Data
- AI-Assisted Data Visualization
Based in Georgia as a freelance BI developer, Tanya enjoys using Tableau's visual capabilities to uncover hidden narratives in economic and social data and convey them through clear and engaging visualizations. She is particularly interested in exploring the technical limits of Tableau (now combined with AI) and discovering new perspectives on familiar and seemingly well-understood social phenomena.

Tarun Gupta
Opens in a new window Opens in a new window Opens in a new window
Social Accounts
Slack ProfileOpens in a new window Tableau PublicOpens in a new window LinkedInOpens in a new window TrailblazerOpens in a new window X ProfileOpens in a new window YouTubeOpens in a new window BlogOpens in a new window
Languages
English, Hindi
Talk to me about...
- Tableau Next + Data Cloud + Slack + Agentforce
- Any thing about Tableau With Slack
- How to Build Your Career Through the Tableau Community — As a Member or Leader
Founder @ Vivaansh Consulting | Jaipur TUG Leader | Tableau Ambassador | Salesforce Marketing Champion | Certified Slack & Tableau Architect | SuperBadge & Slack SME | 4x Tableau Certified | 3x Slack Certified | 19x Salesforce Certified I help organizations build a connected Data + AI ecosystem—powering the System of Action with Agentforce, System of Engagement with Slack, and System of Insight with Tableau. I work at the intersection of AI, data, CRM, collaboration & analytics, helping companies turn technology into business outcomes with Slack Migration, Implementation & Adoption

Tatyana Schaubmayr
Opens in a new window Opens in a new window Opens in a new window
Social Accounts
Slack ProfileOpens in a new window Tableau PublicOpens in a new window LinkedInOpens in a new window TrailblazerOpens in a new window
Languages
English, Bulgarian
Talk to me about...
- Tableau Desktop
- Data Storytelling
- Chart Choices
I turn data into beautiful, usable interfaces that help people see and understand what matters. Throughout my career in analytics, I’ve worked with organisations going through data transformation, using Business Intelligence and visualisation to help them make better use of their data. I’ve spent over a decade with Tableau, designing solutions and managing dashboard products across Energy, Publishing & Media, Telecoms and Finance. I enjoy pushing the boundaries of Tableau Desktop, particularly around user interaction, and bringing it all together through thoughtful data storytelling.

Tedy Iskandar
Opens in a new window Opens in a new window Opens in a new window
Social Accounts
Slack ProfileOpens in a new window Tableau PublicOpens in a new window LinkedInOpens in a new window TrailblazerOpens in a new window GithubOpens in a new window X ProfileOpens in a new window YouTubeOpens in a new window
Languages
English
Talk to me about...
- Tableau Desktop & Public
- Tableau Server
- Tableau Prep
Tedy Iskandar spearheads data analytics integration at Indonesian Customs and Excise, Ministry of Finance, driving data-informed decision-making and policy formulation. A dedicated Tableau Ambassador and leader of the Jakarta Tableau User Group, Tedy leverages Tableau Desktop, Server, and Prep to empower the community and transform public sector data into actionable strategy.

Tesshin Takagi
Opens in a new window Opens in a new window
Social Accounts
Slack ProfileOpens in a new window Tableau PublicOpens in a new window X ProfileOpens in a new window YouTubeOpens in a new window BlogOpens in a new window
Languages
Japanese
Talk to me about...
- Workout Wednesday
- Technical Topic of Tableau
Tesshin Takagi is a Tableau Ambassador in Japan passionate about making Tableau learning accessible and engaging. He leads “WOWを勝手に広め隊,” helping beginners take their first steps into Workout Wednesday, and livestreams his own challenge-solving process on YouTube. His content won the Best Content Creator Award at The Vizzies during Tableau Conference 2026. He also supports DATA Saber - Bridge, contributes to the Japan Tableau User Group, and shares work on Tableau Public. Through these activities, he hopes to inspire more people to learn, participate, and contribute to the DataFam.

Tim Dries
Opens in a new window Opens in a new window Opens in a new window
Social Accounts
Slack ProfileOpens in a new window Tableau PublicOpens in a new window LinkedInOpens in a new window TrailblazerOpens in a new window GithubOpens in a new window X ProfileOpens in a new window YouTubeOpens in a new window BlogOpens in a new window PodcastOpens in a new window
Languages
Dutch, English
Talk to me about...
- AI & Agentic Analytics
- Visual Analytics
- Tableau Next And Agentforce
Domain Lead AI & Agentic Analytics @ biztory Background in Sociology / Statistics / Curiosity Two years ago, "AI in analytics" meant a model politely suggesting you might want a bar chart. We dragged pills onto shelves by hand, and Explain Data felt like magic. Fast forward ... the market and science accelerated, the only thing I tried was to keep up and had a crazy fun time in doing so. We ain't see nothing yet, may your senses be always in your favor. Stay safe, it'll get wild now! May your senses, be always in your favor. Peace.

Timea Toltszeki
Opens in a new window Opens in a new window Opens in a new window
Social Accounts
Slack ProfileOpens in a new window Tableau PublicOpens in a new window LinkedInOpens in a new window TrailblazerOpens in a new window BlogOpens in a new window
Languages
English, Hungarian, Portuguese, Spanish
Talk to me about...
- Community building
- Agentic analytics
An experienced data and technology leader, her expertise lies in analytical engineering, CRM optimization, and agentic analytics. She is passionate about mentoring and teaching, combining technical skills with a commitment to building collaborative communities and empowering others through data. She began using Tableau 10 years ago, which ultimately blossomed into a career. You could find her unwinding with her dog on long walks or pushing limits at the gym with CrossFit or Brazilian Jiu-Jitsu.

Timothy Vermeiren
Opens in a new window Opens in a new window Opens in a new window
Social Accounts
Slack ProfileOpens in a new window Tableau PublicOpens in a new window LinkedInOpens in a new window TrailblazerOpens in a new window GithubOpens in a new window X ProfileOpens in a new window
Languages
Dutch, English, French
Talk to me about...
- DataDev
- APIs
- Automation
Timothy is a passionate analytics & automation developer from Belgium with a comprehensive knowledge of Tableau, n8n, and related technical topics. At Biztory, he acts as lead “DataDev” where he gets to work on fun Tableau-oriented products and interesting automations. His hobbies include running, playing the guitar or drums (poorly), listening to metal heavy music, and tinkering with home automation and dashboards. Last but not least, he made it to 2018 Global Iron Viz Champion! Aside from that, he has been a Tableau DataDev Ambassador since 2020, and an n8n Ambassador since 2026.

Tobiloba Babajide
Opens in a new window Opens in a new window Opens in a new window
Social Accounts
Slack ProfileOpens in a new window Tableau PublicOpens in a new window LinkedInOpens in a new window GithubOpens in a new window X ProfileOpens in a new window BlogOpens in a new window
Languages
English, Yoruba
Talk to me about...
- Tableau calculations and parameters
- Tableau Prep
I am a Data Analyst and Tableau Ambassador who turns messy, disconnected data into dashboards people actually use. I have been recognized 7x for Tableau Viz of the Day and named a Datafam Rising Star (2025). I'm certified through Google's Business Intelligence and Data Analytics programs, along with University of Pennsylvania coursework in Operations, People, and Customer Analytics. Outside of work, I love playing musical instruments and watching football.

tomo Wakamatsu
Opens in a new window Opens in a new window Opens in a new window
Social Accounts
Slack ProfileOpens in a new window Tableau PublicOpens in a new window LinkedInOpens in a new window X ProfileOpens in a new window
Languages
Japanese
Talk to me about...
- Data Platform
- Data Driven Culture
I am honored to be named Ambassador for the 6th year in a row! I currently work as a Solution Engineer at Snowflake, and Tableau is a key partner that integrates very well with Snowflake. The user community I belong to is a wonderful place where I can meet a diverse range of amazing people and discover new opportunities. I absolutely love this place. Recently, I have been working on developing new community leaders and creating sustainable systems.

Tore Levinsen
Opens in a new window Opens in a new window Opens in a new window
Social Accounts
Slack ProfileOpens in a new window Tableau PublicOpens in a new window LinkedInOpens in a new window TrailblazerOpens in a new window X ProfileOpens in a new window YouTubeOpens in a new window BlogOpens in a new window
Languages
English, Norwegian, Swedish, Danish
Talk to me about...
- TinyTableauTips
- Prep
- Visual Analytics Best Practices
Tore is a Tableau Jedi and Visionary from Bergen, Norway, who has been using Tableau since version 7.0, back when filled maps were still exciting new territory. He has trained 4,000+ people across 16 countries and 3 continents, leads TUG Norway and Data+Maps TUG, and is a 6x Tableau Ambassador and 2x Visionary. He also co-organized Vizit London and Vizit Berlin. His Tableau collection includes 130+ T-shirts and hoodies, because apparently dashboards aren’t the only thing worth collecting. Outside Tableau, he's following Liverpool FC and Lillestrøm SK.

Tristan Guillevin
Opens in a new window Opens in a new window
Social Accounts
Tableau PublicOpens in a new window LinkedInOpens in a new window X ProfileOpens in a new window YouTubeOpens in a new window BlogOpens in a new window
Languages
English, French, Spanish
Tristan is a Tableau Visionary, Ambassador, and the 2017 Iron Viz Champion, recognized for pushing the boundaries of Tableau with custom extensions and tools. At Ladataviz, the remote-first studio he co-runs with his partner, he has built products that expand visualization possibilities, simplify KPI dashboards, and connect Figma directly to Tableau. Alongside product development, he shares educational content on YouTube and through a newsletter, all with the goal of democratizing data visualization skills while running a location-independent business.

Tsubasa Kitahara
Opens in a new window Opens in a new window
Social Accounts
Tableau PublicOpens in a new window LinkedInOpens in a new window X ProfileOpens in a new window YouTubeOpens in a new window
Languages
English, Japanese
Talk to me about...
- Viz of the Day
- Vizualization
- Map Layer
I work at Yokohama Rubber, a global tire manufacturer. As a core organizer of the Japan Tableau Manufacturing User Group, I'm collaborating with community friends to build the "Sample Super Factory" dataset. Passionate about great design, I also run "VOTDNews"—posting daily short videos celebrating amazing "Viz of the Day" creations. Please come check out my videos! I'm honored to be a 2026 Ambassador.

Tsutomu Ikeda
Opens in a new window Opens in a new window
Social Accounts
Slack ProfileOpens in a new window Tableau PublicOpens in a new window TrailblazerOpens in a new window X ProfileOpens in a new window BlogOpens in a new window
Languages
Japanese
Talk to me about...
- Dashboard Design
- Data Storytelling
- Tableau Community
I work as a data analyst and automotive engineer in Japan. I started using Tableau to explore how data visualization can make complex information easier to understand and communicate. Since then, I’ve continued to develop my skills through projects, community activities, and challenges such as Makeover Monday and Workout Wednesday. Creating visualizations has become one of my passions, especially exploring dashboard design and data storytelling. I also organize local Tableau community events in Kansai, and I hope to share what I learn and help more people discover the possibilities of Tableau.

Valerie Madojemu
Opens in a new window Opens in a new window Opens in a new window
Social Accounts
Slack ProfileOpens in a new window Tableau PublicOpens in a new window LinkedInOpens in a new window GithubOpens in a new window BlogOpens in a new window
Languages
English
Talk to me about...
- Sports Analytics
- Building With AI
Valerie works in data and got her start with Tableau at The Information Lab back in 2022. After she left, she started freelancing and building in public, sharing what she built and learnt in her free time. With AI becoming more and more popular, she believes understanding the core concepts of data is more important than ever, which is why she's going to keep learning, sharing content online and seeing how it all fits in with AI.

Vani Agarwal
Opens in a new window Opens in a new window
Social Accounts
Tableau PublicOpens in a new window LinkedInOpens in a new window X ProfileOpens in a new window BlogOpens in a new window
Languages
English, Hindi
Talk to me about...
- Data Storytelling
- Viz Best practices
- Tableau + AI
Data Analytics & BI professional at Expedia Group with 5+ years of Tableau under my belt. I'm a highly motivated explorer who loves getting my hands dirty with data challenges—the messier, the better! I thrive on tackling complex problems, building dashboards that actually drive decisions, and mentoring others to level up their analytics game. Whether it's optimizing performance, designing beautiful visualizations, or helping teammates crack a tricky problem, I'm all in. Here to share what I've learned, collaborate, and grow with this incredible community. Let's make data work! 📊

Veronica Simoes
Opens in a new window Opens in a new window Opens in a new window
Social Accounts
Slack ProfileOpens in a new window Tableau PublicOpens in a new window LinkedInOpens in a new window X ProfileOpens in a new window BlogOpens in a new window
Languages
English, Portuguese, Spanish
Talk to me about...
- Tableau MCP
- Tableau Pulse
- Tableau Agent
I started my journey with the Tableau community in 2011 as a volunteer, analyzing data related to anonymous reports of violence in Rio de Janeiro. I was part of the early growth of our Tableau community, where I am constantly learning. In 2023 we managed to create a single Brazil community(https://usergroups.tableau.com/brazil-tableau-user-group/) where we bring clients and professionals to share knowledge and success stories. My biggest commitment is to be able to bring more professionals to our community in Portuguese and achieve greater engagement.

Victory Omovrah
Opens in a new window Opens in a new window Opens in a new window
Social Accounts
Slack ProfileOpens in a new window Tableau PublicOpens in a new window LinkedInOpens in a new window TrailblazerOpens in a new window GithubOpens in a new window X ProfileOpens in a new window
Languages
English
Talk to me about...
- Visualization best practices
- Portfolio building
- AI & Data
Victory Omovrah is a Data Analyst, Tableau Visionary, and 3x Tableau Ambassador from Ekiti, Nigeria. She helps companies solve business problems with data, building dashboards that turn complex information into clear decisions. Victory co-leads Back-2-Viz-Basics and speaks at User Groups worldwide. A 5x Visualization of the Day (VOTD) honoree and the only female Visionary in Nigeria, she is committed to helping analysts everywhere be seen, wherever they are.

Vignesh Suresh
Opens in a new window Opens in a new window
Social Accounts
Slack ProfileOpens in a new window Tableau PublicOpens in a new window X ProfileOpens in a new window BlogOpens in a new window
Languages
English, Hindi
Talk to me about...
- Calculated Fields
- Parameters
- Dashboards
I have been using Tableau for 6 yrs participating in Makeover Monday, ProjectHealthViz and SportsVizSunday. Learning Tableau for fun and for work has been great. I have 4 VOTDs and Community Highlight feature and multiple Datafam Roundup features.

Viraj Bhargave
Opens in a new window Opens in a new window Opens in a new window
Social Accounts
Slack ProfileOpens in a new window Tableau PublicOpens in a new window LinkedInOpens in a new window TrailblazerOpens in a new window X ProfileOpens in a new window
Languages
English, Hindi
Talk to me about...
- Data Data Visualisation
- Community Enagagement
- Anything in general!
Viraj is a Tableau Newbie at heart! A passionate community engagement, data visualization, and Tableau enthusiast, he loves exploring new areas to learn, grow, and help others. His enthusiasm for community development and engagement, and his willingness to problem-solve and assist others, have made him one of the most approachable people in the community. He is a co-leader of the elite Tableau Newbies User Group. He has created a fantastic social media persona – DataTasteMaker.

Viviane Lefebvre
Opens in a new window Opens in a new window Opens in a new window
Social Accounts
Slack ProfileOpens in a new window Tableau PublicOpens in a new window LinkedInOpens in a new window
Languages
English, French
Talk to me about...
- Embedding API
- Tableau Cloud
- Tableau Calculations
Viviane currently works as the Head of Data & BI with the accounting, audit, and consulting firm Batt in France. She got both a Master in Management and a MicroMaster in Statistics and Data Science, a great combination to understand the needs of clients and the demands of data analytics. She has been using Tableau and Python for 5 years now and keeps on learning new tips and tricks to share with her team, and people around the world. Her hobbies? Travelling and rugby.

Vlad Horbachenko
Opens in a new window Opens in a new window
Social Accounts
Tableau PublicOpens in a new window LinkedInOpens in a new window YouTubeOpens in a new window
Languages
English, Ukrainian
Talk to me about...
- Design
- Solving Problems
- AI and visualization
I started my Tableau journey in 2024, and it quickly became more than just a tool - it's how I think through problems. In my day-to-day work as a data analyst, I love building dashboards that turn messy business questions into clear, actionable answers. But Tableau is also my creative outlet: I enjoy telling stories with data about the things I'm passionate about, from films and TV shows to sports and psychology. Whether it's solving a real business challenge or visualizing something purely for the joy of it, I'm always looking for the story hiding in the numbers.

Vorapol Santhadkolkarn
Opens in a new window Opens in a new window Opens in a new window
Social Accounts
Slack ProfileOpens in a new window Tableau PublicOpens in a new window LinkedInOpens in a new window TrailblazerOpens in a new window GithubOpens in a new window BlogOpens in a new window
Languages
English
Talk to me about...
- AI
- Vibe Coding
- Data Platform
Vorapol is a Director of Solutions Architecture with nearly two decades of experience in Data & Analytics. He specializes in modern Data & AI platforms, data engineering, AI engineering, and MCP-enabled solutions across AWS, Azure, GCP, Databricks, and Snowflake. With over ten years of Tableau expertise, he is a certified Tableau Architect and Consultant, with experience in enterprise Data & AI architecture, platform integration, Tableau APIs, Connected Apps, and MCP integrations. Vorapol co-leads the Bangkok Thailand User Group and is the founder of Godhand.DEV, his developer persona.

Waqar Ahmed Shaikh
Opens in a new window Opens in a new window Opens in a new window
Social Accounts
Slack ProfileOpens in a new window Tableau PublicOpens in a new window LinkedInOpens in a new window TrailblazerOpens in a new window GithubOpens in a new window X ProfileOpens in a new window YouTubeOpens in a new window BlogOpens in a new window
Languages
English, Urdu
Talk to me about...
- Data Visualization & Dashboard Design
- Building a Data Portfolio
- Traveling & Photography
Waqar is a Senior BI Engineer and Tech Lead at ADDO AI who believes the fastest way to grow in data is to build in public. He created the DataFam Growth Loop, a framework he teaches at user groups to turn practice vizzes into portfolios, portfolios into reputations, and reputations into opportunities. A Tableau enthusiast since 2022, he leads the Pakistan Tableau User Group and has earned five Viz of the Day features. He also writes on Medium and creates YouTube content for aspiring data professionals. Based in Karachi, he enjoys photography, travel, and spending time with his two sons.

WenBin
Opens in a new window Opens in a new window
Social Accounts
Tableau PublicOpens in a new window LinkedInOpens in a new window TrailblazerOpens in a new window GithubOpens in a new window
Languages
Chinese, English
Talk to me about...
- Data Storytelling
- Geospatial Analytics
- MCP
A digital adventurer with a passion for everything data and AI, WenBin continues his journey as a Tableau ambassador, where he hopes to continue contributing to the #DataFam community. WenBin is also a sales engineer with Dataiku, where he helps regional companies and institutions couple advanced machine learning and agentic AI innovations with strategic enterprise outcomes. Looking forward to greater collaborations with the #DataFam <3

Whitney Wood
Opens in a new window Opens in a new window Opens in a new window
Social Accounts
Slack ProfileOpens in a new window Tableau PublicOpens in a new window LinkedInOpens in a new window GithubOpens in a new window X ProfileOpens in a new window BlogOpens in a new window
Languages
English
Talk to me about...
- Zelda & Pokémon
- Unique Charts
- Cats
Whitney began using Tableau Public in early 2019 and was immediately captivated by the fun and rewarding nature of creating visualizations outside of work. She has a passion for designing creative and uncommon charts in Tableau Public; her favorite vizzes to create are the ones that make people ask, “Wait… Tableau can do THAT?” She’s also an artist, former punk-band drummer, lifelong Zelda and Pokémon player, and devoted cat mom.

Will Perkins
Opens in a new window Opens in a new window Opens in a new window
Social Accounts
Slack ProfileOpens in a new window Tableau PublicOpens in a new window LinkedInOpens in a new window GithubOpens in a new window X ProfileOpens in a new window
Languages
English, Portuguese
Talk to me about...
- Business Dashboards
- Soccer
- Travelling
Will has spent over a decade in financial services as an analytics executive leading teams and building Tableau ecosystems that serve thousands of users. He's focused on helping business users see the art of the possible with data and visualization, and believes the best part of this work is enabling teams to build skills and grow into the platform. He's a 5x Tableau Ambassador. He's active on both X and LinkedIn sharing analytics strategy and community insights on adoption and building trust in data products. He also posts random gifs and talks about soccer.

Will Sutton
Opens in a new window Opens in a new window Opens in a new window
Social Accounts
Slack ProfileOpens in a new window Tableau PublicOpens in a new window LinkedInOpens in a new window TrailblazerOpens in a new window GithubOpens in a new window YouTubeOpens in a new window BlogOpens in a new window
Languages
English
Talk to me about...
- Anything AI
- Video games
- British cuisine
Will has been an avid Tableau user since 2013, using it to bring insights to firms across the UK. Will co-leads the #GamesNightViz community project, the AI + Tableau user group, won Iron Viz in 2022.

Yamag
Opens in a new window Opens in a new window
Social Accounts
Slack ProfileOpens in a new window Tableau PublicOpens in a new window X ProfileOpens in a new window
Languages
Japanese
Talk to me about...
- Workout Wednesday
- Makeover Monday
1.DATA Saber (since Feb 2023) 2nd Name: The Way of the Data-Driven 2.Tohoku Tableau User Group 3.IT Company Employee Former: Systems Engineer (Telecommunications & Finance sectors) Current: Budget & Performance Management Staff

Yasushi Ishikawa
Social Accounts
Tableau PublicOpens in a new window X ProfileOpens in a new window BlogOpens in a new window
Languages
English, Japanese
Talk to me about...
- Sports Data Visualization
- Leveraging Opendata
- Teaching Tableau
Very excited to come back here again. I work in Finance and in analysis role for long time. Tableau has changed my life - breakthrough in day-to-day work, win a couple of viz competition, an opportunity of classes in University, and finally changed main job(new!). As a Tableau Ambassador, I do try sharing my experience/thoughts - how much we can benefit, even not perfectly skilled. And just quick and casual use of Tableau is good enough to change the game. Sometimes drag+drop still quicker than prompting. Let's make more value from your data, and impact to the world!

Yehwan Hwang
Social Accounts
LinkedInOpens in a new window BlogOpens in a new window
Languages
English, Korean
Talk to me about...
- Swim
- Cycle
- Run
Yehwan Hwang is a Data Visualization Consultant and the Founder of Vizney (www.vizney.com), helping clients solve complex challenges with data. With a decade of enterprise Tableau experience, he focuses on advanced dashboard architecture, data semantics, and the core principles of visual analytics. Through his blog, he shares practical workarounds and in-depth technical guides to empower the global DataFam to build cleaner, more impactful visualizations.

Yoshie Mitamura
Opens in a new window Opens in a new window
Social Accounts
Tableau PublicOpens in a new window LinkedInOpens in a new window X ProfileOpens in a new window YouTubeOpens in a new window BlogOpens in a new window
Languages
Japanese
Talk to me about...
- Tableau Prep
I focus on helping business users turn data into action. My Tableau journey has taught me that great analysis starts with great data preparation, which is why I focus on Tableau Prep. Through our user group, I aim to go beyond sharing new features by also sharing practical tips, data preparation approaches, and ideas for improving upstream data environments so more people can confidently work with data and make data-driven decisions.

Yoshinori Monden
Opens in a new window Opens in a new window Opens in a new window
Social Accounts
Slack ProfileOpens in a new window Tableau PublicOpens in a new window LinkedInOpens in a new window TrailblazerOpens in a new window X ProfileOpens in a new window BlogOpens in a new window
Languages
Japanese
Talk to me about...
- Tableau Server Repository DB
- Cats Vizzes
Yoshinori works in MUFG's Data Platform CoE Division and helped select Tableau as its enterprise BI platform in 2020. Today, it serves 15,000+ active users. As a Data Steward, he supports users and manages 10,000+ data assets. Outside of work, he is also a member of the DATA Saber Council's Engagement Order and a Wayseeker. Passionate about knowledge sharing, he has blogged for 32 consecutive months, sharing Tableau Server guides and fictional stories about data-driven companies. A devoted cat lover, he creates Tableau Public vizzes inspired by his beloved cat.

Yoshitaka Arakawa
Opens in a new window Opens in a new window
Social Accounts
Tableau PublicOpens in a new window LinkedInOpens in a new window GithubOpens in a new window X ProfileOpens in a new window BlogOpens in a new window
Languages
English, Japanese
Talk to me about...
- Tableau MCP
- Tableau x AI
My data journey began with Tableau in 2017, and my mission has stayed the same ever since: expand what each person can do with data. The tools for that keep changing. I started with dashboards and training, and I share what I learn through my blog on Tableau and data visualization, and as a Workout Wednesday coach. Today I'm most excited about Tableau × AI: Tableau MCP, AI extensions, and agents that turn a plain-language question into analysis.

Youssef Dawoud
Opens in a new window Opens in a new window Opens in a new window
Social Accounts
Slack ProfileOpens in a new window Tableau PublicOpens in a new window LinkedInOpens in a new window GithubOpens in a new window
Languages
Arabic, English
Talk to me about...
- Data
- AI
Youssef "Joe" Dawoud is a Data & AI professional working in R&D. His Tableau journey began with an intro course and grew into two years as a Tableau Academic Ambassador, culminating in serving as an Iron Viz Judge in 2024 and 2025. He co-leads the Arabic AI+ Tableau User Group, growing a thriving community of Arabic-speaking data enthusiasts around visualization and AI. Joe excels at turning complex datasets into compelling insights and visual stories that drive innovation and impact, with a relentless curiosity that keeps him ahead of emerging trends and eager to collaborate.

Yusei Sakai
Opens in a new window Opens in a new window
Social Accounts
Slack ProfileOpens in a new window Tableau PublicOpens in a new window GithubOpens in a new window X ProfileOpens in a new window
Languages
Japanese
Yusei Sakai is a data analyst who, alongside building and supporting BI dashboards, actively fosters learning and connections through Tableau. He led the Japan Tableau User Group annual meeting in both 2024 and 2025, and continues to lead it in 2026. From 2025 to 2026, he also contributed as a member of the DATA Saber Council. He participates in various community activities, connecting users from beginners to experts, and engages warmly on X , supporting user connections. Yusei continues to expand the world of data with his peers, enjoying the journey while fostering collaboration.

Yusuke Nakanishi
Opens in a new window Opens in a new window Opens in a new window
Social Accounts
Slack ProfileOpens in a new window Tableau PublicOpens in a new window LinkedInOpens in a new window TrailblazerOpens in a new window GithubOpens in a new window X ProfileOpens in a new window BlogOpens in a new window
Languages
Japanese
Talk to me about...
- Tableau Server
- Data Management
- Self-Made/Custom Keyboard
Yusuke is a seasoned specialist at NTT WEST, managing data analytics infrastructure, leading analytical initiatives, and fostering internal data communities. He sharpened his skills through projects like #MakeoverMonday and #WorkoutWednesday, and by sharing work on Tableau Public. A four-time Tableau Ambassador, he was named a Tableau Visionary in 2026. He has also served as a #WorkoutWednesday co-leader since 2024 and hosted “#Vizトーク,” a weekly live discussion on X Spaces about Tableau and analytics, since 2022.

Yuta Sakai
Opens in a new window Opens in a new window Opens in a new window
Social Accounts
Slack ProfileOpens in a new window Tableau PublicOpens in a new window LinkedInOpens in a new window TrailblazerOpens in a new window GithubOpens in a new window X ProfileOpens in a new window BlogOpens in a new window
Languages
English, Japanese
Talk to me about...
- Dashboard Design
- Calculation
- How to learn Tableau
I work in enterprise sales at a telecom company, helping customers use their data. I've used Tableau for about 10 years. In 2019 I found the Tableau Community, captivated by its passion and creativity. Since then I've posted 370+ vizzes on Tableau Public and hosted or spoken at 59 events. With fellow members I launched Open Data Sugoi ("sugoi" = amazing), advancing open data through hackathons with local governments. I've also run Viz Create Show, a viz recreation race, with community members. In 2025 I won Viz Games, Japan's Iron Viz. I'll keep growing our data culture together.

Zach Bowders
Opens in a new window Opens in a new window Opens in a new window
Social Accounts
Slack ProfileOpens in a new window Tableau PublicOpens in a new window LinkedInOpens in a new window X ProfileOpens in a new window PodcastOpens in a new window
Languages
English
Zach Bowders is a seasoned data visualization specialist, honored as a Hall of Fame Tableau Visionary and 6-time Tableau Ambassador. With over 275 public vizzes, 13 Viz of the Day awards, and 2 Tableau Community Vizzie Awards, he lives by “Viz what you love,” blending his passion for pop culture, like comics and movies, into engaging data stories. Zach spent 13 years at St. Jude Children’s Research Hospital, honing his craft, and now drives insights as a Business Analytics Director at JLL. Hosting the Data + Love podcast, he shares his enthusiasm for data and storytelling, connecting with the global data community.

Zach Leber
Opens in a new window Opens in a new window
Social Accounts
Tableau PublicOpens in a new window LinkedInOpens in a new window TrailblazerOpens in a new window BlogOpens in a new window
Languages
English
Talk to me about...
- mapping and spatial sets
- queue analysis for two-date data
Zach has been a Tableau evangelist since 2010. As director of analytics for the world's largest DNA sequencing center, he created Tableau data visualizations of lab and project operations including real-time genomic sample tracking. Zach was the co-chair of the Boston Tableau User Group from 2011 to 2019, hosting, organizing, and speaking at dozens of meetings. In his current role at a medical device company, Zach uses Tableau to analyze sales, service, and cloud treatment data from neuromodulation machines installed worldwide.

Zainab
Opens in a new window Opens in a new window
Social Accounts
Tableau PublicOpens in a new window LinkedInOpens in a new window X ProfileOpens in a new window YouTubeOpens in a new window
Languages
English, Yoruba
Talk to me about...
- Community
- Career Development
- Business Dashboards, Storytelling and Design
Zainab Ayodimeji is a Senior Data Scientist based in London, currently driving product and analytics decisions at Spotify. She is also a Tableau Public Ambassador and co-lead of the London Tableau User Group, where she champions learning and connection within the #DataFam. She passionate about community and using data visualisation to tell stories that resonate and to inspire others to grow their skills. In her spare time, she enjoys adventure, reading fiction and exploring different hobbies.

Zak Geis
Opens in a new window Opens in a new window Opens in a new window
Social Accounts
Slack ProfileOpens in a new window Tableau PublicOpens in a new window LinkedInOpens in a new window
Languages
English
Talk to me about...
- Tableau Cloud
- Enterprise Analytics
- AI
Zak Geis is a Senior Director of Engineering at JPMorgan Chase, where he leads the global analytics technology, products, and platforms organization serving 300,000+ users firm-wide. A 3× Tableau Visionary and longtime Data Dev Ambassador, he's spent his career making analytics platforms scale — and helping the people on them do more with data. He speaks regularly on analytics architecture, data engineering, and applied GenAI, and believes great tooling should get out of the analyst's way.

Zohra Tamjeed
Opens in a new window Opens in a new window Opens in a new window
Social Accounts
Slack ProfileOpens in a new window Tableau PublicOpens in a new window LinkedInOpens in a new window X ProfileOpens in a new window
Languages
English, Hindi, Urdu
Talk to me about...
- Data Storytelling & Dashboard Design
- Tableau Learning & Career Growth
- Building & Growing Data Communities
Zohra Tamjeed is a healthcare analytics professional who loves turning data into stories that make an impact. Passionate about Tableau and data storytelling, she enjoys sharing what she learns, mentoring others, and making data visualization approachable and fun. She is a co-leader of the Chicago Tableau User Group and loves bringing people together to learn, connect and grow. When she is not analyzing data, you'll probably find her creating content, learning something new, or cheering on the DataFam!

Zsófia Nika
Opens in a new window Opens in a new window
Social Accounts
Tableau PublicOpens in a new window LinkedInOpens in a new window
Languages
English, German, Hungarian
Talk to me about...
- Design and UX
- Data Stories
- Cats
Zsófia is working at Apple as a Data Visualization Lead, providing insightful and appealing data visualization solutions to various stakeholders. She started building her Tableau Public portfolio in 2022 back in Hungary and joined the amazing community of DataFam. In her private portfolio, her main focus is on the storytelling and design, while experimenting with Tableau’s features and capabilities. Besides dataviz, she is passionate about running, traveling and classical music.

Zyad Wael
Opens in a new window Opens in a new window Opens in a new window
Social Accounts
Slack ProfileOpens in a new window Tableau PublicOpens in a new window LinkedInOpens in a new window TrailblazerOpens in a new window GithubOpens in a new window BlogOpens in a new window
Languages
Arabic, English
Zyad is a BI Engineer who discovered Tableau in 2023 during his senior year of college. Since then he has become four times Tableau certified and an active voice in the DataFam, regularly creating on Tableau Public through challenges like Makeover Monday, Back to Viz Basics, and Workout Wednesday. He now co leads the Cairo Tableau User Group, organizing meetups, speaker sessions, and an initiative that brought Tableau to hundreds of students across Egyptian universities. His work has earned him a Viz of the Day and 5+ DataFam featured blogs. Returning as a Tableau Ambassador for a second year,

なむーん / Natsuki
Opens in a new window Opens in a new window
Social Accounts
Slack ProfileOpens in a new window Tableau PublicOpens in a new window X ProfileOpens in a new window BlogOpens in a new window
Languages
English, Japanese, Korean
I am a foreign language major in Japan, passionate about combining language learning with data analytics. My Tableau journey began with a desire to communicate insights effectively, leading me to complete the DATA Saber program and speak at Tableau Student User Group events. Tableau transformed complex numbers into powerful stories, inspiring me to share this joy with others. As a Student Ambassador, I am excited to empower fellow students, host engaging learning opportunities, and build an inclusive, supportive environment within the global DataFam community!

ハルカ
Social Accounts
Tableau PublicOpens in a new window X ProfileOpens in a new window
Languages
Japanese
Talk to me about...
- 表計算
- ビジュアライズ
- ダッシュボードレイアウト
福岡大学商学部商学科に在籍し、ゼミで主にマーケティングとデータ分析を中心に学んでいます。2024年9月にはTableau Publicのデータを用いたLT登壇も経験しました。その後、ゼミ活動を通してTableauを本格的に活用するようになり、企業データを用いた分析や施策提案に取り組んできました。 2025年9月からアイリスオーヤマとの企業連携プロジェクトに参加し、ECサイトの購買・アクセスデータをTableauで分析しました。年代別の購買傾向やリピート状況、併売傾向などを可視化し、分析結果をもとに施策を考えることで、「データを見る」だけでなく、ビジネス上の課題や顧客行動を考えるためにTableauを活用する経験を積みました。 また、今年4月から6月には学生向けTableauコンペ「Viz Rookies」にはチーム「まいぺーす」の参加しました。若年層の地域定住をテーマにデータ分析・可視化を行い、決勝に進出し、発表をし、またコミュ広げました。チームで一つのVizを作り上げる中で、分析だけでなく、伝わる可視化やストーリー設計についても学びました。
See the latest from Tableau Ambassadors
探索 Tableau 社群
想要尋找通往 Tableau 成功的路徑嗎?沒有單一種方式提升您的資料技能,但是所有道路都會帶您經過 Tableau 社群。透過眾多可供您使用的社群資源,無論您在天涯海角,都可以與志同道合的人士交流、學習、成長並獲得啟發。
瞭解詳情 TABLEAU 社群行為準則