ConSol* reduces reporting time from weeks to minutes

Henning von Kielpinski, Departmental Manager of Business Development Partner & Alliances at ConSol*
After evaluating a variety of solutions, the company decided to implement Tableau, because the self-service model fit the company’s philosophy for employees to act as independent entrepreneurs. Today, decision makers can create their own reports within one hour. Day-to-day decision making at the company has seen significant improvements. By introducing Tableau Server, ConSol* has taken a big step towards their goal of democratizing company data throughout the organization.
Delayed reporting hinders strategic progress
ConSol* Consulting & Solutions Software GmbH, founded in 1984, is a German IT full service provider for businesses of all sizes. Aside from their headquarters in Munich and branch offices in Düsseldorf, the company has subsidiaries in Dubai, Austria, Poland, and Romania. The company portfolio includes a complete range of IT services as well as its self-developed business process management software ConSol*CM.
ConSol* uses a solution by Navision for Enterprise Resource Planning (ERP) and stores everything in a data warehouse. Apart from typical business purposes such as cost, revenue, and profit analysis, ConSol* mainly requires reports for project controlling. “For us it’s essential to know how well the individual departments are doing,” says Henning von Kielpinski, Departmental Manager of Business Development Partner & Alliances at ConSol*.
“We are a consulting company, a software developer, and a product manufacturer. In most cases we are working on projects. That’s why it is so important to know which projects are going well and which aren’t, how the timelines are developing, when invoices are sent, and when payments are received. We also need to keep track of how our actual expenses compare to our calculations.”
In the past, one employee in controlling was responsible for creating all business and project related reports for the executive management. That employee was working with data warehouse extracts in Excel. As the business grew more complex, the waiting times for reports and analyses grew longer and longer.
“We had to wait up to four weeks for our latest figures, for things such as month-end closing,” says Henning von Kielpinski. “We couldn’t accept these delays in getting our basis for important and time-critical decisions any longer.”
With seven people constantly requesting new or modified reports, the controlling department was forced to hand out Excel files with base data and leave the analysis to the executives themselves. There simply wasn’t the capacity to deal with the ever increasing urgency of requests. “Because even the BI tools of our data warehouse were falling way short of our requirements, we were looking for an analytics solution that was powerful, fast and visually pleasing. But it should also be easy enough to use that non-mathematicians like myself could use it,” says Henning von Kielpinski.
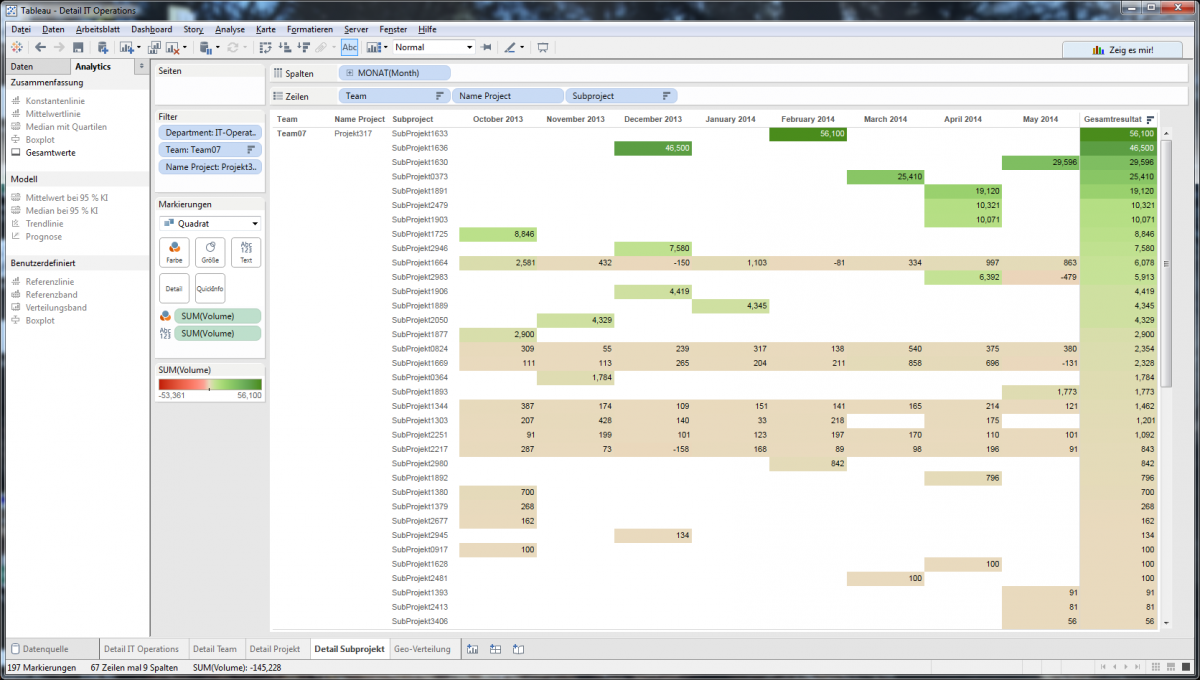
With color highlighting, information in conventional table format is easier to digest at a glance.
ConSol* democratizes data with self-service BI
When ConSol* was looking for a new tool, they evaluated a variety of solutions such as SAP Business Objects or Pentaho. They all proved to be either too complex or inflexible for the intended purpose. Either way, the time to result was not satisfactory. “As a departmental manager, I required quick analytics. So I decided to install the Tableau trial and started to look at the data for my department with that,” says Henning von Kielpinski. “After a few days I was so happy with the tool, I bought a Tableau Desktop license with my own money,” he adds with a smile. “The company reimbursed me for that quite a while ago.”
Today, ConSol* has provided seven Tableau Desktop licenses to the main decision makers within the company. Tableau workbooks are now the format of choice for sharing analyses between employees.
While some employees receive static reports exported from Tableau to PDF, “Tableau Reader allows colleagues to take an active approach and explore their datasets from different angles,” explains Henning von Kielpinski.
In total, about 30 employees regularly use Tableau. Based on user satisfaction, the number of use cases for Tableau is steadily growing. The company has recently purchased a license for Tableau Server to deliver results to an even larger number of users. “We are trying to break up a few colleague’s isolationist mentality regarding data. Our goal is to further democratize data throughout the company,” says Henning von Kielpinksi.
Tableau users at ConSol* have taken advantage of Tableau training resources to advance their skills. “We were all helping each other and using the many and varied online training videos by Tableau, when we were trying to get something done for a more specific use case,” says Henning von Kielpinski.
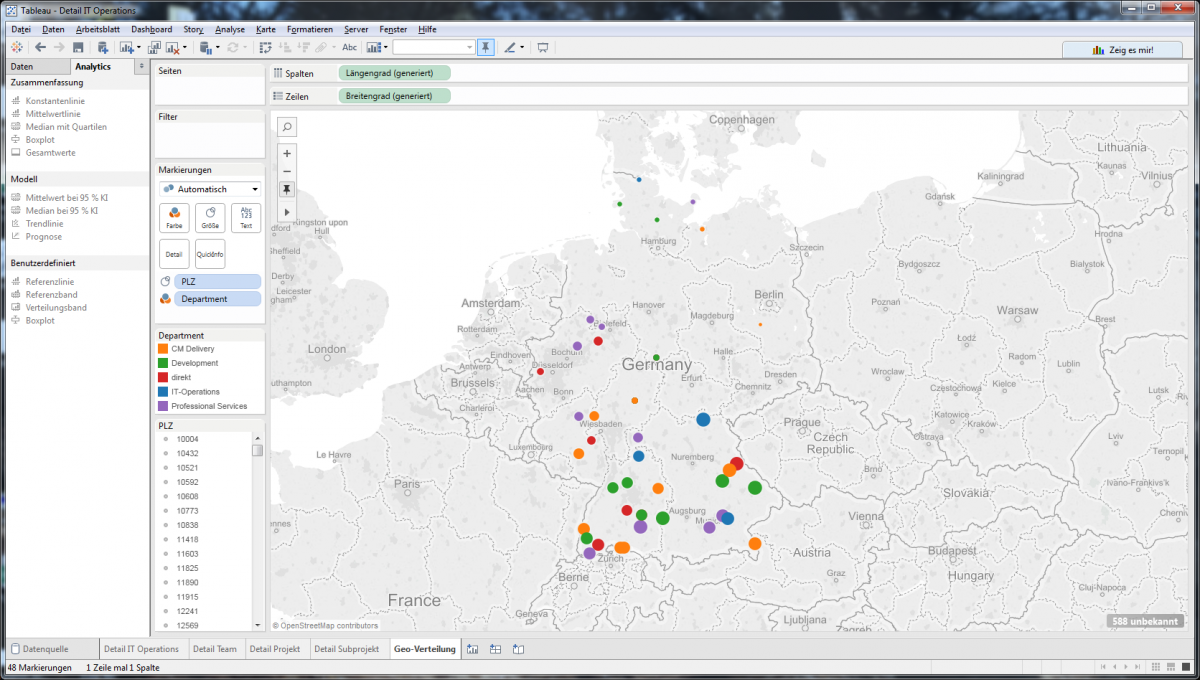
In Tableau, creating a geographical map from your data only takes a few clicks.
After a few days I was so amazed that I went and bought a Tableau Desktop license using my own money.
ConSol* removes reporting bottleneck and dependency on centralized support
With Tableau, ConSol* was able to completely remove delays in reporting. Project controlling and financial reports that took up to four weeks to complete are now available within the hour. But not just report creation is much faster. Thanks to the visual quality and interactivity, report consumption is now also fast and flexible. As a result, day-to-day decision making has improved significantly.
“My colleagues now have a far more targeted approach to searching the data of their areas of responsibility for the insights they need,” says Henning von Kielpinski. “They are no longer bound by a rigid analytics concept. There is no waiting involved when a report needs to be created differently or changed in some way. They have become completely self-sufficient. That’s what I call self-service BI. Our company philosophy is to have employees act as co-entrepreneurs. Tableau is a great help in putting that into practice. With Tableau we were able to create the conditions for largely independent action throughout the entire company.”
The employee in controlling who used to dedicate his days to creating reports for executives, is now able to spend more time on more worthwhile projects, such as creating unified reporting standards or a comparative analysis of all ConSol* business units.
By adopting Tableau Server, ConSol* will soon be able to make data accessible to everyone throughout the organization. The Tableau Server access control functions integrate seamlessly with the in-house security concept to keep sensitive data safe.
When a customer was submitting a ticket about server performance of his ConSol*CM setup, the company stumbled upon another interesting use case for Tableau. A ConSol* employee used Tableau to analyze the customers’ server logs. He identified unusual load patterns and quickly found the cause of poor server performance. As a result, ConSol* was able to quickly apply countermeasures and resolve the issue to the customers’ full satisfaction.
At the moment, ConSol* is evaluating the integration of Tableau Server components into their own ConSol*CM solution for the analysis of server logs.
“Working with Tableau was always a pleasure. We always saw eye-to-eye. It was just good chemistry,” concludes Henning von Kielpinski. “Despite - or maybe because of - the many options and capabilities of the software, working with Tableau always feels like I can follow my play instinct to my heart’s content. It is fast, very easy to use and non-destructive with regards to the source data. Personally I really appreciate being able to run Tableau on a laptop computer without requiring access to a mainframe – as is the case with a lot of other solutions. That’s something I wouldn’t want to miss.”
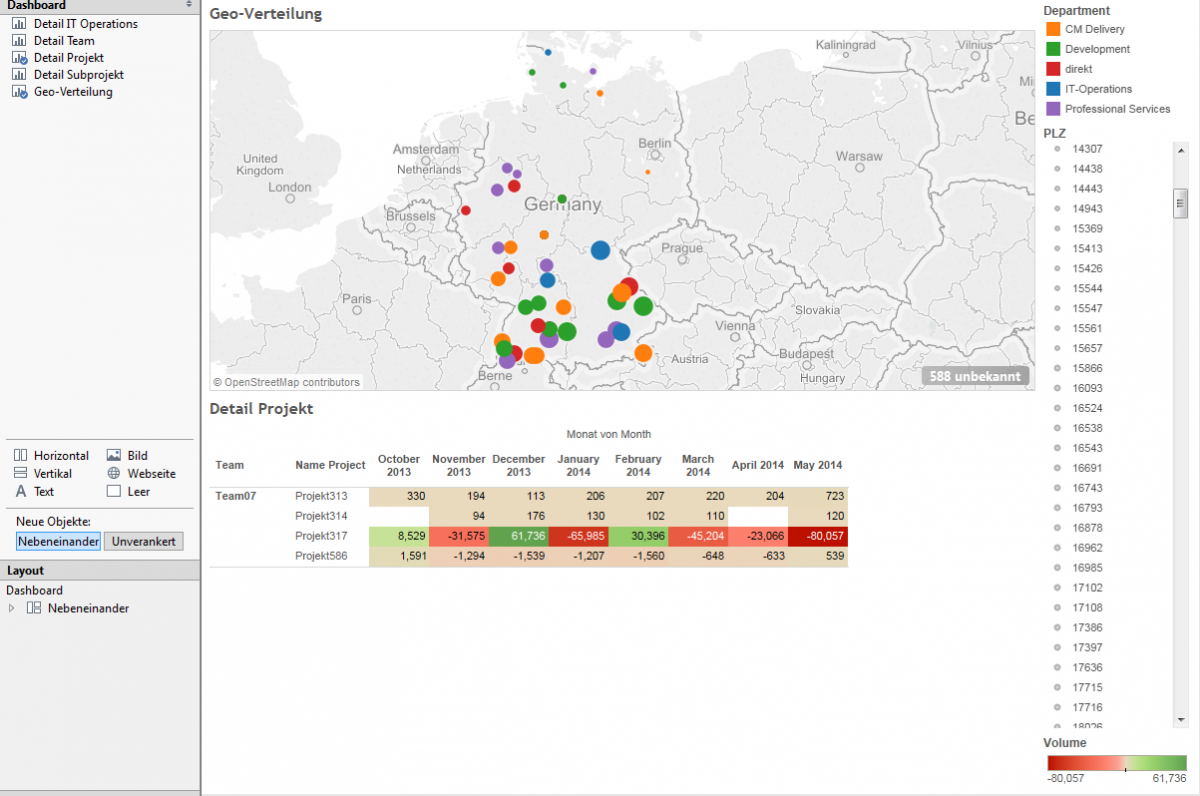
With dashboards like this one, executives at ConSol* monitor their projects geographically and over time.
My colleagues now have a far more targeted approach to searching the data of their areas of responsibility for the insights they need. They are no longer bound by a rigid analytics concept. There is no waiting involved when a report needs to be created differently or changed in some way. They have become completely self-sufficient. That’s what I call self-service BI.