Masabi makes city transport smarter with help from Tableau

Masabi uses Tableau Desktop to integrate and analyze different datasets from the Masabi JustRide mobile ticketing platform. Transport operators use Tableau Cloud to access analytics in the cloud. With real-time, easy-to-understand insights, operators make faster decisions, drive rewarding passenger experiences, and better schedule services according to demand—increasing operational efficiency.
Revolutionizing how the transport industry looks at data
Masabi makes city transport smarter by simplifying ticketing and streamlining fare collection, validation, and management for transport providers. The organization’s solutions are live with the New York MTA and LA Metrolink, together with 23 other operators around the world, including RTA Las Vegas, Transport for Athens, the MBTA in Boston, RTA in New Orleans and London’s Thames Clippers.
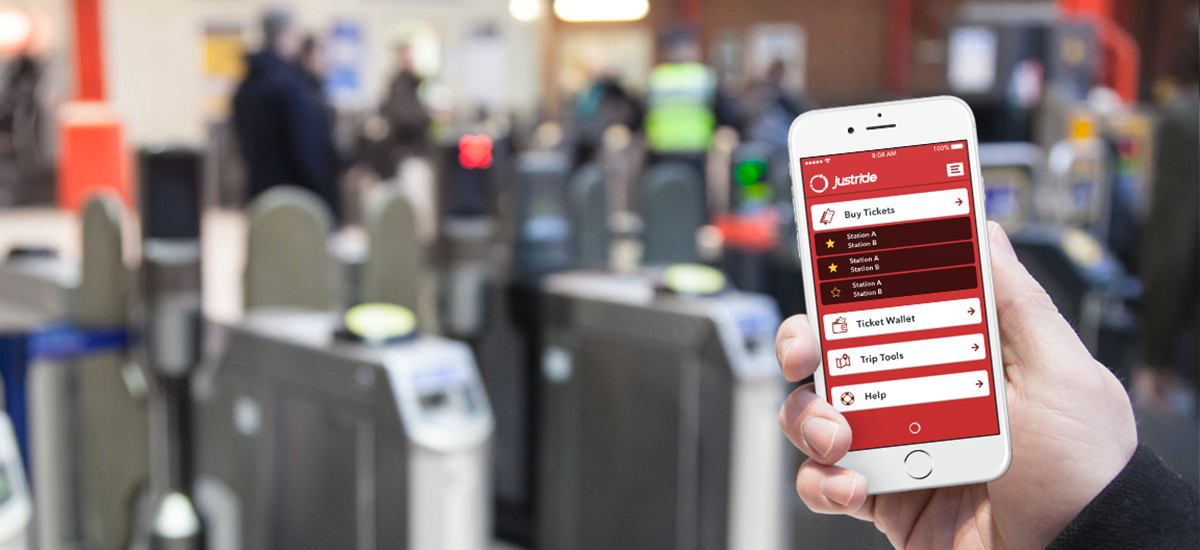
Masabi is helping each of these cities become a more integrated, tech-enabled location—a smart city. Millions of passengers use Masabi’s JustRide mobile ticketing and fare collection platform to buy and display tickets on their smartphone for faster, frictionless journeys. As a result, transport authorities and operators save money on expensive ticket vending machines, avoid the costs of printing tickets, and reduce the overall cost of fare collection.
JustRide captures data in real-time, on everything from ticket sales and validation, to customer service administration and ticket management. We want the operators to use this data to enhance the passenger travel experience and improve operations.
One of the key advantages of the JustRide platform is the real-time data collected on ticket sales. Masabi collects data points every time a ticket is purchased, activated for use, and scanned by transit staff. This gives agencies insight into ticket sales volume, traffic between individual stations, and patterns in travel schedules.
This is a new domain for most operators. Before adopting JustRide, operators relied on basic ticket sales data to understand customers’ travel behavior, collecting data from physical gate ticketing systems weeks, sometimes months, after the passengers’ date of travel. But they would rarely analyze the data due to the age and limited scope. When they did, the analysis was limited to understanding total transaction volumes. In extreme instances, some operators simply relied on a staff member using a handheld ‘clicker’ to manually count passengers on a train or a station.
“Masabi is at the forefront of the shift away from the cost and hassle of issuing and handling physical ticket media,” explains Jonathan Hyde, Product Manager, Masabi, “During every transaction, JustRide captures data in real-time, on everything from ticket sales and validation, to customer service administration and ticket management. We want the operators to use this data to enhance the passenger travel experience and improve operations.”
The challenge for Hyde and the Masabi product management team is to present the data and subsequent reports to the transport providers. To provide value to operators, the reports had to be scalable, secure, and intuitive.
Flexible, secure reporting with Tableau Cloud
When looking for a business intelligence solution, Hyde says they “applied the same three criteria to every problem [they] solve in Product Management.”
Hyde explains, “First, any solution we choose has to be valuable. I knew from my previous experience at another company with Tableau visual analytics that the operators would love the flexibility and simplicity. Second, the solution has to be useable—and few software applications are as easy and intuitive as Tableau. And third, it needs to be feasible. Tableau Cloud, in particular, is quick and easy to deploy, and requires very little training. For all these reasons, we chose Tableau to support our analytics strategy for operators.”

That initial cloud analytics deployment was quick and easy, and involved very little development effort. Most importantly, both the Masabi executives and the operators we presented it to loved what they saw—it opened their eyes to insights they never knew were possible.
Hyde first had to convince Masabi’s senior management that Tableau was the right choice. “We needed to quickly demonstrate the power of visual analytics. With Tableau, we can integrate different datasets from the JustRide mobile ticketing platform and instantly turn them into compelling visualizations.”
“That initial cloud analytics deployment was quick and easy and involved very little development effort. Most importantly, both the Masabi executives and the operators we presented it to loved what they saw—it opened their eyes to insights they never knew were possible,” says Hyde.
Today, Masabi utilizes Tableau Desktop to integrate different datasets from the JustRide mobile ticketing platform and create interactive dashboards. Masabi delivers data to operators with Tableau Cloud, with two instances — one in the U.S. and one in the E.U. supporting operators in each respective location.
Before operators go live on JustRide, Masabi works with them to determine the metrics they want to see. Masabi adapts the standard reports to ensure that operators can answer their core questions. For example, the most popular stations, purchasing times, or mobile operating system usage. Masabi sets permissions in Tableau Cloud so that providers only see the data that is relevant to them—keeping data secure.
When asked about training, Hyde commented, “The great thing about Tableau is how quickly you see the results. The free Tableau product videos, online learning, and forums are great places to learn more, and have definitely helped speed up our deployment.”
I filtered the data, refreshed it, and presented the new view in about 30 seconds. They were blown away by this.
More rewarding passenger experiences
With help from Masabi and Tableau, operators now have access to data that can drive an even more rewarding passenger experience, while increasing operational efficiency. For example, with improved visibility into peak demands, operators can schedule services accordingly.
With Tableau Cloud, Masabi can connect and refresh data that lives in the cloud without additional technical complexities. Masabi also has the flexibility to host instances in the United States or Europe—depending on the customer’s location.
Hyde recalls, “We were in the U.S. meeting with a transit authority. We had shown them some of the standard analytical views we thought might be useful. But then one of the clients in the meeting wanted to see how many tickets were being sold at one of their primary stations on a Monday morning. I filtered the data, refreshed it, and presented the new view in about 30 seconds. They were blown away.”
This agile reporting is also helping to scale Masabi’s business. The company is a lean, fast-growing organization, working with transport providers large and small —many of which have been in business for many decades and employ tens of thousands of staff. “You can’t underestimate the difference a small company like Masabi is making to the way these operators look at their data,” say Hyde.
Hyde concludes, “Operators need to understand how JustRide is used on their network and who is using it. Tableau gives them that fast, intuitive insight.”