ความโดดเด่นของแดชบอร์ด Tableau
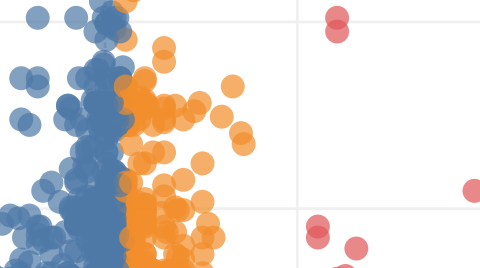
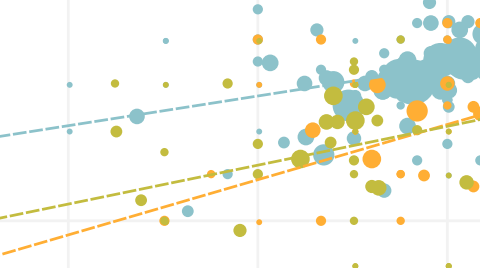
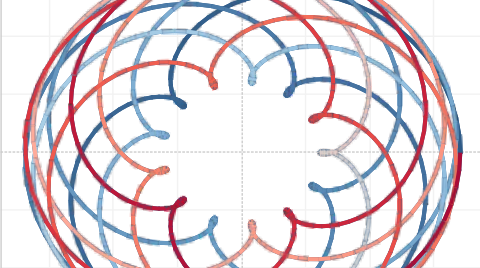
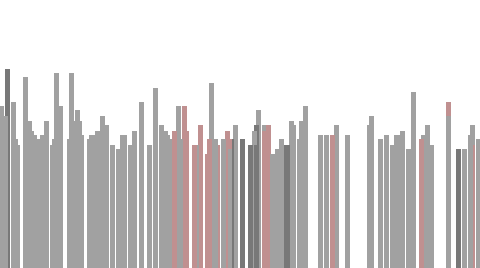
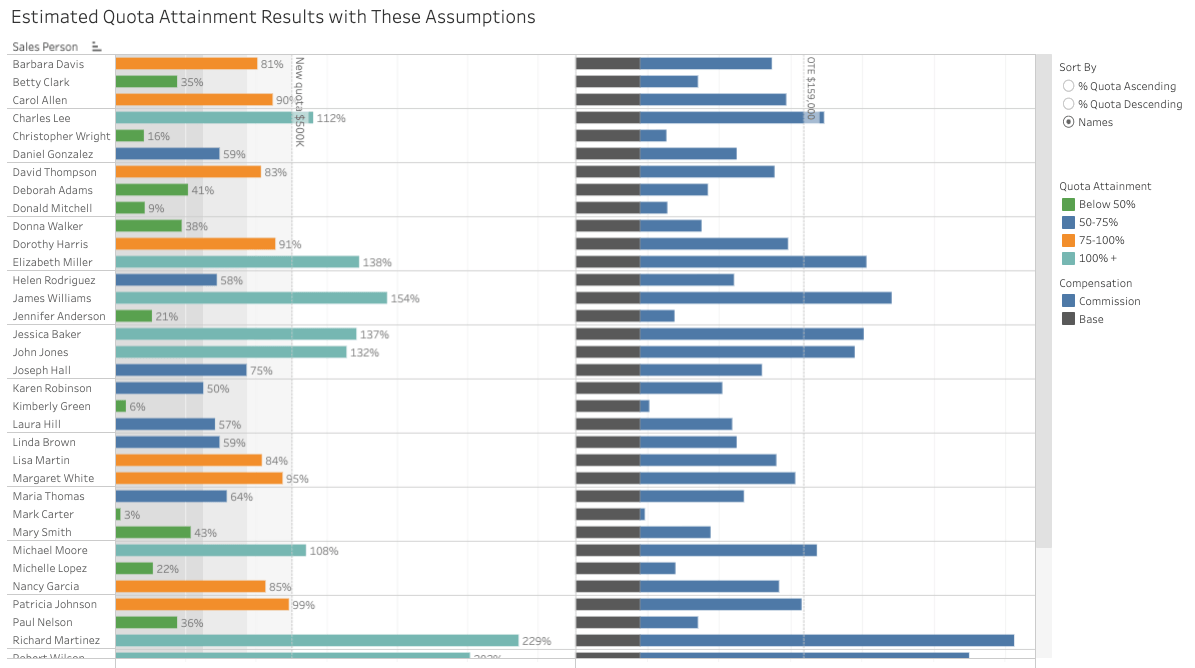
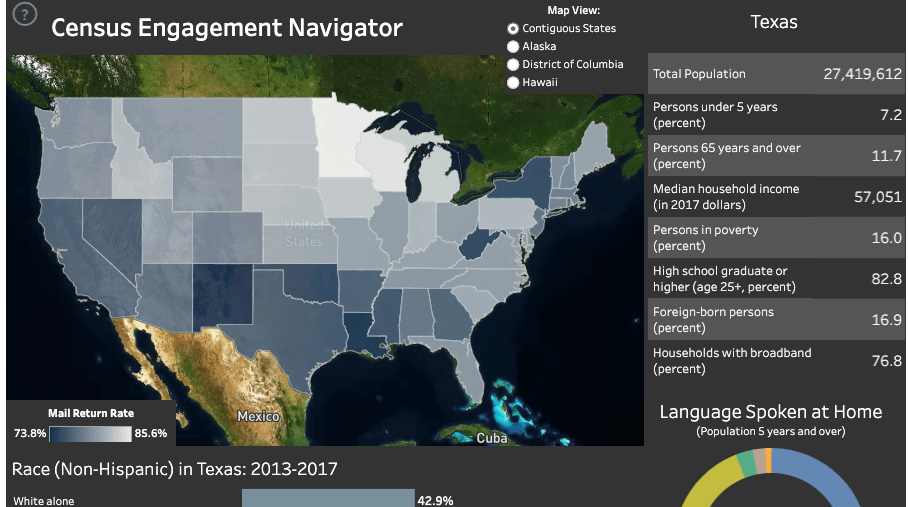
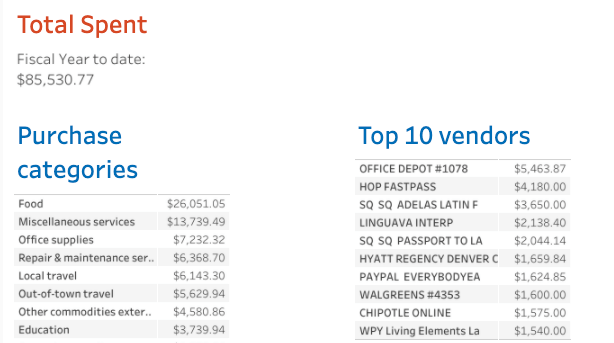
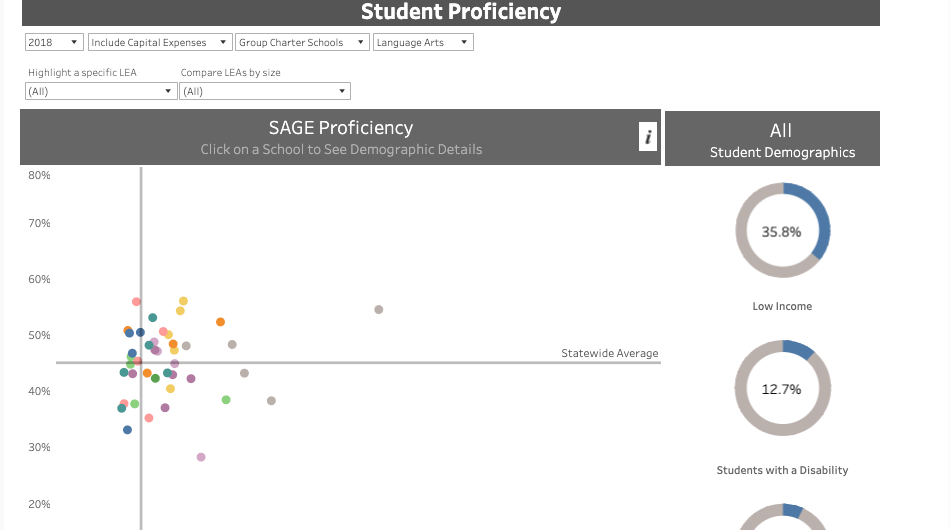
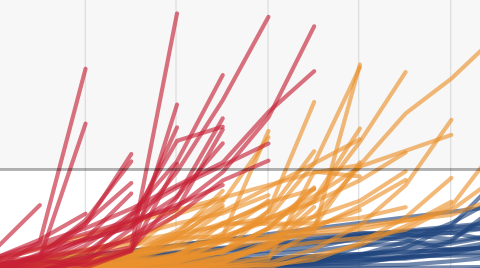
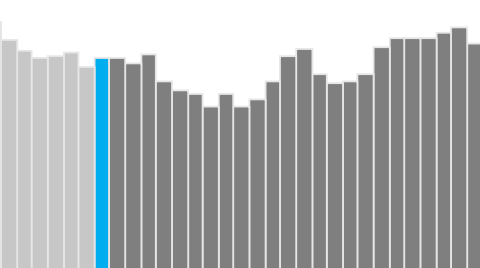
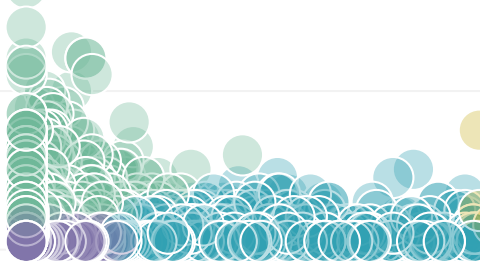
Tableau ช่วยให้ผู้คนสามารถค้นหาข้อมูลเชิงลึกจากข้อมูลของตนเอง สร้างแดชบอร์ดที่สวยงามและใช้งานง่าย และแบ่งปันกับองค์กรและชุมชนในวงกว้างได้ ต่อไปนี้คือการแสดงภาพจากข้อมูลของ Tableau ที่เราชื่นชอบ
การแสดงภาพข้อมูลที่แนะนำ
ไอคอนสถิติเชิงลึก
ชุมชน Tableau
หากมีคำถามเกี่วกับ Tableau ค้นหาคำแนะนำจากผู้เชี่ยวชาญได้ทุกอย่าง ไม่ว่าจะเป็นการใช้ผลิตภัณฑ์ไปจนถึงโซลูชันของอุตสาหกรรม เรามีกลุ่มผู้ใช้และหัวข้อในฟอรัมสำหรับคุณ เข้าร่วมวันนี้เลย!
ไอคอนสถิติเชิงลึก
เรียนรู้ Tableau ในแบบของคุณ
ไม่ว่าคุณจะเป็นผู้ใช้ที่มีประสบการณ์หรือเพิ่งสร้างทักษะด้านข้อมูล เราสามารถช่วยคุณยกระดับความรู้เกี่ยวกับ Tableau ได้
ลองใช้ Tableau ฟรี
หากเป็นเรื่องเกี่ยวกับการยกระดับประสิทธิภาพในการใช้ข้อมูลแล้วล่ะก็ มีเพียง Tableau เท่านั้นที่ผสมผสานการมุ่งเน้นวิธีที่ผู้คนดูและทำความเข้าใจข้อมูล เข้ากับแพลตฟอร์มที่มีประสิทธิภาพสูงและปรับขนาดได้ ซึ่งแม้แต่องค์กรที่ใหญ่ที่สุดในโลกก็ยังจำเป็นต้องใช้