How to Get Ready for the Next Iron Viz Competition


Tableau Visionary, Tableau Public Ambassador, and co-leader of the London Tableau User Group, Sarah Bartlett offers her guidance on the best ways to prepare to participate in a data viz competition. In 2018, Sarah was an Iron Viz Europe Finalist, however she almost didn’t enter the competition. A year later, Sarah founded Iron Quest—a community challenge that helps people prepare for data viz competitions by practicing data sourcing, data prepping, and data visualization skills. Read on for Sarah’s insights on how you can prepare for the next Iron Viz.
Sarah Bartlett founded Iron Quest—a community challenge that helps people prepare for data viz competitions like Iron Viz.
Iron Viz is the ultimate battle of Tableau skills where three finalists go head-to-head in a 20-minute nail-biting viz battle using the same dataset on stage at the annual Tableau Conference. Each year, these finalists produce incredible vizzes in the final that no doubt leave many people (myself included) in awe! How do they come up with something so impressive in just 20 minutes?!
Let’s not forget, the finalists earned their place by rising to the top from hundreds of incredible Qualifier submissions. Their feeder entries were equally as impressive and rightfully helped them earn a place in the final.
While the vizzes produced for Iron Viz feature inspiring designs telling compelling stories, they can also be intimidating, regardless of whether you are new to Tableau or have been using it for a while. When looking at the entries produced throughout the competition, many are left thinking “I’ll never be able to build something like that!” Well, the good news is, you can!
Iron Viz Finalists were all new once and have mastered their skills over time. However, one thing they all have in common is their engagement in the Tableau Community, aka the #DataFam. I believe this is a key differentiator. By participating in the community, you can accelerate your Tableau skills, whilst also joining a network of like-minded data enthusiasts from across the globe.
Get started
Everyone started somewhere but from my experience, getting started can be the hardest part! It can be nerve-wracking to share your work with the community for the first time. When I published my first data viz to Tableau Public in 2016, I was incredibly nervous. I had very little experience with Tableau at the time but was eager to improve my skills and connect with the Tableau community, I just wasn’t entirely sure how to go about it.
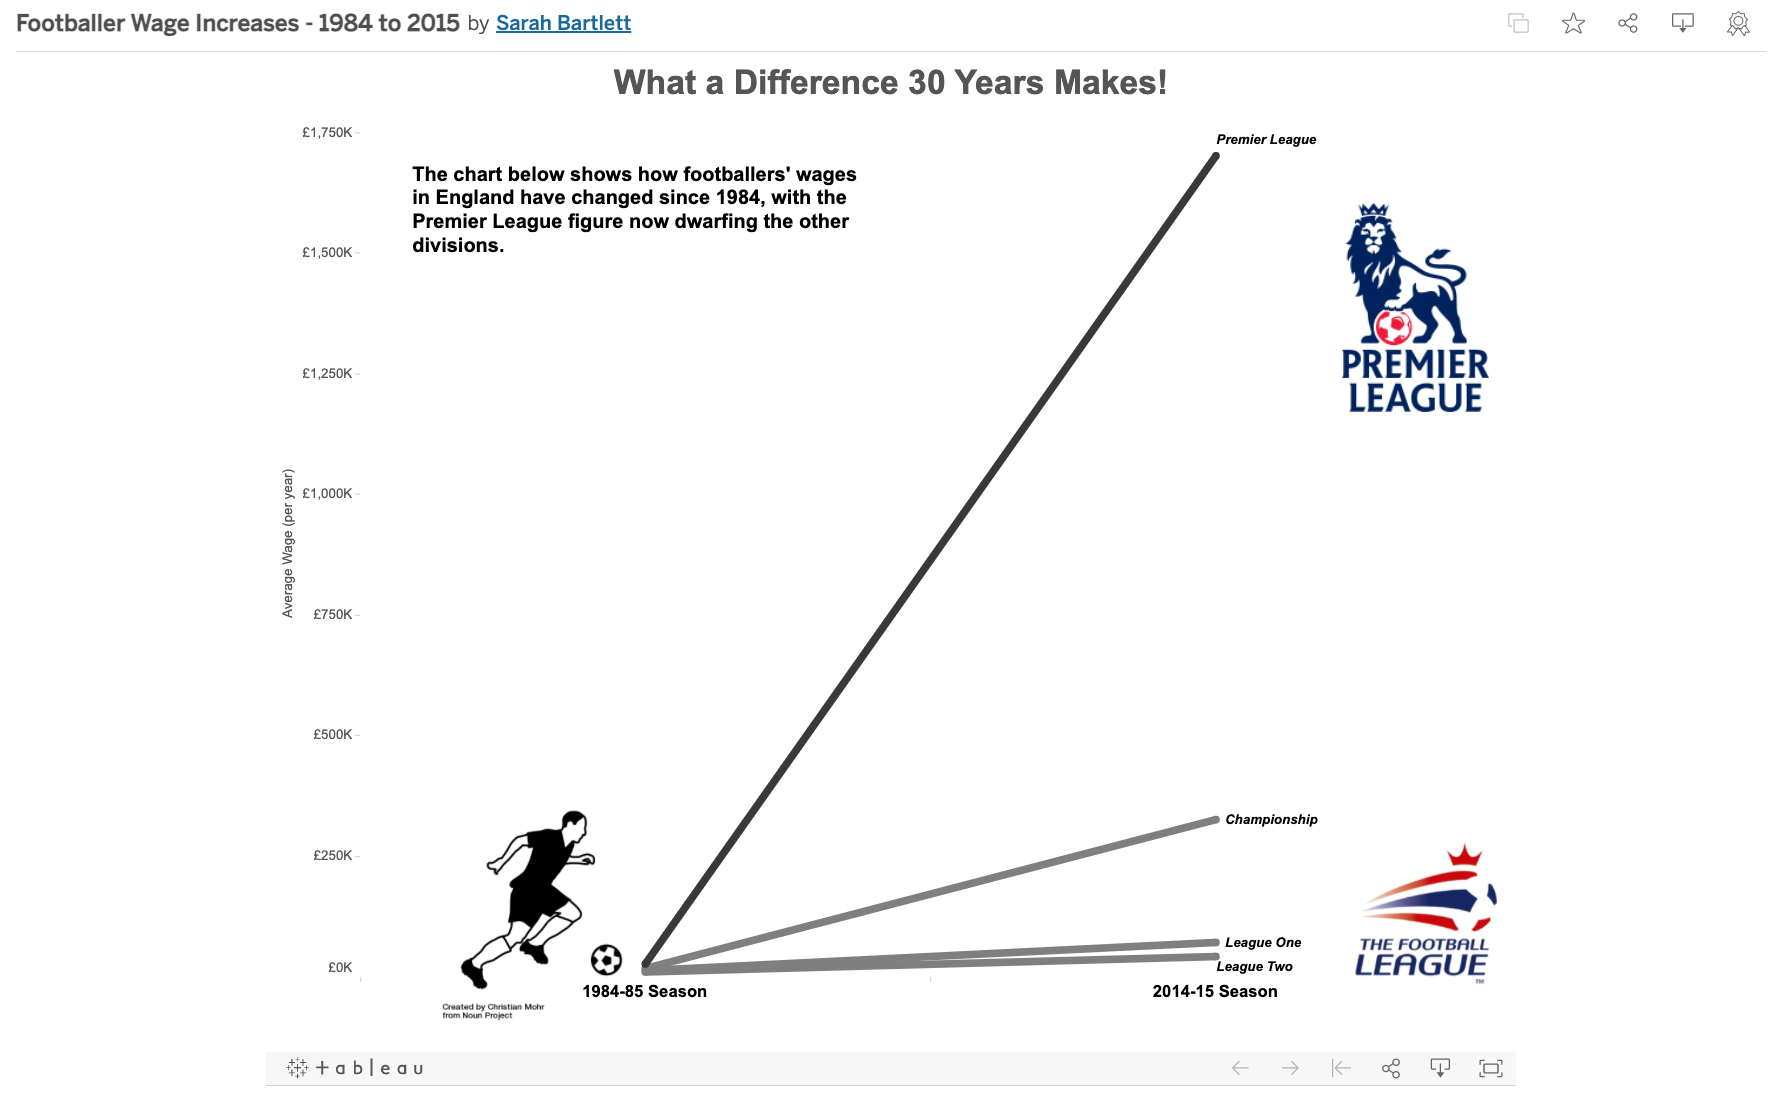
The first visualization I ever published on Tableau Public.
My entry point into the community was via the #MakeoverMonday community project which I discovered through social media (Twitter at the time!). I enjoyed seeing vizzes from regular participants such as Pooja Crahen (Pooja Gandhi) and Neil Richards on my timeline and had a lot of admiration for their creativity and technical skills.
Curious to learn more, I researched the project and how to participate and apprehensively, decided to give it a try. I enjoyed the process of constructing my viz far more than I had anticipated! Not only that, but I was welcomed into the community with open arms, and getting involved really helped me to connect with other community members. Once I got over the hurdle of publishing my first viz and understanding the process, I started participating more regularly and encouraged my team at work to do the same.
Participate in Community Projects
There are multiple Tableau Community-led projects you can join to help practice and refine your Tableau skills. Each of these projects is unique; there’s literally something for everyone, regardless of your interests or the amount of time you have to dedicate to vizzing. Some of the projects operate on a weekly cadence, while others run monthly or less often. Likewise, some offer datasets that are ready to use, while others require you to source your own data.
My advice would be to start with the projects that provide data sets with each challenge. You could challenge yourself to complete one challenge per week, whilst taking inspiration from the prior entries. Similarly, #WorkoutWednesday, like #MakeoverMonday, also operates on a weekly basis and provides data for you to visualize, while focusing more on building technical skills in Tableau.
Once you are more comfortable, there other projects such as #SportsVizSunday where you are tasked with sourcing your own data around a designated monthly theme. These projects are great if you want to challenge yourself with a bigger data viz project. If you are specifically interested in refining your skills ready for Iron Viz, #IronQuest is the project for you! #IronQuest is modeled on the Iron Viz feeder competition with a different topic each month. Participants are asked to consider the Iron Viz scoring categories—Design, Storytelling, and Analysis—when building their vizzes, and also have the opportunity to request feedback on their work.
Seek Feedback
Don’t be afraid to request feedback on your vizzes. Feedback can help to elevate your data visualization skills and identify areas for improvement that you may have missed. Since 2021, I've been running an Iron Viz feedback initiative with a group of community members and former Iron Viz contestants to help support those entering the Iron Viz feeder competition. Recognizing that asking for feedback can be challenging, I thought this would be a good way to make this process slightly less intimidating. What's more, it can sometimes feel lonely working on your entry so the feedback initiative offers a way of connecting with others on a call and discussing your viz in a safe environment. I'm honored that the last three Iron Viz champions have used this service, along with almost all of the finalists in the last three years! I'm excited to be running the initiative again this year. More information on how to participate will be made available on my website soon. However, aside from initiatives like this, it can be challenging to know how to request feedback and who to approach.
While some projects like #IronQuest include a feedback option, many don’t. I often see community members add “feedback appreciated” to their social posts on X/twitter when sharing their latest Tableau Public vizzes, but rarely is this the most effective approach. Not only is this approach reliant on someone reading your tweet and responding (and that someone could be anyone), it can also be problematic if the person providing the feedback doesn’t have a clear understanding of what you were trying to achieve with your visualization.
A better approach would involve either messaging people directly to request feedback, or requesting feedback by direct message aka DM (assuming you are sharing your work on social media). Not only are you likely to receive more detailed, contextual feedback this way, it’s also a great opportunity for you to build relationships with other community members. It’s best to ask people in advance if they would be willing to give you feedback from time to time, rather than messaging them directly with a viz that you would like feedback on.
While most people are willing to help, they may not have the time to respond to direct requests. If you choose to request feedback by DM, take the opportunity to describe your goals with the person who is providing the feedback so they have a clear picture of what you were trying to achieve. You could also use this opportunity to describe the areas you struggled with. You never know, they might have a solution or a helpful blog post to share with you!
Data Viz Inspiration
Now you know where to start, the next thing you need to consider is what to viz! While community projects offer topics to viz, it can still be difficult to actually formulate ideas and decide how to approach your visualization.
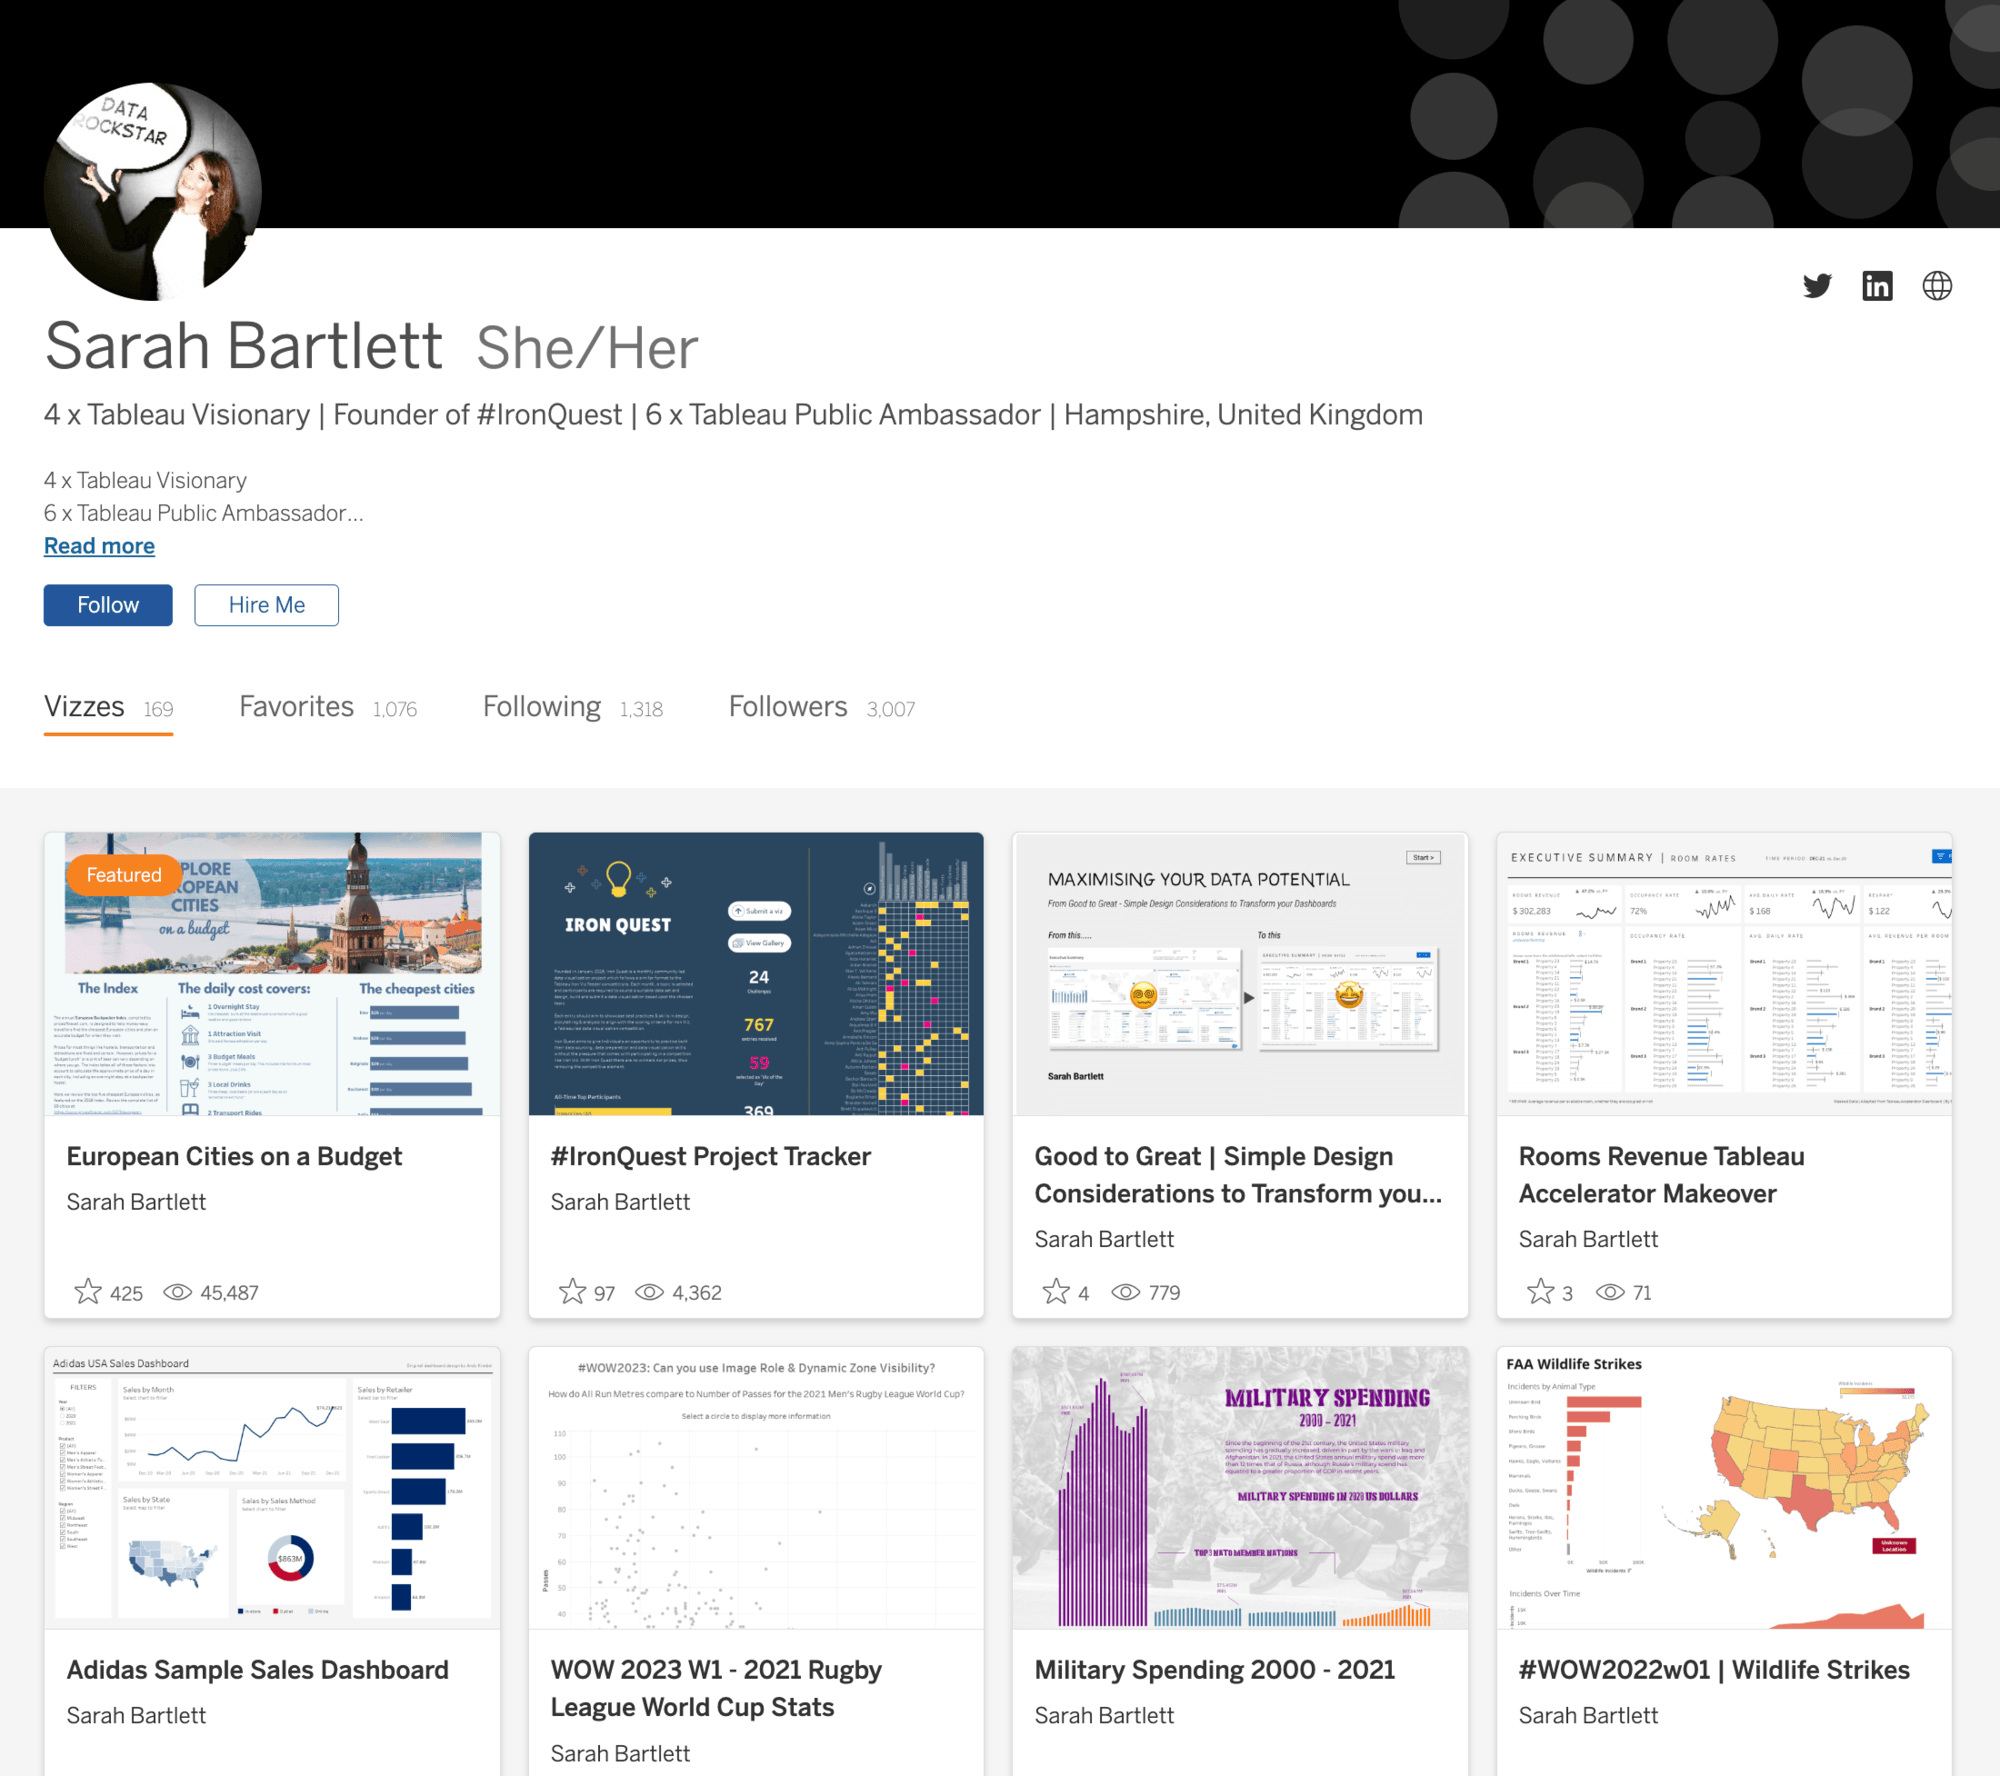
When I’m looking for viz inspiration, I always start by browsing Tableau Public! There are literally millions of vizzes to explore, covering countless topics and data sets! The best place to start is on Discover. Here, you’ll be presented with the latest Viz of the Day, as well as a collection of vizzes based on who you follow and vizzes you have liked previously. You’ll find a collection of vizzes grouped around different viz types or topics which can be incredibly useful for inspiration!
I try to seek inspiration from outside sources too. My favorite sites include Pinterest, Dribble and Behance, while I also bookmark content I find online from news agencies or other authors which I think could be useful later. Pinterest allows you to create boards based on topics of your choice. These can be really useful if you want to "pin" a collection of vizzes into the same group and create a moodboard of inspiration for your viz. Dribble and Behance also allow you to like different designs and group your likes into collections (Dribble) or Moodboards (Behance) centered around different topics or themes.
I hope this blog has inspired you to get started on your data viz journey. I hope to see you participate in the next Iron Viz!
Verwante verhalen

9 Tips to Succeed in a Tableau DataDev Hackathon
 8 januari, 2025

A Guide to Mapping and Geographical Analysis in Tableau
 15 november, 2024

Making Tables Smarter: Key Features of the Tableau Table Viz Extension
 14 november, 2024