DataFam Roundup: October 31 - November 4, 2022


Welcome! Dig into this week's DataFam Roundup—a weekly blog that brings together community content all in one post. As always, we invite you to send us your content—and the DataFam content from your peers that have inspired you! Find the content submission form here.
DataFam content
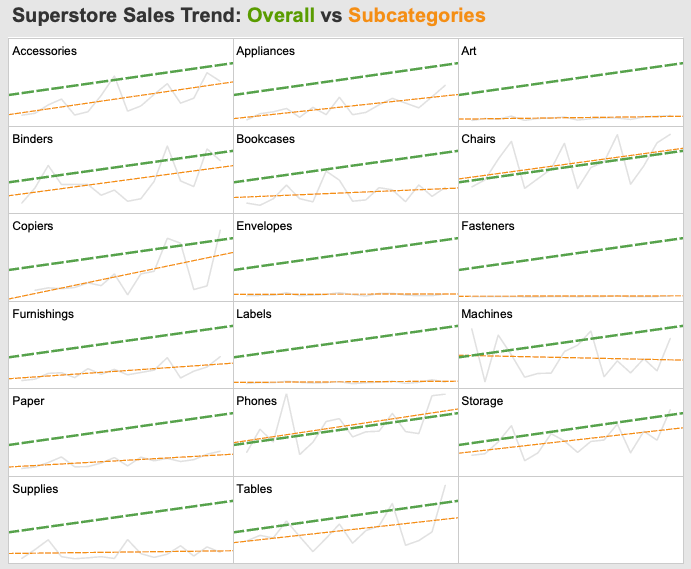
Alexander Mou, Vizdiff: Resolving Simpson's Paradox: The Whole vs The Parts
Dive into content created by the Tableau Community:
-
Andy Kriebel, The Dual Axis Podcast:
-
The Mindset of a Winner with Will Sutton
-
The Joy of Being Kind to Others with Elisa Fink
Ansula Jain, TechiAnshi: How to become a Tableau Ambassador and my Ambassador Journey
-
-
Ken Flerlage, The Flerlage Twins: Tableau Set Control Part 2: Use Cases
-
CJ Mayes: What’s Good? Learning Is an Imperfect Process – Sean Miller (November)
-
Christian Silva and Marc Montanari, The Data Coffee Break Podcast: Episode #3 - Top 10 tips to become a presentation master
-
Adam Mico, Data Leadership Collaborative: Three Strategies To Improve Data Literacy Within Your Organization
-
Rosario Gauna, Rosarioviz: Subcategory Influence | Dynamic Zone Visibility
-
Alexander Mou, Vizdiff: Resolving Simpson's Paradox: The Whole vs The Parts
Team Tableau
Upcoming events and community participation
-
Nominations are OPEN for the 2022 Data Literacy Awards! | Data Literacy It's that time of year again! We'd like your help identifying the individuals and content that helped to advance Data Literacy the most this past year.
-
Chart Chat Live--Round 35 Watch as Jeffrey Shaffer, Steve Wexler, Andy Cotgreave, and Amanda Makulec debate the good, the bad, "scaredy-cats" of data visualization. And make sure to stay for the afterparty where you can chat with the hosts. RJ will discuss his new Information Graphic Visionaries book series that explores the incredible data visualization work of Emma Willard, Florence Nightingale, and Étienne-Jules Marey.
-
Tableau Tips for Tomorrow's Leaders Join this virtual event to hear from Tableau community Ambassadors as they share their favorite Tableau Tips, learn helpful hidden gems and secret hacks you probably haven't seen before, and support our vision and building for the next generation.
-
Women in Dataviz is moving from Discord to Slack. Join here.
-
What does it mean to be a Data Leader? Join this Data Leadership Collaborative (DLC) Roundtable to learn what it means to be a Data Leader from three community members.
-
Iron Viz Feedback Initiative 2023: Book a 15-minute feedback session with Tableau community members and prior Iron Viz contestants who will review your viz and share feedback on your Iron Viz entry.
-
Storytelling With Data - London Workshop: Join Cole and members of the team in London to learn about visualization and data storytelling best practices in an engaging, hands-on in-person session!
Vizzes
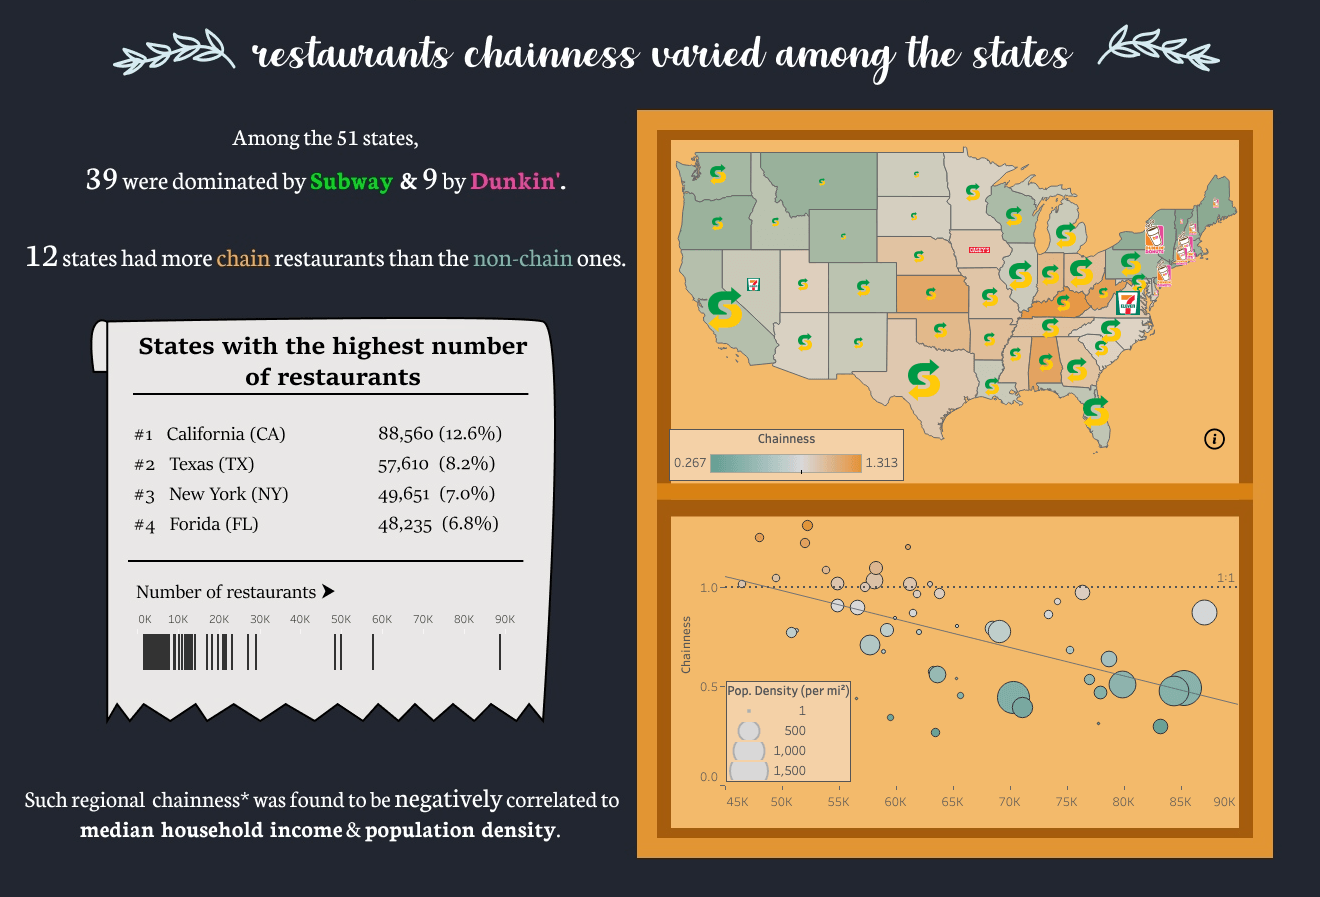
Stanley Kin Nok Chan: Food monopoly - Dominance of Chain Restaurants in the US
See the latest Viz of the Day, trending vizzes, featured authors, and more on Tableau Public.
Check out some inspirational vizzes created by the community:
- Stanley Kin Nok Chan: Food monopoly - Dominance of Chain Restaurants in the US
Community Projects
Back 2 Viz Basics
A bi-weekly project helping those who are newer in the community and just starting out with Tableau. Not limited just to newbies!
Web: Back 2 Viz Basics
Twitter: #B2VB
Week 22: Expand/Update a Viz
Workout Wednesday
Build your skills with a weekly challenge to re-create an interactive data visualization.
Web: Workout Wednesday
Twitter: #WOW2022
Week 44: What is the lifetime value of customers?
Makeover Monday
A weekly social data project.
Web: Makeover Monday
Twitter: #MakeoverMonday
Week 44: Fundraising by Members of the 117th Congress
Preppin' Data
A weekly challenge to help you learn to prepare data and use Tableau Prep.
Web: Preppin’ Data
Twitter: #PreppinData
Week 44: Creating Order IDs
DataFam Con
A monthly challenge covering pop culture and fandoms.
Web: DataFam Con
Twitter: #DataFamCon
October 2022: Stranger Things + Music Nostalgia Month
EduVizzers
A monthly project connecting real education data with real people.
Web: Eduvizzers
November 2022: Student Loan Borrowing and Repayment
Games Night Viz
A monthly project focusing on using data from your favorite games.
Web: Games Nights Viz
Twitter: #GamesNightViz
October 2022: IronViz Edition: Tips from the Team
Iron Quest
Practice data sourcing, preparation, and visualization skills in a themed monthly challenge.
Web: Iron Quest
Twitter: #IronQuest
August 2022: The Tour: The Sound of Games with #DataPlusMusic
Public Policy Viz
Bridging the gap between analytics professionals and policy practitioners.
Web: Public Policy Viz
Twitter: #PublicPolicyViz
Project 1: Redlining in Pittsburgh, PA
Data Plus Music
A monthly project visualizing the data behind the music we love!
Web: Data Plus Music
Twitter: #DataPlusMusic
July 2022: The Intro
Storytelling with Data
Practice data visualization and storytelling skills by participating in monthly challenges and exercises.
Web: Storytelling with Data
Twitter: #SWDChallenge
November 2022: comedic charts
Project Health Viz
Uncover new stories by visualizing healthcare data sets provided each month.
Web: Project Health Viz
Twitter: #ProjectHealthViz
August 2022: Mental Health Care Professionals Shortages
Diversity in Data
An initiative centered around diversity, equity & awareness by visualizing provided datasets each month.
Web: Diversity in Data
Twitter: #DiversityinData
September 2022: Global Women
Sports Viz Sunday
Create and share data visualizations using rich, sports-themed data sets in a monthly challenge.
Web: Sports Viz Sunday
Twitter: #SportsVizSunday
October 2022: Row, row, row your boat
Viz for Social Good
Volunteer to design data visualizations that help nonprofits harness the power of data for social change.
Web: Viz for Social Good
Twitter: #VizforSocialGood
Sept 2-Sept 30 2022: India Water Portal/Arghyam
Real World Fake Data
Create business dashboards using provided data sets for various industries and departments.
Web: Real World Fake Data
Twitter: #RWFD
Session 3: Community Service Requests
SDG Viz Project
Visualize data about Sustainable Development Goals provided by the World Health Organization.
Web: SDG Viz Project
Twitter: #TheSDGVizProject
Verwante verhalen

DataFam Roundup June 2026

DataFam Roundup May 2026

Iron Viz 2026: Read Between the Data
 28 mei, 2026