Alle verhalen
 Data
DataHow analytics can supercharge holiday retail sales
 21 november, 2017
Thanksgiving weekend kicks off the holiday shopping season in the United States. And once more, retailers will compete for a share of consumers’ gift purchases.
21 november, 2017
Thanksgiving weekend kicks off the holiday shopping season in the United States. And once more, retailers will compete for a share of consumers’ gift purchases. Tableau
Our 2018 business intelligence trends have arrived
 15 november, 2017
To help kick start the new year, we surveyed Tableau’s brain trust and aggregated the top 10 business intelligence trends you should pay attention to in 2018. From our talented engineers to seasoned product managers, we narrowed down the business intelligence trends bound to go from idea to implementation.
15 november, 2017
To help kick start the new year, we surveyed Tableau’s brain trust and aggregated the top 10 business intelligence trends you should pay attention to in 2018. From our talented engineers to seasoned product managers, we narrowed down the business intelligence trends bound to go from idea to implementation.
 Tableau Cloud
Calling all Cloud customers and enthusiasts! What to expect at AWS:reInvent 2017
 15 november, 2017
Tableau is excited to partner with AWS at their annual Customer and Partner Conference, AWS re:Invent, which will happen in Las Vegas November 27 - December 1, 2017.
15 november, 2017
Tableau is excited to partner with AWS at their annual Customer and Partner Conference, AWS re:Invent, which will happen in Las Vegas November 27 - December 1, 2017.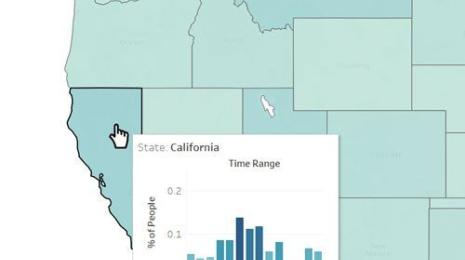 Product
Viz in Tooltip is here!
 15 november, 2017
In our upcoming Tableau 10.5 release, we’re proud to deliver on our promise of hosting incredible visualizations in tooltips. Not only is this feature an engaging form of viz interactivity, it’s also a fantastic way to augment your dashboards and stories with relevant data without introducing more clutter.
15 november, 2017
In our upcoming Tableau 10.5 release, we’re proud to deliver on our promise of hosting incredible visualizations in tooltips. Not only is this feature an engaging form of viz interactivity, it’s also a fantastic way to augment your dashboards and stories with relevant data without introducing more clutter. Enterprise
The 5 phases of today’s analytic workflow
 10 november, 2017
A modern analytics approach is critical to glean beneficial data insights
10 november, 2017
A modern analytics approach is critical to glean beneficial data insights
 Enterprise
IT increase adoption and scale Tableau across Daimler
 7 november, 2017
We asked Benjamine from Daimler AG to share his learning and tips around implementing an enterprise-wide Tableau deployment.
7 november, 2017
We asked Benjamine from Daimler AG to share his learning and tips around implementing an enterprise-wide Tableau deployment.
 Best of Tableau Web
Best of the Tableau Web: Beautiful pi charts and dashboard design thinking
 3 november, 2017
The end of October has come and gone— which means it’s time for another Best of the Tableau Web!
 Tableau Cloud
Announcing support for Amazon Redshift Spectrum (external S3 tables) in Tableau 10.4!
2 november, 2017
We're excited to announce support for Amazon Redshift Spectrum (external S3 tables) in Tableau 10.4! Enterprise
Five surefire ways to get value from your IoT data today
30 oktober, 2017
With the rise of low-cost sensors, ubiquitous connectivity, and massive data volumes, the “Internet of Things” promises to change the world. Don’t let data challenges get in the way.
